
Is Uniswap a Good Buy at Current Prices?
Uniswap has gained about three quarters since August, and the trend test we set back then has been passed. What the fee switch, CME futures and the correction since September mean now: is Uniswap a good buy at current prices?





Which topics should we dive deeper into?
Select what genuinely interests you. Your picks feed directly into our editorial planning.
Crypto news that's actually worth your time.
Weekly. 60 seconds. Carefully curated by our editors: no hype, no promo flood, no spam.
Uniswap (UNI) changes hands at 7.62 US dollars in the early hours of Thursday, 22 October 2026, up 2.2 percent over 24 hours. Since our first assessment on 25 August, when UNI cost 4.39 dollars, the price has risen 73.5 percent. The path in between went far beyond today's level: on 22 September UNI closed at 10.25 dollars, its highest daily close of the past twelve months, and on 23 September it touched 10.88 dollars intraday. Since then it has given back a quarter of that peak, with the October low at 6.80 dollars on 13 October. A market capitalisation of 4.76 billion dollars now ranks UNI 20th, against 32nd in August. The question is the same, the starting point is not: is Uniswap a good buy at the current price, or are you buying the tail of a move that has already peaked?
cryptoticker.io collected the underlying price data itself late on 21 October 2026. Source: market data from CoinMarketCap. Method: daily closing prices over the past twelve months plus the current spot quote as the final data point, with exponential moving averages and the relative strength index derived using the standard formulas, the RSI after Wilder over 14 days. Intraday highs and lows come from CoinMarketCap's daily candles. The table sets today's readings against those of our first analysis on 25 August.
| Metric | 25 August 2026 | 22 October 2026 |
|---|---|---|
| Price | $4.39 | $7.62 |
| 50-day average | $3.70 | $7.32 |
| 200-day average | $3.98 | $5.48 |
| Distance to the 200-day line | +10.6% | +39.1% |
| Relative Strength Index (14 days) | 65.5 | 49.2 |
| Trading volume, 24 hours | $292.6m | $603.4m |
| Market capitalisation | $2.74bn | $4.76bn |
Uniswap price analysis: where the UNI price stands and which levels matter
At 7.62 dollars UNI trades 4.0 percent above its 50-day exponential moving average of 7.32 dollars and 39.1 percent above its 200-day average of 5.48 dollars. Both lines still sit beneath the price, so the constructive alignment of August is intact. What has changed is the spacing. In August the price stood 18.8 percent above the fast line and 10.6 percent above the slow one. Today it is the other way round: the 50-day average has closed to within 4 percent of the price, while the 200-day average lies almost 40 percent below it.
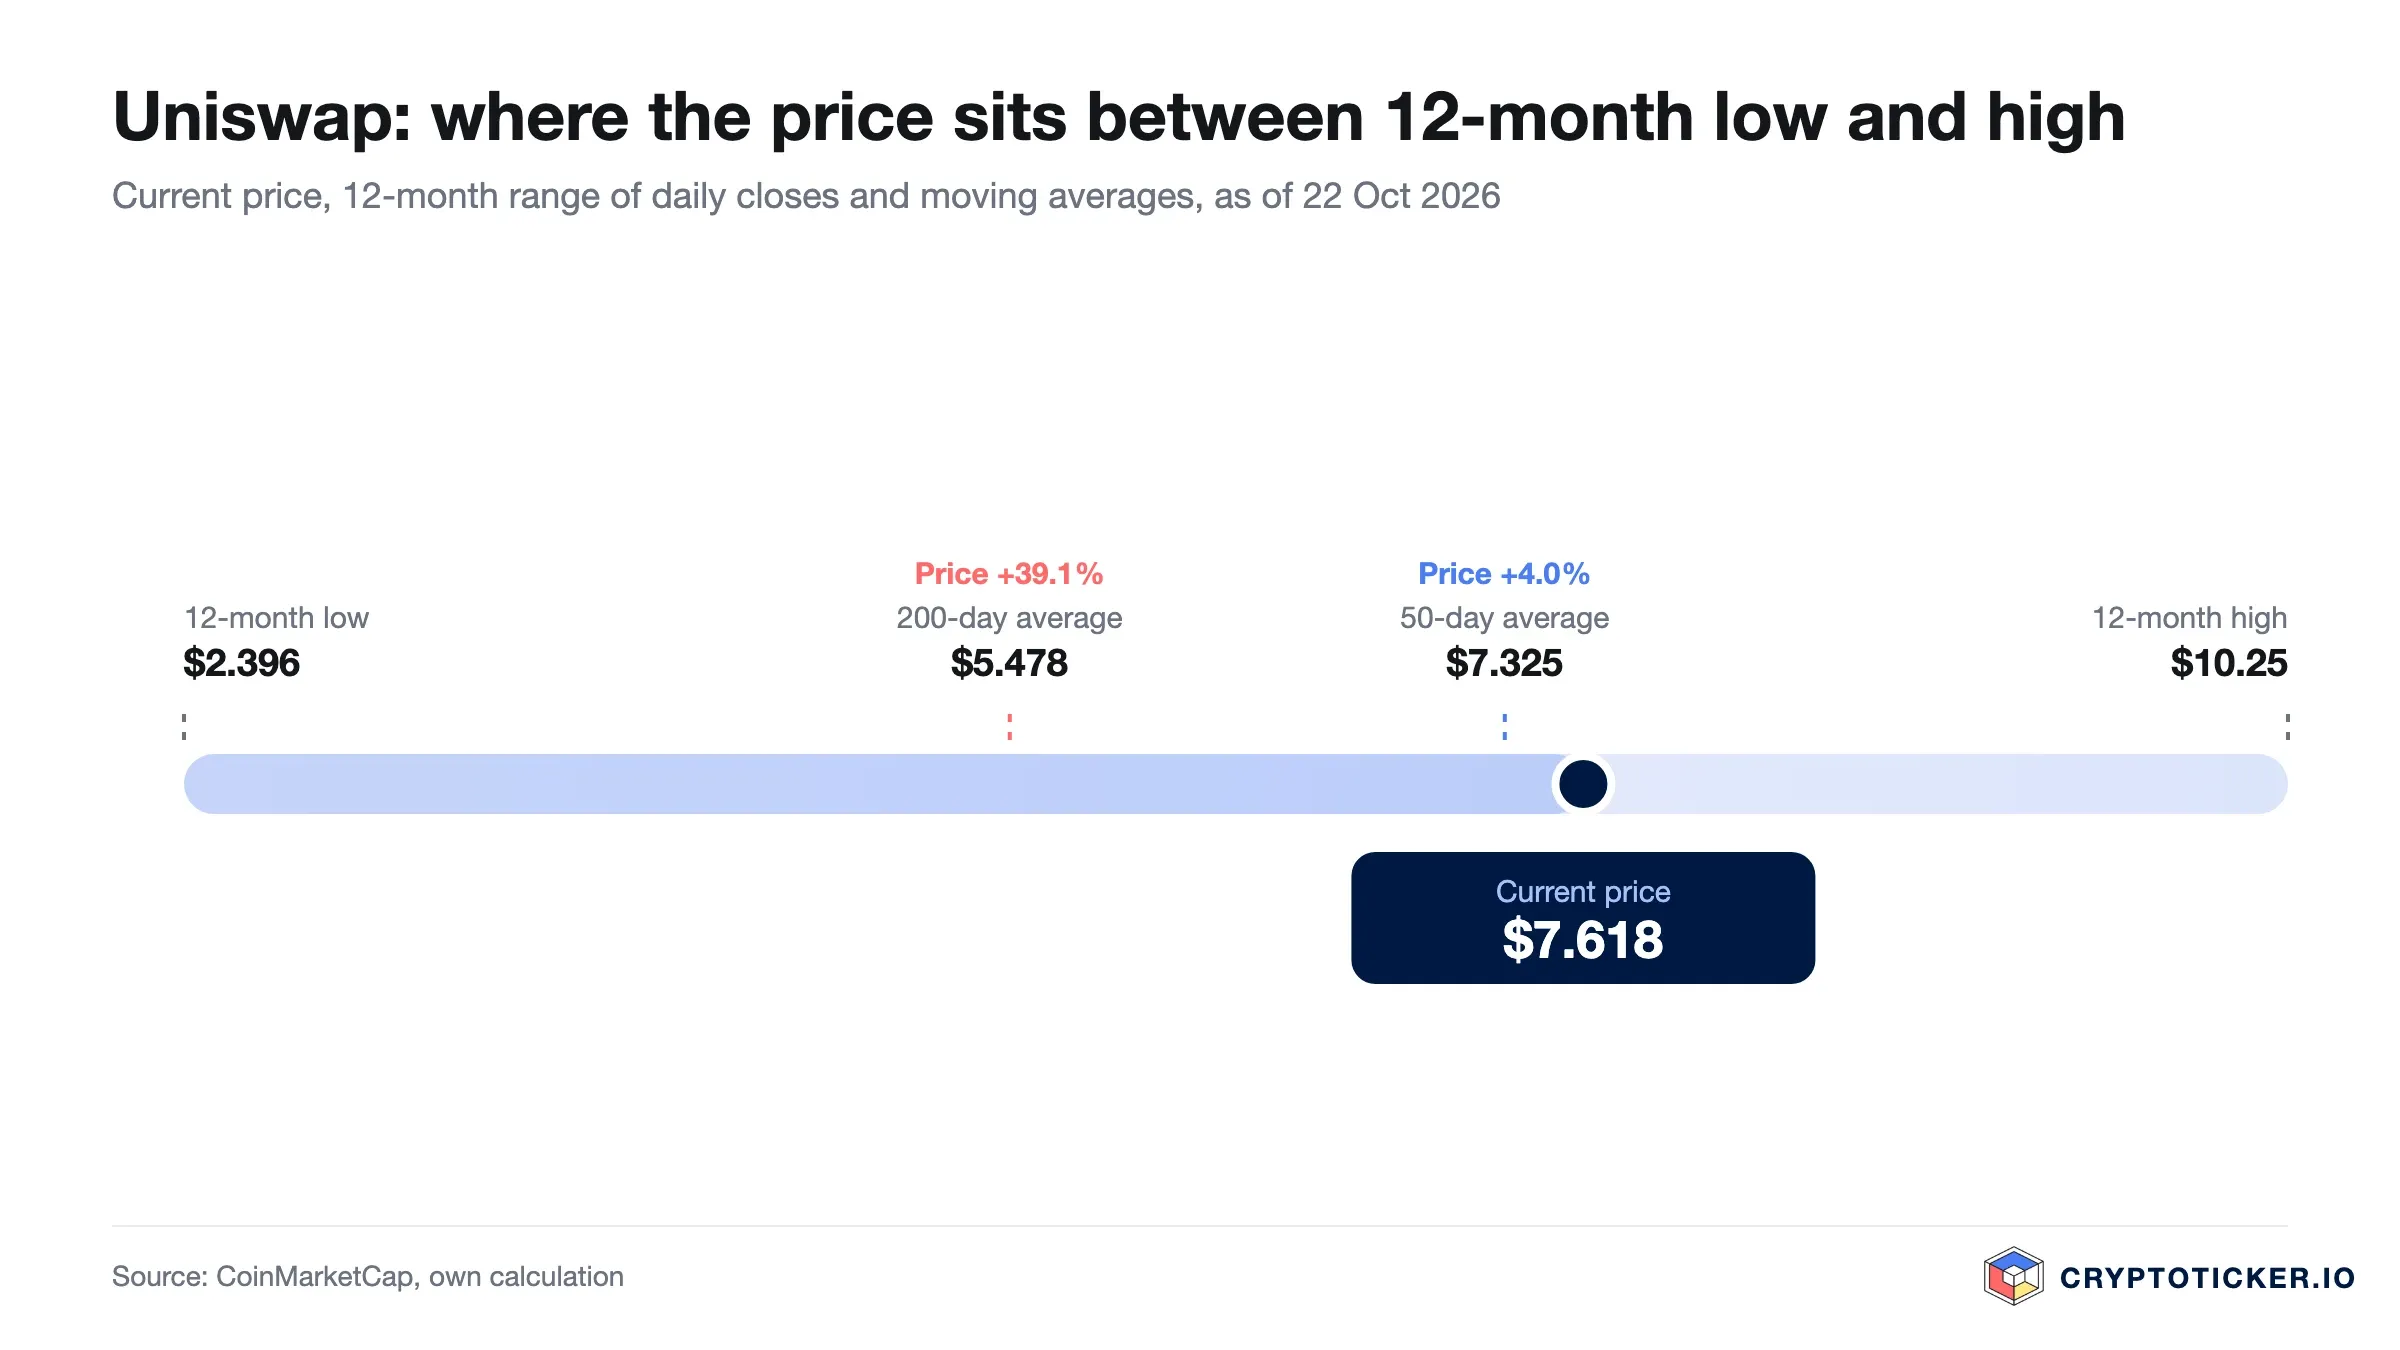
Overhead, the first marker is the highest October close of 9.09 dollars from 4 October, then the twelve-month closing high of 10.25 dollars from 22 September and the intraday peak of 10.88 dollars from 23 September. Since 13 October UNI has traded between 6.80 and 7.64 dollars intraday; the current price sits at the top of that band, and a breakout would only be confirmed by a daily close above it. Below, the levels are the 50-day average at 7.32 dollars, the October low at 6.80 dollars and, at some distance, the 200-day average at 5.48 dollars. A longer-dated view sits in our Uniswap price prediction; this page deals with the narrower question of an entry at today's price.
Is the Uniswap downtrend broken or only interrupted?
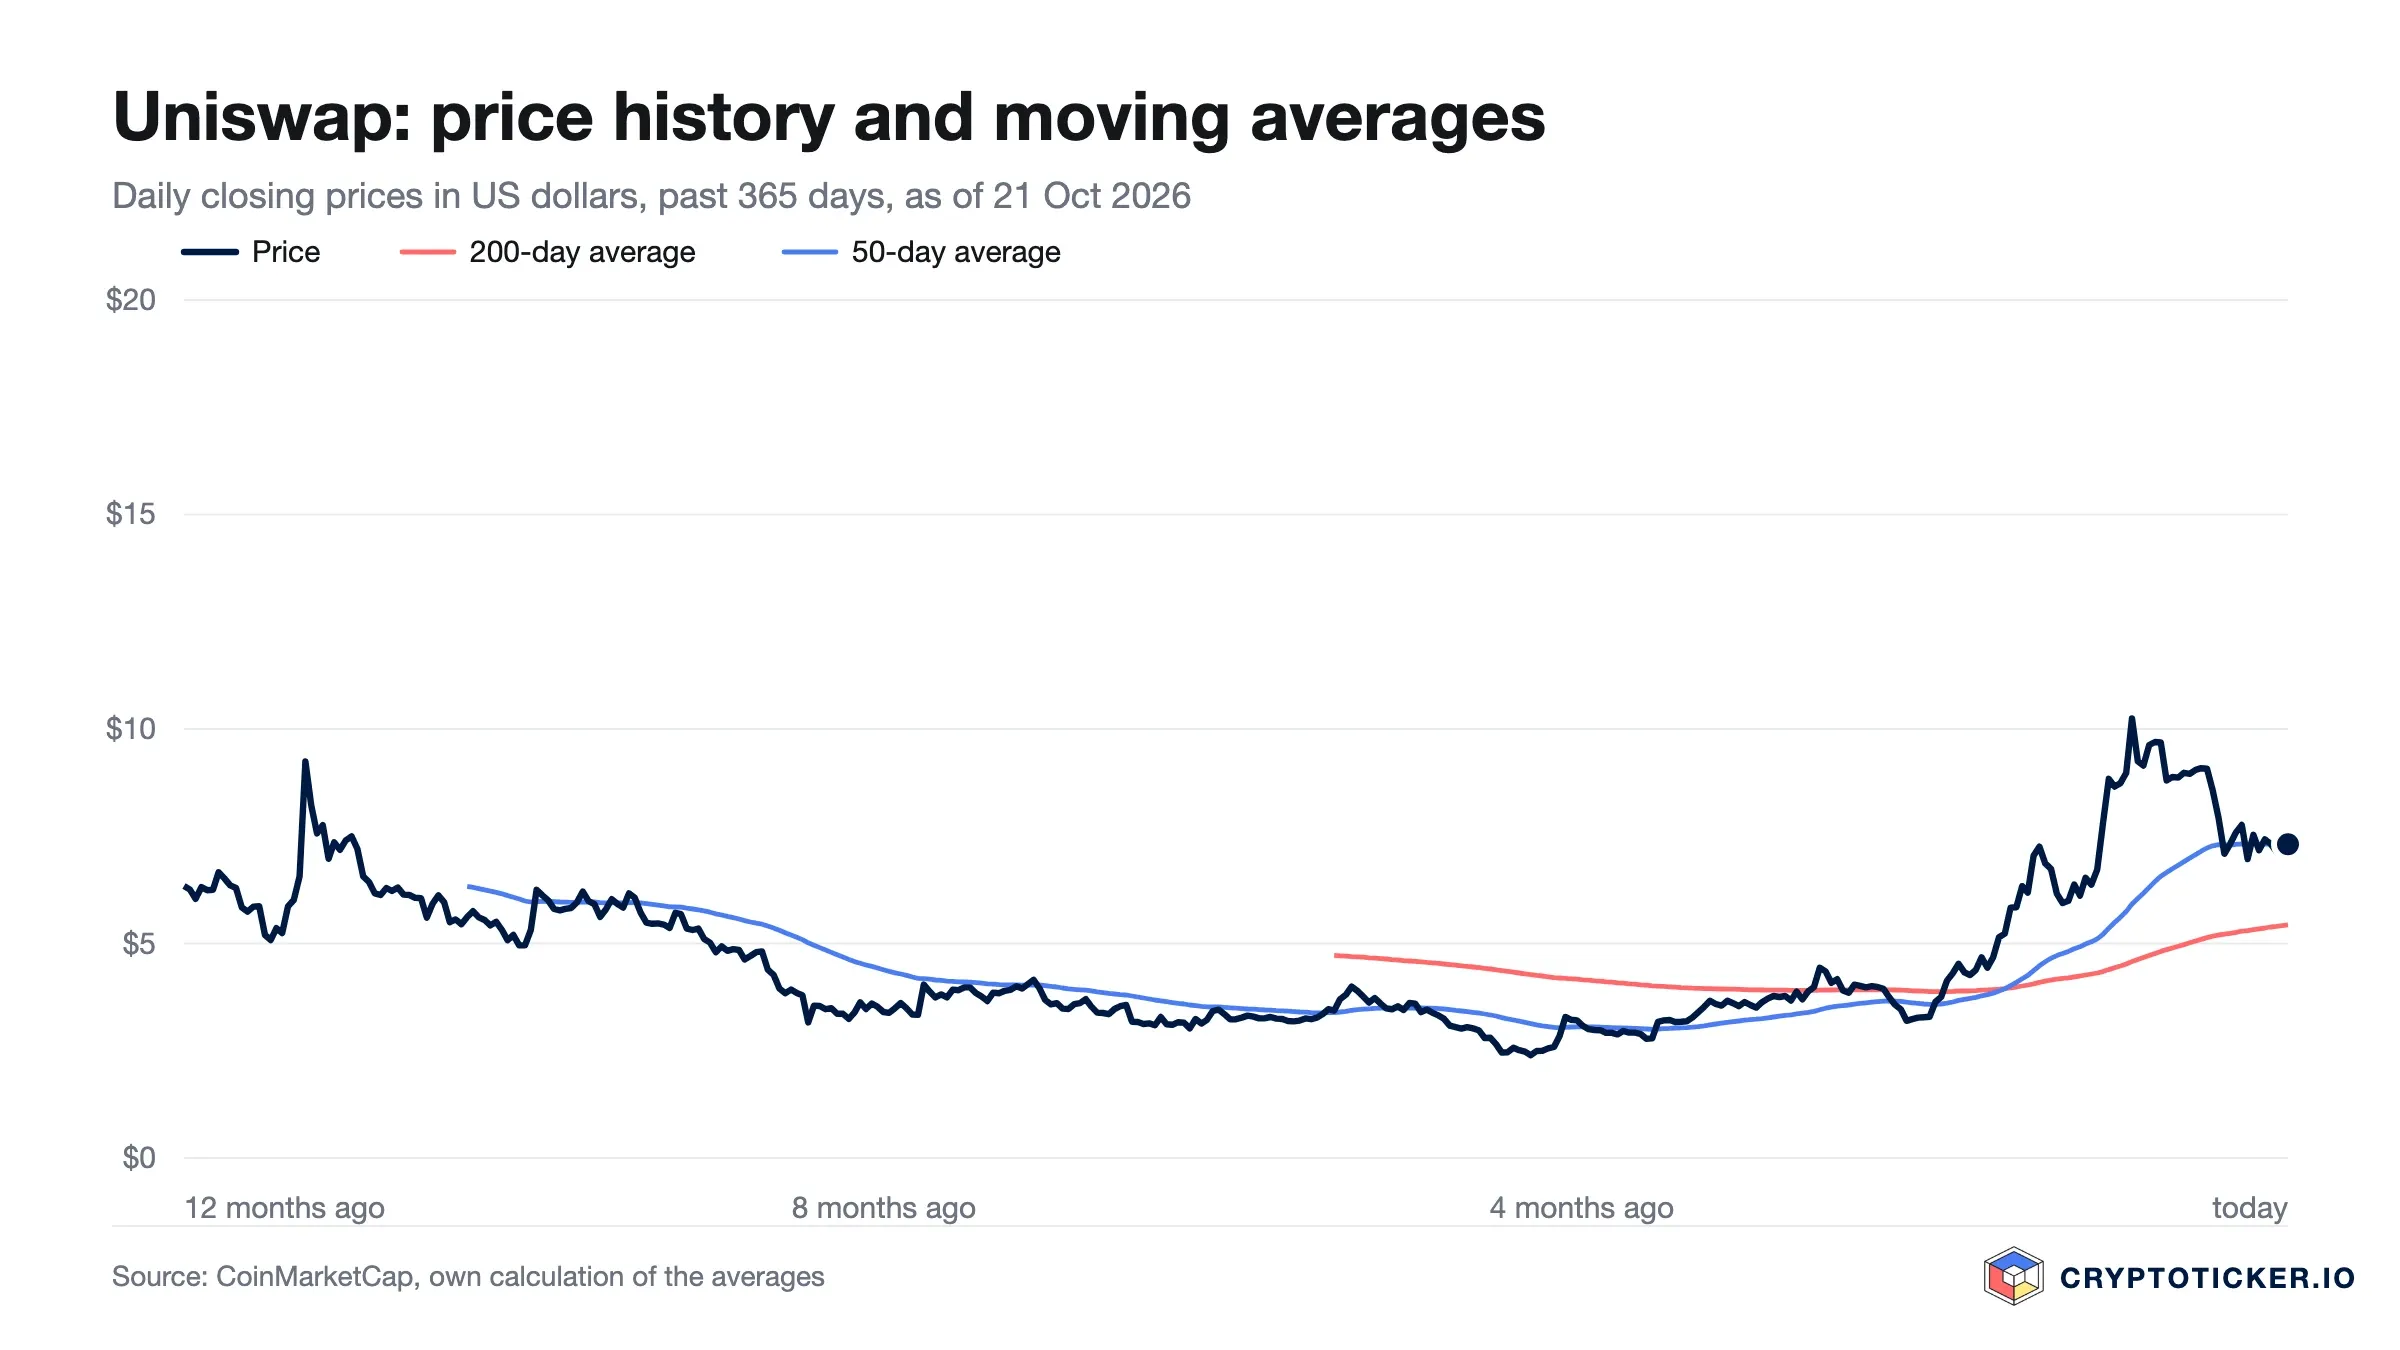
On 25 August we set out a falsification test here. If UNI closed back below the 200-day line, then at 3.98 dollars, and held there for more than a few sessions, the reclaim was a spike inside a continuing downtrend. If the 50-day average instead rose through the 200-day while the price held above both, the transition was complete. The second condition has been met and the first has not. By the same method as in August, the 50-day average crossed the 200-day from below with the close of 2 September, at 4.09 against 4.04 dollars. UNI has not closed below its 200-day average since 21 August, and it has not even traded below it intraday: the lowest daily low after our analysis was 4.17 dollars on 26 August. On our own definition, the downtrend has been broken since early September.
The catalysts that followed are documented. On 17 September the US Securities and Exchange Commission granted an exemption that lets tokenised US equities trade through automated market makers, the design Uniswap stands for. On 18 September UNI turned over 2.12 billion dollars in a single day, more than nine times the twelve-month median we measured in August, and on 22 September CME Group announced futures on UNI. Over 90 days the token is up 101.8 percent, over a year 21.7 percent: twelve months ago it traded at 6.26 dollars.
Since late September the direction has turned. From 5 to 8 October, during the market-wide sell-off that brought 1.16 billion dollars of liquidations on 8 October, UNI lost 22.0 percent on a closing basis, and 12 October added a daily decline of 10.2 percent. The monthly low came on 13 October at 6.80 dollars, and when many altcoins bottomed on 18 October, UNI held at 6.82 dollars. With the downtrend break confirmed, the open question is a new one: whether the band between 6.80 and 7.64 dollars is a floor for the young uptrend or a pause within the correction.
What RSI and moving averages mean for a Uniswap entry
The 14-day relative strength index reads 49.2, almost exactly mid-scale. On 25 August it stood at 65.5, in the upper third of the range. In between came a full swing: the index reached 84.1 on 6 September and 81.9 again on 22 September, then fell to 37.9 in the sell-off of 8 October. Since then it has moved between 39 and 47 and now sits just above that band. The overheating has been worked off entirely, but there is no oversold signal either.
The averages tell the same story. The 50-day line has gone flat since early October, moving only between 7.30 and 7.33 dollars from 7 to 20 October while the price crossed it eight times on a closing basis. The 200-day line keeps rising, from 5.22 dollars on 8 October to 5.46 dollars on 20 October, about 2 cents a day.
For an entry decision that changes the shape of the risk. In August the objection was distance: 18.8 percent above the 50-day line. Today that gap is small, and the drawdown risk sits elsewhere: 10.7 percent down to the October low of 6.80 dollars, 28.1 percent down to the 200-day average. The crypto fear and greed index from CoinMarketCap, at 81 in August, read 54 late on 21 October, a neutral market; its lowest reading of the past 60 days was 48 on 17 October.
What Uniswap trading volume reveals about demand
Over the past 24 hours UNI turned over 603.4 million dollars, against 292.6 million in August. The seven-day average stands at 456.2 million dollars, the 30-day average at 746.4 million, compared with 339.8 million and 242.0 million on 25 August. The 30-day average now runs at 3.3 times the twelve-month median of 225.1 million dollars we measured then, and the busiest day of the past three months was 18 September with 2.12 billion dollars.
That confirms what we described in August as a repricing with participation. In October turnover is cooling: the seven-day average sits 38.9 percent below the 30-day figure, which still contains the days around the September peak, and daily volume since 13 October has ranged between 277 and 665 million dollars. Since 19 October regulated UNI futures trade at CME, settled in cash rather than in tokens; how much of that reaches the spot price will only show in the volume of the first weeks. Contract sizes and background are covered in our piece on the CME Uniswap futures launch. Against a market capitalisation of 4.76 billion dollars and rank 20, liquidity is ample for retail-sized orders.
Which structural factors speak for Uniswap
Three structural features distinguish UNI from the wider field of mid-cap tokens. The first is the protocol behind it. Uniswap is the reference implementation of the automated market maker, and it still leads decentralised trading by a wide margin: in our own count of DefiLlama data on 18 September, Uniswap accounted for 30.4 percent of all decentralised exchange volume, while the next largest single competitor held 5.4 percent.
The second is the multi-chain footprint, including Uniswap's own layer-two network, Unichain. Its day-to-day operation is moving to Optimism: the testnet switched to OP Enterprise on 13 October and the mainnet follows on 29 October, with chain ID, contracts and balances unchanged according to Uniswap. Our piece on the Unichain move to OP Enterprise explains what changes behind the scenes. The protocol's growth remains bound to the scaling programme documented in the Ethereum roadmap.
The third factor was the sharpest open question in August, and it has an answer that our first version understated. Whether a share of trading fees reaches the token was settled by the governance vote on the UNIfication proposal in December 2025: the fee switch has been live on Ethereum since 28 December 2025, and votes in March and June 2026 extended it to several layer-two networks. Fees collect in a contract called TokenJar and can only be withdrawn through a second contract, Firepit, by burning UNI. Nothing is paid out; holders benefit only through a shrinking supply. On 7 October 38,000 UNI were burned within 24 hours, about 308,000 dollars, and our analysis of the Firepit burn and the UNI price puts that figure in proportion.
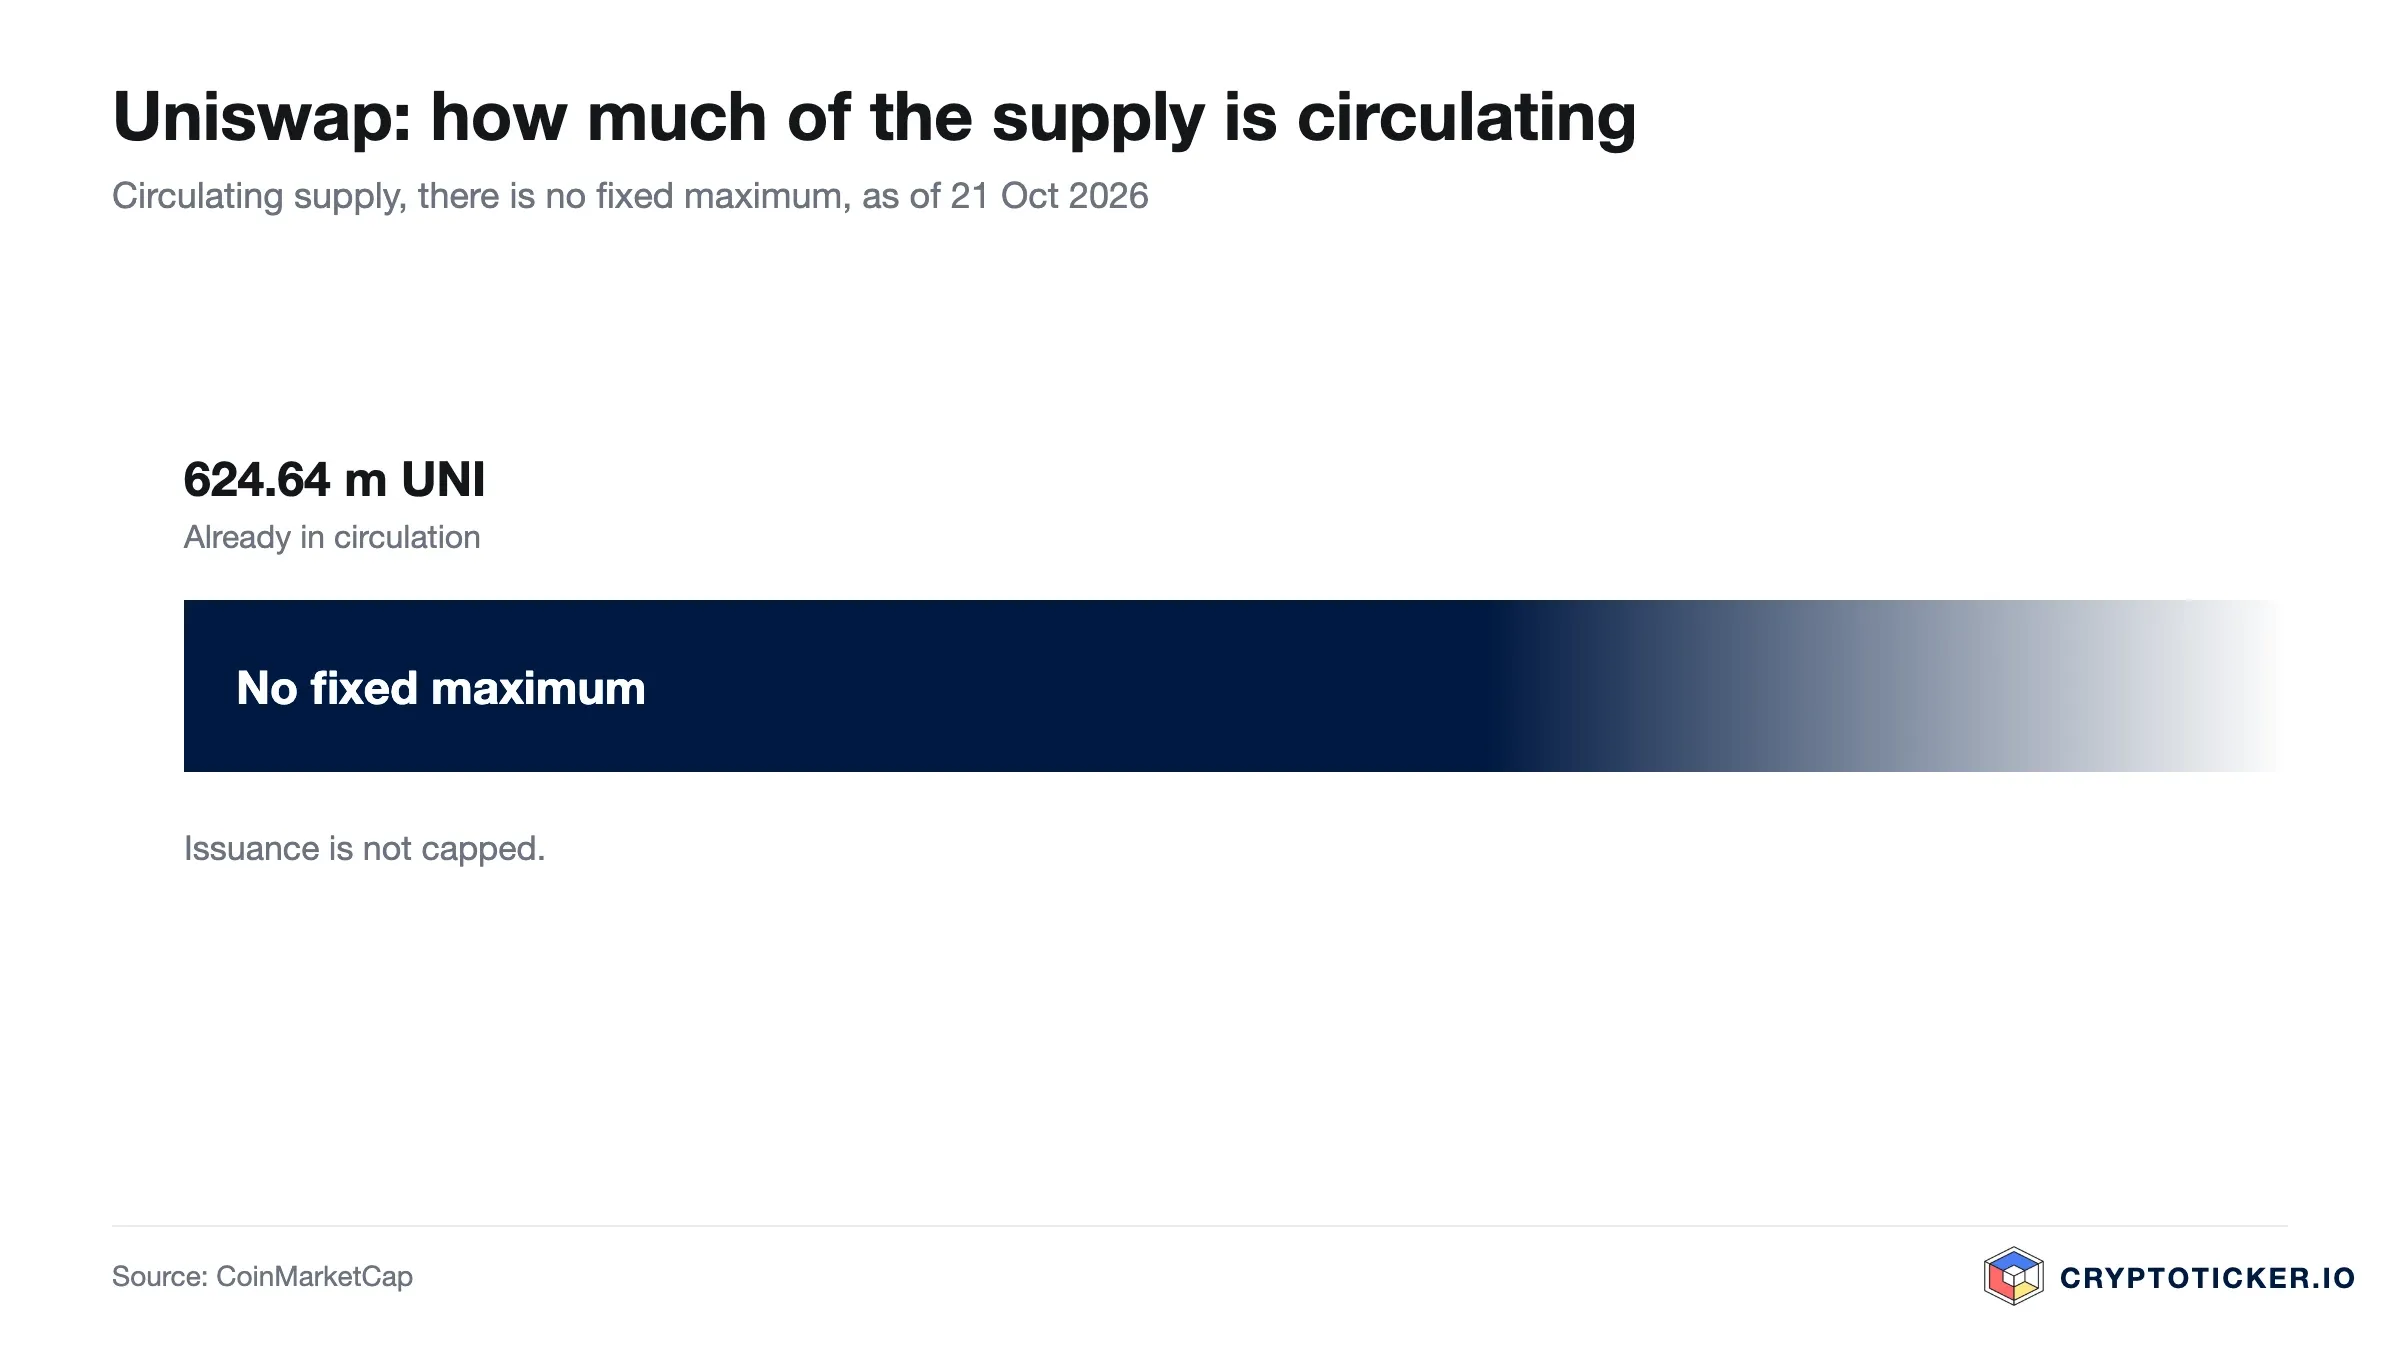
The burn also explains the fall in total supply. Most of it comes from a retroactive burn of 100 million UNI from the treasury under the same proposal; by 7 October the burn address held 112.64 million UNI. Since 25 August the total supply reported by CoinMarketCap has fallen from 890.52 million to 886.89 million UNI, while circulating supply edged up from 623.27 million to 624.64 million. No maximum supply is disclosed in the market data, and supply mechanics remain a matter for governance.
The regulatory frame is developing rather than fixed. In the European Union the markets in crypto-assets regulation governs how venues and issuers operate, and the supervisory position is set out by ESMA on its MiCA pages. In the United States, the SEC exemption of 17 September for tokenised equities in liquidity pools and the CME futures since 19 October have widened the group of investors able to take a view on UNI. Neither step amounts to an approval or a seal of quality for the token itself.
What speaks for buying Uniswap at current prices
Three arguments carry weight at 7.62 dollars. The trend evidence is the strongest. The 50-day average crossed the 200-day in early September and now sits 33.7 percent above it, at 7.32 against 5.48 dollars. The price has not closed below the 200-day line since 21 August, not even in the sell-off of 8 October, whose intraday low was 7.02 dollars.
The second argument is that the token is now connected to the activity it governs. Since the fee switch, protocol fees only leave the TokenJar against burned UNI. Together with the treasury burn, 112.64 million UNI sit at the burn address, 11.26 percent of the original supply of one billion. That is a mechanism rather than a promise, and it did not exist in this form when the token was a pure voting right.
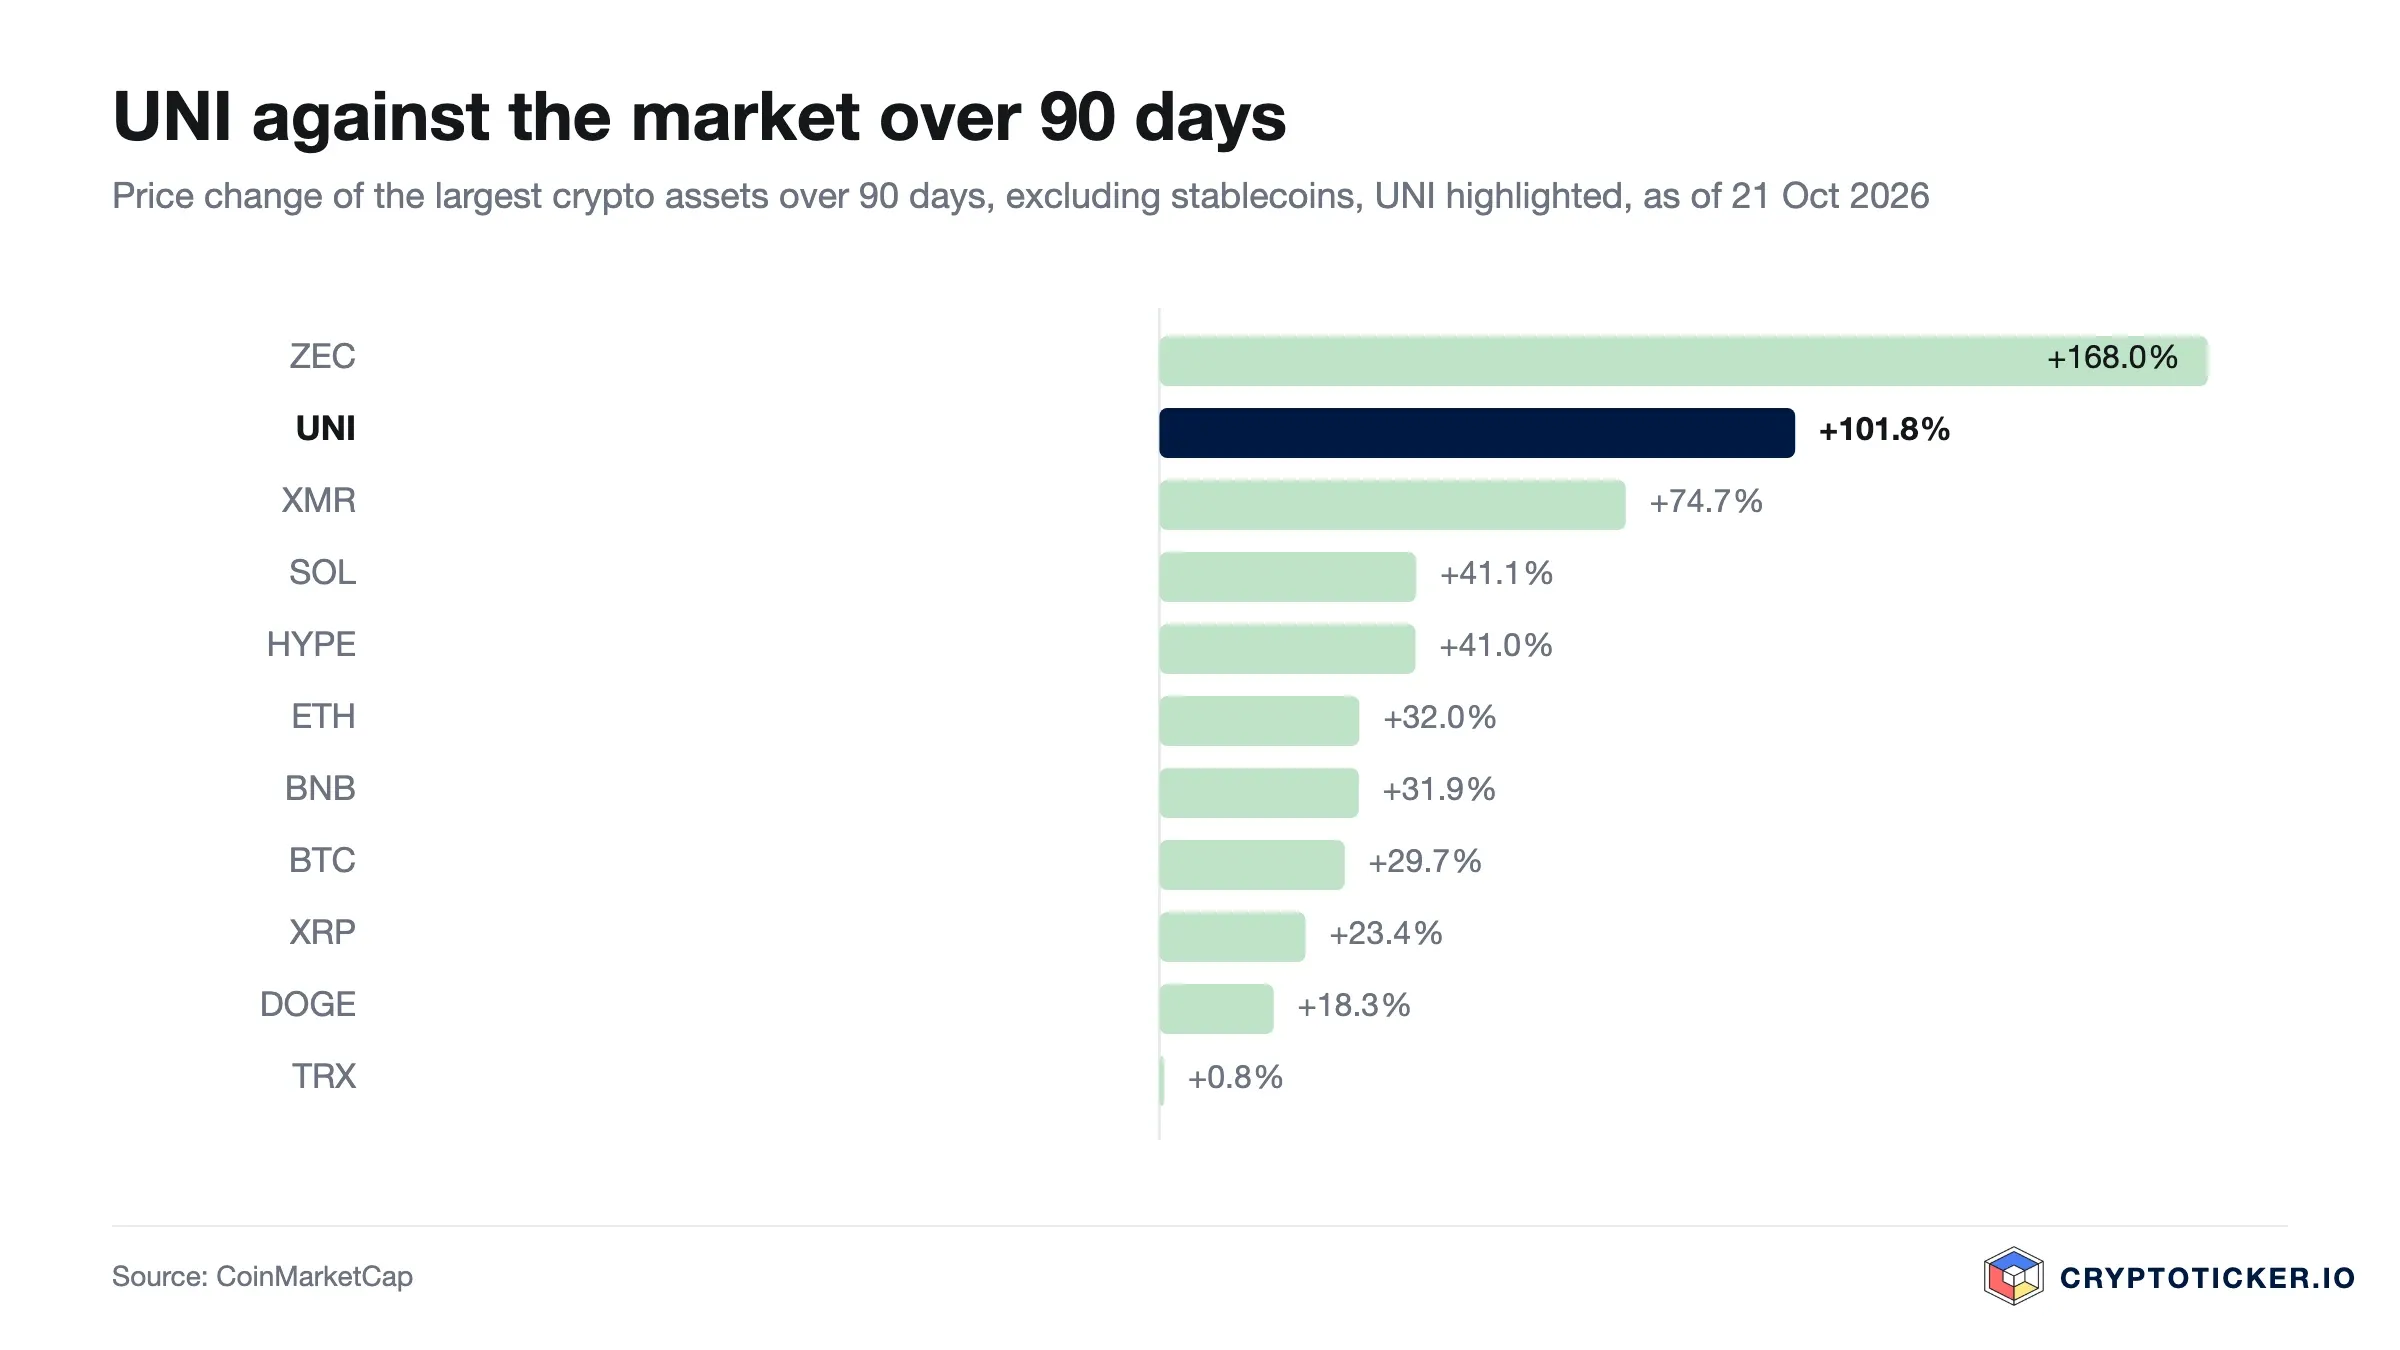
The third is relative strength. Over 90 days UNI ranks second among the large non-stablecoin crypto assets with a gain of 101.8 percent, behind Zcash at 168.0 percent and far ahead of Bitcoin at 29.7 percent. Since 19 October, CME futures also give funds and asset managers a regulated instrument for a token many of them could not touch before.
What speaks against buying Uniswap at current prices
Three arguments cut the other way. The first is the retreat from the peak. UNI is 25.7 percent below its highest close of 22 September and 30.0 percent below the intraday high of 10.88 dollars, and it is down 13.4 percent over 30 days. October showed how quickly such losses build: minus 22.0 percent from 5 to 8 October, minus 10.2 percent on 12 October, and a range of 14.2 percent between high and low on 8 October alone.
The second is scale. 38,000 UNI burned in a day equals 0.0061 percent of circulating supply, and on the day we measured it, 7 October, UNI still closed 7.5 percent lower. A burn is not a distribution, its size depends on fee income that rises and falls with market activity, and circulating supply has in fact risen slightly since August.
The third is the macro backdrop. The Federal Reserve raised rates to 3.75 to 4.00 percent on 16 September, the minutes published on 7 October point to a further increase, and consumer prices rose 3.7 percent in September. Bitcoin stood at 84,760 dollars on 21 October with a market share of 59 to 60 percent. In that kind of market, investors take profits first in the tokens that gained most over the summer, as UNI's October showed. The Fed meeting on 27 and 28 October is the next date on which rate expectations can move the price.
How to buy Uniswap at the current price
UNI is listed on effectively every large regulated exchange serving European investors, so the practical questions are cost, custody and the standing of the venue. On cost, the spread matters as much as the headline fee: zero commission with a wider spread can be dearer than a few tenths of a percent charged explicitly. With daily ranges of up to 14 percent, as on 8 October, a market order fills at the next available price, which can differ noticeably from the one displayed; a limit order caps what you pay. The terms sit side by side in our crypto exchange comparison, and those weighting supervision will find that criterion isolated in the comparison of regulated exchanges. The venues we have examined most closely are covered individually: our Kraken review, the Bitpanda review and the Bitvavo review.
On custody, the decision follows the holding period. For a position to be traded within weeks, exchange custody is a reasonable trade-off; for a multi-year holding it is a counterparty risk taken for no return, and hardware storage is the usual answer. The devices are compared in our hardware wallet comparison. Holders of UNI on Unichain need to take no action for the mainnet switch on 29 October, according to Uniswap. One point remains specific to UNI: holding the token gives you governance rights and exposure to the burn mechanism, not a payout from trading activity, and investors interested in decentralised trading itself may find our perpetual DEX comparison closer to what they want.
Is Uniswap a good buy at current prices, short term and long term?
On a short horizon our August assessment has to be judged against its own test. We argued for patience and said a test of the 200-day line at 3.98 dollars would offer the same exposure about 9 percent cheaper, adding that the assessment was wrong if the market ran on without such a test. That is what happened: the lowest intraday price after 25 August was 4.17 dollars, and UNI more than doubled into late September. Today the setup is different. An RSI of 49.2 and a price 4.0 percent above a flat 50-day line describe a market without a timing edge in either direction. An entry at 7.62 dollars has 10.7 percent to the October low of 6.80 dollars below it and 19.3 percent to the highest October close of 9.09 dollars above it, with the Fed meeting on 27 and 28 October as the next test.
On a multi-year horizon the governance question we flagged in August has been resolved in the token's favour: fees now leave the protocol only against burned UNI. The open question is size, namely how many tokens the fee flow removes against 624.64 million in circulation. If trading on Uniswap grows, for example through tokenised equities in liquidity pools, the burn grows with it; if volume fades, the effect shrinks at once. The conditions under which that view fails remain the ones we named: decentralised exchange volume migrating away from the protocol, on which our 30.4 percent count of 18 September gives a reference point.
Three price levels make the assessment testable. A close below 6.80 dollars, the low of 13 October, would mean the band has broken to the downside and the correction since September continues. Several consecutive closes below the 200-day average, now 5.48 dollars, would undo the trend break our August test confirmed. In the other direction, a daily close above 9.09 dollars on sustained volume would be the highest since early October and a sign that the correction from 22 September is over. Neither answer is a recommendation.
Buying Uniswap: what to take away
- The August test was passed. The 50-day average crossed the 200-day on 2 September, UNI has not closed below the 200-day line since 21 August, and it peaked at 10.25 dollars on 22 September. The level to watch now is the October low of 6.80 dollars; the venues are set out in our crypto exchange comparison.
- The token now carries a burn mechanism, but its size is modest. 38,000 UNI burned on 7 October equals 0.0061 percent of circulating supply, and turnover has cooled to a seven-day average of 456.2 million dollars. Investors weighting supervision as heavily as cost will find that criterion in our comparison of regulated exchanges.
- Custody remains a separate decision. A multi-year position needs a storage arrangement to match; see our hardware wallet comparison.
Disclosure: Some of the providers mentioned in this article work with us through partner programmes. This has no influence on the price analysis or on the assessment of the chart situation; the price data comes from a public market data source and can be verified there.
(As of 22 October 2026, first version of 25 August 2026. This article is not investment advice. Prices, fees and terms change; check them with the provider before every purchase. Crypto assets are subject to high price volatility and a total loss is possible.)
Transparency note: This article was produced with the assistance of artificial intelligence and reviewed by our editorial team before publication. All figures and claims were checked against the primary sources linked in the text. The feature image was generated with AI.
Related articles
Which topics should we dive deeper into?
Select what genuinely interests you. Your picks feed directly into our editorial planning.
Crypto news that's actually worth your time.
Weekly. 60 seconds. Carefully curated by our editors: no hype, no promo flood, no spam.

September 20, 2026 9:21 AM

Is Ethena a Good Buy at Current Prices?
Ethena has rebounded hard off its twelve-month low and still trades far below its high. Is ENA a good buy at current prices? We check the chart, the supply schedule and the source of the yield with our own price data.
August 27, 2026 11:25 AM
Is Pump.fun a Good Buy at Current Prices?
PUMP now sits only just above its 50-day average and still trades below its twelve-month high. We check with our own price data what argues for and against buying Pump.fun at the current price.
August 27, 2026 6:38 AM
Is NEAR Protocol a Good Buy at Current Prices?
NEAR has nearly tripled since August, and the trend break we defined back then has happened. What ETF buying, leverage and issuance mean now: is NEAR Protocol a good buy at current prices?
August 27, 2026 4:31 AM

Is AAVE a Good Buy at Current Prices?
AAVE has worked its way back above both the 200-day and the 50-day moving average, yet still trades far below its twelve-month high. Using our own price data, we examine what speaks for and against an entry at current prices.
August 27, 2026 3:24 AM
Is Hedera a Good Buy at Current Prices?
Hedera met our trend-reversal test in September, then gave back the entire IBM jump. What higher lows, HashPack's stock tokens and Hitachi's exit from the council mean now: is Hedera a good buy at current prices?
August 27, 2026 2:21 AM
Is SUI a Good Buy at Current Prices?
SUI is holding its 200-day moving average and trades 51 percent above its twelve-month low, with the 50-day line now above the 200-day. We check whether the coin is a good buy at current prices.
August 16, 2026 12:21 PM

Is Toncoin a Good Buy at Current Prices?
Toncoin, now traded as Gram (GRAM), has fallen back below both moving averages and the September breakout has failed. What the Telegram wallet, volume and the base mean now: is Toncoin a good buy at current prices?

May 18, 2026 1:07 PM

Is Solana a Good Buy in 2026? SOL Price Analysis and Potential ROI
Solana (SOL) trades at $101.73 after clearing the $100 resistance. Here's how SOL's potential returns stack up against BTC, ETH, and XRP.
May 13, 2026 11:02 AM

Is PEPE Coin worth Buying in 2026?
PEPE still holds both its 50 day and its 200 day average, while trading volume has slipped back below its yearly norm. What that means for anyone buying at current prices, and the two levels that settle it.
September 28, 2026 9:47 AM
XRP Price Drops Below $1.50: Where Is Ripple Heading This Week?
XRP price slips under $1.50 after a red weekend. Here is the XRP price analysis with the higher and lower targets that matter this week.
August 23, 2026 1:16 AM

Is PEPE a Good Buy at the Current Price?
PEPE has given up the 50-day moving average but still holds clearly above the 200-day line. Is the memecoin a good buy at the current price, or is the rally already running on thin volume?
November 27, 2024 7:01 PM

Uniswap Bug Bounty: The 'Largest Bug Bounty in History' ahead of v4 Core Contracts Release
Uniswap Labs has launched the largest bug bounty in crypto history, a groundbreaking $15.5 million bug bounty program to secure its upcoming v4 core contracts. Full details here...
August 31, 2026 11:20 PM
Is Mantle a Good Buy at Current Prices?
Mantle has rebounded hard from its summer low but still trades below its 200-day line, and nearly half the eventual supply has yet to reach the market. We weigh what speaks for and against buying MNT at the current price.
August 24, 2026 12:50 AM
Is Bitcoin Cash a Good Buy at Current Prices?
Bitcoin Cash has held its summer gains but the rally has stalled: the price now sits right on its 50-day line with the RSI back to neutral and turnover halved. We work through what speaks for and against buying BCH at current prices.
August 24, 2026 12:34 AM
Is Monero a Good Buy at Current Prices?
Monero broke above the level we named in September as the test for a trend change. What the breakout, an overbought RSI and EU rules mean now: is Monero a good buy at current prices?
August 24, 2026 12:19 AM
Is Zcash a Good Buy at Current Prices?
Zcash has given back part of its September advance and now sits just above its 50-day average. We look at what the trend, the RSI and the turnover actually support, and under which conditions the case for buying ZEC breaks down.
August 23, 2026 2:21 PM
Is Hyperliquid a Good Buy at Current Prices?
HYPE slipped below its 50-day average in October, triggering the test we set in September. What buybacks, team sales and leverage mean now: is Hyperliquid a good buy at current prices?
August 3, 2026 10:41 AM
Is XRP Coin a Good Buy At Current Prices?
XRP trades at $1.33 and has lost both moving averages, with the 50-day EMA dropping back below the 200-day on 18 October. Why the $1.20 shelf now decides where the recovery finds its floor.
August 11, 2026 5:35 PM

Is Ethereum a Good Buy at Current Prices?
Ethereum has fallen further than Bitcoin and has now given back the lead it built in the rebound. What chart structure, the fee mechanism and trading volume say about buying at current prices.
August 11, 2026 5:35 PM

Is Bitcoin a Good Buy at Current Prices?
Bitcoin trades about 29 percent below its twelve-month high and has slipped below its 50-day moving average. What chart structure, RSI and trading volume say about buying at current prices.
June 18, 2026 10:57 PM
Is Solana (SOL) a Good Buy at Current Prices?
Solana has traded above its 200-day average since August and the 50-day average joined it on 21 September, but volume is no longer keeping pace. What chart structure, issuance and tokenisation say about buying at current prices.

February 24, 2024 5:42 AM

Breaking News: Uniswap Price Soars with Proposed Staking Rewards. What’s Next?
Uniswap (UNI) just got a major boost in its price! Let's take a look at this Uniswap price article in more detail.
September 27, 2022 5:37 PM

Uniswap Price Prediction – Glorious +20% Week! Better Days Ahead?
UNI token grew 20% since last week. Why is Uniswap up? Is Uniswap a good buy? Let's analyze UNI in this Uniswap price prediction article.
September 4, 2024 5:21 PM

Uniswap (UNI) Price Prediction: Here’s Why UNI Price is Rising?
Uniswap's native token, UNI, has seen a significant boost, jumping 5.72% in just the last 24 hours.

April 6, 2026 6:24 PM
Ethereum Price Analysis: ETH Consolidates Between $1,800 and $2,100, What’s Next?
Ethereum price is stuck in a tight range between $1,800 and $2,100. Analysts warn of a decisive breakout or breakdown as volatility reaches a boiling point.

More from CryptoTicker