
Will Bitcoin Go Back Up? Three Scenarios to Year-End: $70,000, $80,000 or $100,000
Bitcoin (BTC) is 40% below its record, ETFs are bleeding cash and the Fed may hike. What happened since early November, which levels decide between $70,000, $80,000 and $100,000, and what price history says about the 53 days to New Year's Eve.


Which topics should we dive deeper into?
Select what genuinely interests you. Your picks feed directly into our editorial planning.
Crypto news that's actually worth your time.
Weekly. 60 seconds. Carefully curated by our editors: no hype, no promo flood, no spam.
Will bitcoin go back up? Bitcoin trades at about $75,700 on Saturday evening, November 7, 2026 (CoinGecko, 5:30 p.m. ET). That is 2.2% below October's close and 40% below the record of $126,080 set in October 2025. Whether the price recovers by year-end comes down to three levels and a short list of dates: if bitcoin holds the $75,700 cost basis of recent buyers, the road back to $80,000 to $90,000 is open. If it closes below the 200-day moving average at $73,191, $70,000 comes into play. A return to $100,000 by December 31 would take a 32% gain in 53 days, something bitcoin managed in roughly one in five such periods since 2020.
This is the weekend check-in for anyone asking what happened since November 1, which scenarios are realistic into year-end and what you can actually do now. The individual reasons behind the sell-off are tracked in our running explainer Why is crypto down today?
- Price: $75,700, down 2.2% since the end of October and 13.5% year to date.
- November range: high of $81,105 on November 4, low of $74,762 on November 6 (Bitstamp).
- Spot bitcoin ETFs: $1.28 billion in net outflows in the week to November 6, the biggest weekly total since late June.
- Rates: 76.8% odds of a Fed rate hike on December 9 (CME FedWatch, November 6).
- Sentiment: the Fear and Greed Index stands at 25, extreme fear.
- Next test: October CPI on Tuesday, November 10, at 8:30 a.m. ET.
Bitcoin price since November 1: above $81,000, then below $75,000
November opened quietly. Bitcoin closed October at $77,430 and November 1 at $78,233, then investors pulled just over half a billion dollars from the US spot ETFs in two days. The jump came after the midterm elections on November 3: on Wednesday morning, shortly after Wall Street opened, bitcoin climbed to $81,105. The rally lasted one day.
On Thursday, November 5, the mood flipped. Wallets tied to Trump Media sent 4,259 bitcoin to Crypto.com, weeks before holders of its convertible notes can demand up to $1 billion in cash on November 30. A sale has not been confirmed; the details are in our report on Trump Media's 4,259 BTC. The same day, President Trump said a big agreement on Ukraine and all of Europe is coming after meeting Russian envoy Kirill Dmitriev; he gave no details, Al Jazeera reports. The Nasdaq Composite lost 5.5%, and bitcoin slid from $80,300 to $75,500 between 7 and 11 a.m. ET. How markets read the Russia headline is covered in Trump, Russia and bitcoin.
Friday brought the jobs report. The US economy added 165,000 jobs in October, unemployment stood at 4.1%, and the two prior months were revised up by a combined 84,000 (Bureau of Labor Statistics). A labor market that strong takes away the Fed's reason to cut. Bitcoin dropped to $74,762, its low for the month.
| Day | What happened | Bitcoin daily close |
|---|---|---|
| Sun, Nov 1 | Month opens | $78,233 |
| Mon, Nov 2 | about $399 million out of spot bitcoin ETFs | $76,674 |
| Tue, Nov 3 | US midterm elections | $77,345 |
| Wed, Nov 4 | High of $81,105 after the US open | $80,434 |
| Thu, Nov 5 | Trump Media moves 4,259 BTC, Nasdaq down 5.5% | $75,971 |
| Fri, Nov 6 | 165,000 new jobs, low of $74,762 | $75,747 |
| Sat, Nov 7 | Fear and Greed Index at 25 | about $75,700 (5:30 p.m. ET) |
Daily closes from Bitstamp (UTC). Nasdaq Composite per Nasdaq: 25,736.51 on November 4, 24,315.00 on November 5.
Why did bitcoin fall? ETF outflows, rate-hike fears and the Binance hack
Three forces are pushing on the price at once, and none of them has run its course. Together they explain the selling pressure of the past week.
First, money is leaving the spot bitcoin ETFs. From Monday to Friday, a net $1.28 billion flowed out, with only Wednesday bringing in $74.6 million. On Friday alone, BlackRock's IBIT, the largest fund, lost $403 million (Crypto Briefing, citing SoSoValue data). That puts 2026 net flows for the US spot ETFs at minus $914 million, according to SoSoValue data compiled by The Block (analysis at MLQ). The ETFs were the engine of institutional adoption and the market's biggest buyer in 2024 and 2025. While they sell, the demand that carries a rally is missing.
Second, the market is pricing in higher rates. The Fed held its target range at 3.75% to 4.00% on October 28, and two of twelve voters already wanted a hike (Federal Reserve). After the jobs report, CME FedWatch put the odds of a hike on December 9 at 76.8%, up from 66.9% a week earlier (24/7 Wall St.). Higher interest rates make Treasury bills more attractive and pull money out of bitcoin, tech equities and other risk assets. Bitcoin has tended to do best when rates fall and global liquidity grows; for December, markets have priced out rate cuts and price in a hike instead.
Third, the Binance hack still weighs. Attackers stole crypto worth about $6.3 billion from the largest exchange on October 29, part of which has been frozen (CNBC). Customers withdrew billions afterward, and trust across the crypto market took a hit. What the hack has cost Binance so far is in our Binance hack one week later review.
Market sentiment shows it. The Fear and Greed Index, a gauge of investor sentiment, fell from 50 on November 5 to 25 on Saturday (alternative.me). What happened after past bouts of extreme fear is laid out in our piece on the Fear and Greed Index at extreme fear.
 Crypto exchanges compared
Will bitcoin go back up? The moving averages and cost bases that decide it
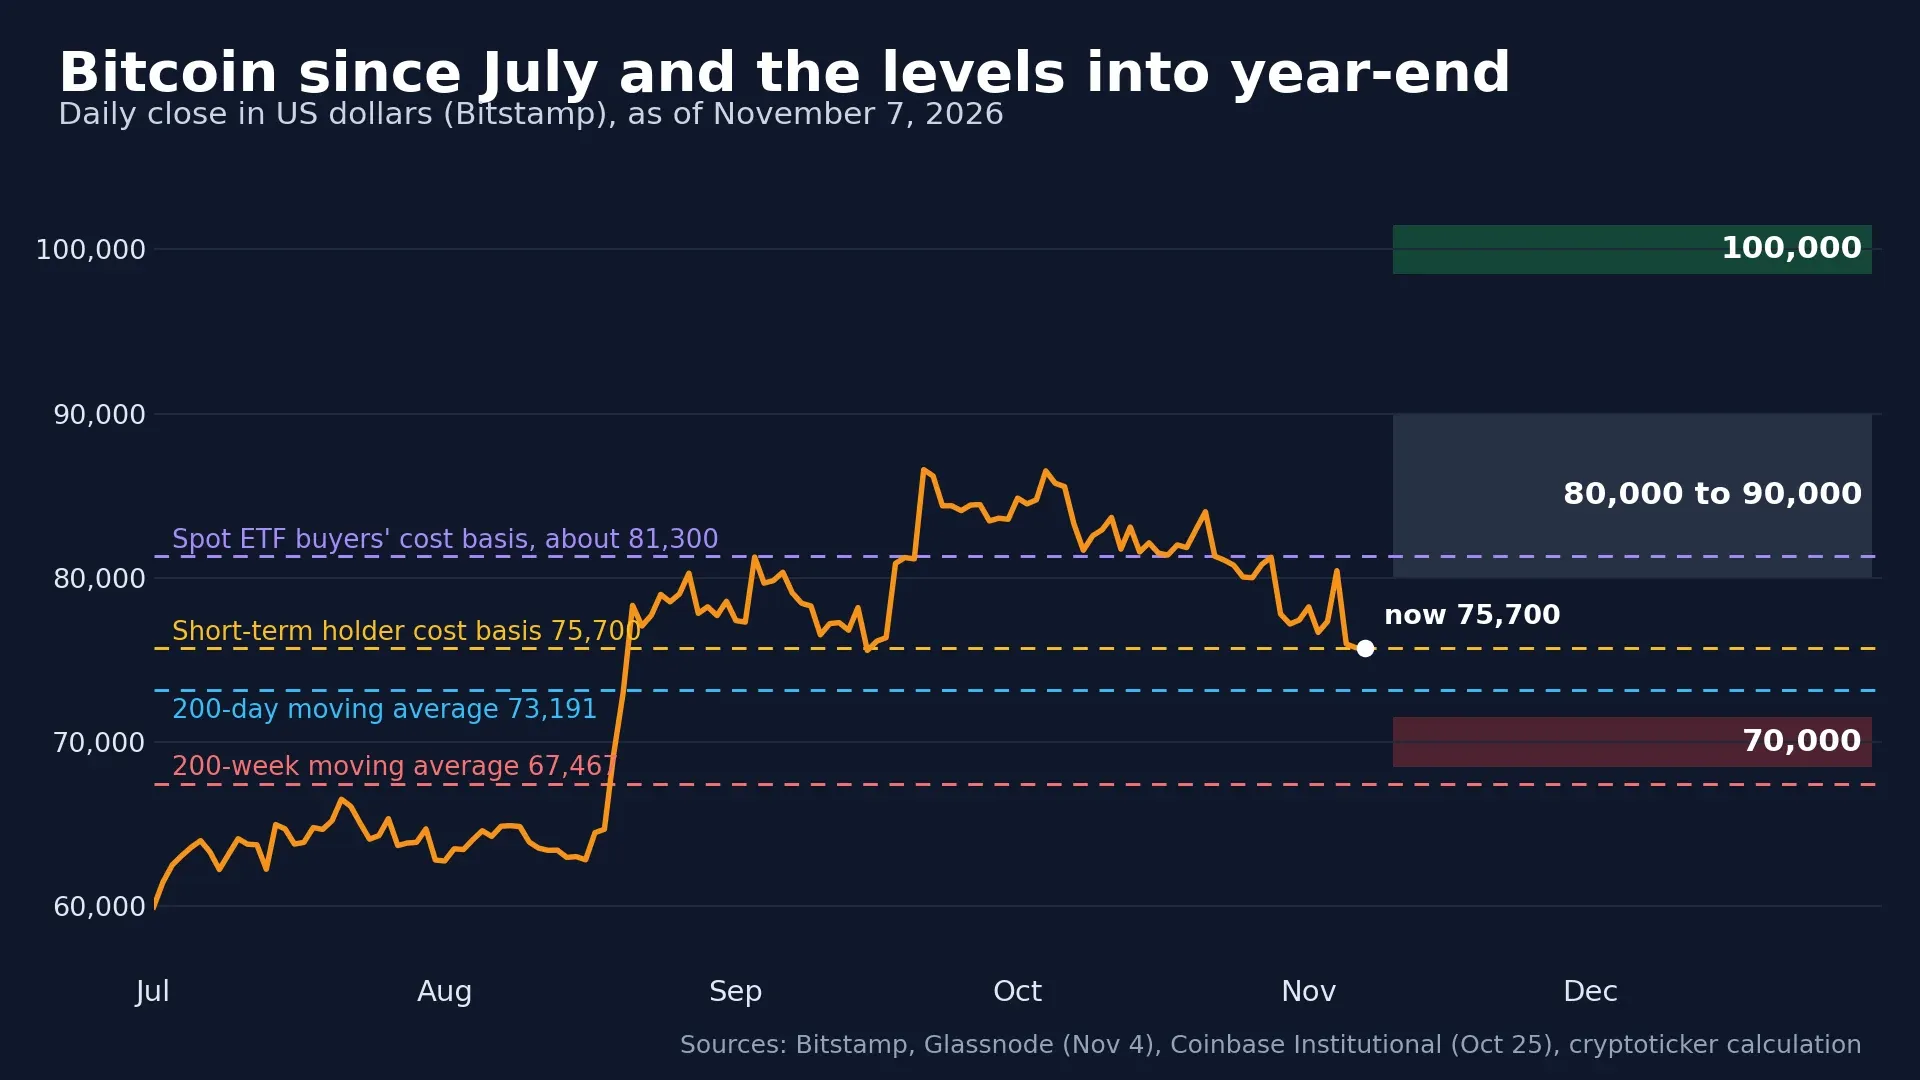
Whether bitcoin goes back up can be read from what investors paid. Two tools help: on-chain data, which shows the average entry price of different groups of holders, and classic technical analysis with moving averages. Holders sitting on a profit tend to hold; holders sitting on a loss often sell the first time the price returns to their entry. Right now five levels stand out, three below the price and two above.
- $75,700, short-term holder cost basis: the average price paid by investors who have held their coins for less than 155 days (Glassnode, November 4). Bitcoin sits right on it. A sustained move below puts these buyers underwater, and in fearful markets they tend to sell.
- $73,191, 200-day moving average: the average of the last 200 daily closes and, for many funds, the line between an uptrend and a downtrend. Bitcoin is 3.4% above it.
- $67,467, 200-week moving average: the level where past bear markets often found their floor. Bitcoin is 12.2% above it.
- $77,700, active investors' mean: Glassnode calls it the True Market Mean. Above it, the market is considered healthy.
- About $81,300, spot ETF buyers' cost basis: Coinbase Institutional's late-October estimate of the average entry price of US spot ETF investors (Investinglive). ETF holders are down about 7% on average.
Far below sits the realized price, the average price of all bitcoin at the time each coin last moved, at $53,995 (BGeometrics, October 31). It plays no role in the year-end scenarios, but it shows how much profit is still in the market as a whole. Long-term targets through 2030 and the method behind them are in our Bitcoin price prediction.
Scenario 1: bitcoin falls to $70,000 and the crypto winter deepens
The bearish path starts with a daily close below the 200-day moving average at $73,191. Recent buyers would then be at a loss, and the next round number is $70,000, 7.5% below today's price. Beneath that, the 200-week moving average at $67,467 is the last major support before the summer lows, when bitcoin closed at $58,526 at the end of June.
The likely triggers:
- October CPI on November 10 comes in hot and turns a December hike into a near certainty.
- ETF outflows continue; a second week with more than $1 billion leaving would be a warning sign.
- On November 11, index provider MSCI publishes the list of companies caught by its new rule for firms without sufficient operating business, and Strategy is on it. Index funds would have to sell shares, and the company would have less room for new bitcoin purchases.
- Trump Media sells part of its roughly 14,139 bitcoin before November 30 to pay the notes.
The options market shows where traders are hedging: for the November 27 expiry, the largest put positions sit at $58,000 (4,065 BTC) and $75,000 (3,174 BTC); for the year-end expiry, at $60,000 (6,667 BTC), according to Deribit data from Saturday evening. How long bear markets in bitcoin and stocks have lasted is covered in our guide to the bear market.
Scenario 2: bitcoin recovers to $80,000 to $90,000
Getting back to $80,000 takes a 5.7% gain, $90,000 takes 18.9%. Step one would be reclaiming $77,700, step two a daily close above roughly $81,300. From there, ETF investors would be back in profit on average, and the urge to sell at break-even would fade.
The options market leans this way. For the November 27 expiry, with 71,921 BTC in open interest worth about $5.4 billion, max pain sits at $80,000. That is the price at which option buyers collect the least in total and option sellers earn the most. The biggest call strike is $90,000 (4,533 BTC). A soft CPI print on November 10, less hawkish Fed minutes on November 18 and an end to ETF outflows would support this scenario. The ceiling is the high of recent months: bitcoin closed at $86,587 on September 21.
Scenario 3: bitcoin at $100,000 by New Year's Eve, still below its all-time high
$100,000 is 32.1% above today's price and would still leave bitcoin about 21% below its all-time high of $126,080. That is not impossible in 53 days, but several things would have to break bitcoin's way at once:
- The Fed backs off: the odds of a hike would need to drop well below 50% from 76.8%, for example after soft inflation readings on November 10 and November 25.
- The ETFs buy again: a move of this size would need several billion dollars of inflows over weeks, not a few good days.
- Relief for corporate buyers: MSCI keeps Strategy in its indexes, and Trump Media pays its notes without selling bitcoin.
- Geopolitics: a signed agreement on Ukraine would lift risk assets broadly.
For the December 25 expiry, 6,737 BTC of calls sit at $100,000 and 5,821 BTC at $120,000. Traders see the scenario as possible, yet max pain for that expiry is $75,000, right where bitcoin trades today.
| Scenario | Target by Dec 31 | Distance | Triggers | How you'll know |
|---|---|---|---|---|
| Downside | $70,000 | -7.5% | Hot CPI, MSCI list hits Strategy, ETF outflows | Daily close below $73,191 |
| Recovery | $80,000 to $90,000 | +5.7% to +18.9% | Soft inflation, ETF outflows stop | Daily close above $81,300 |
| Rally | $100,000 | +32.1% | Fed skips the hike, billions in ETF inflows | Price above $90,000 before December 9 |
How often bitcoin moved this far in 53 days: past performance since 2020
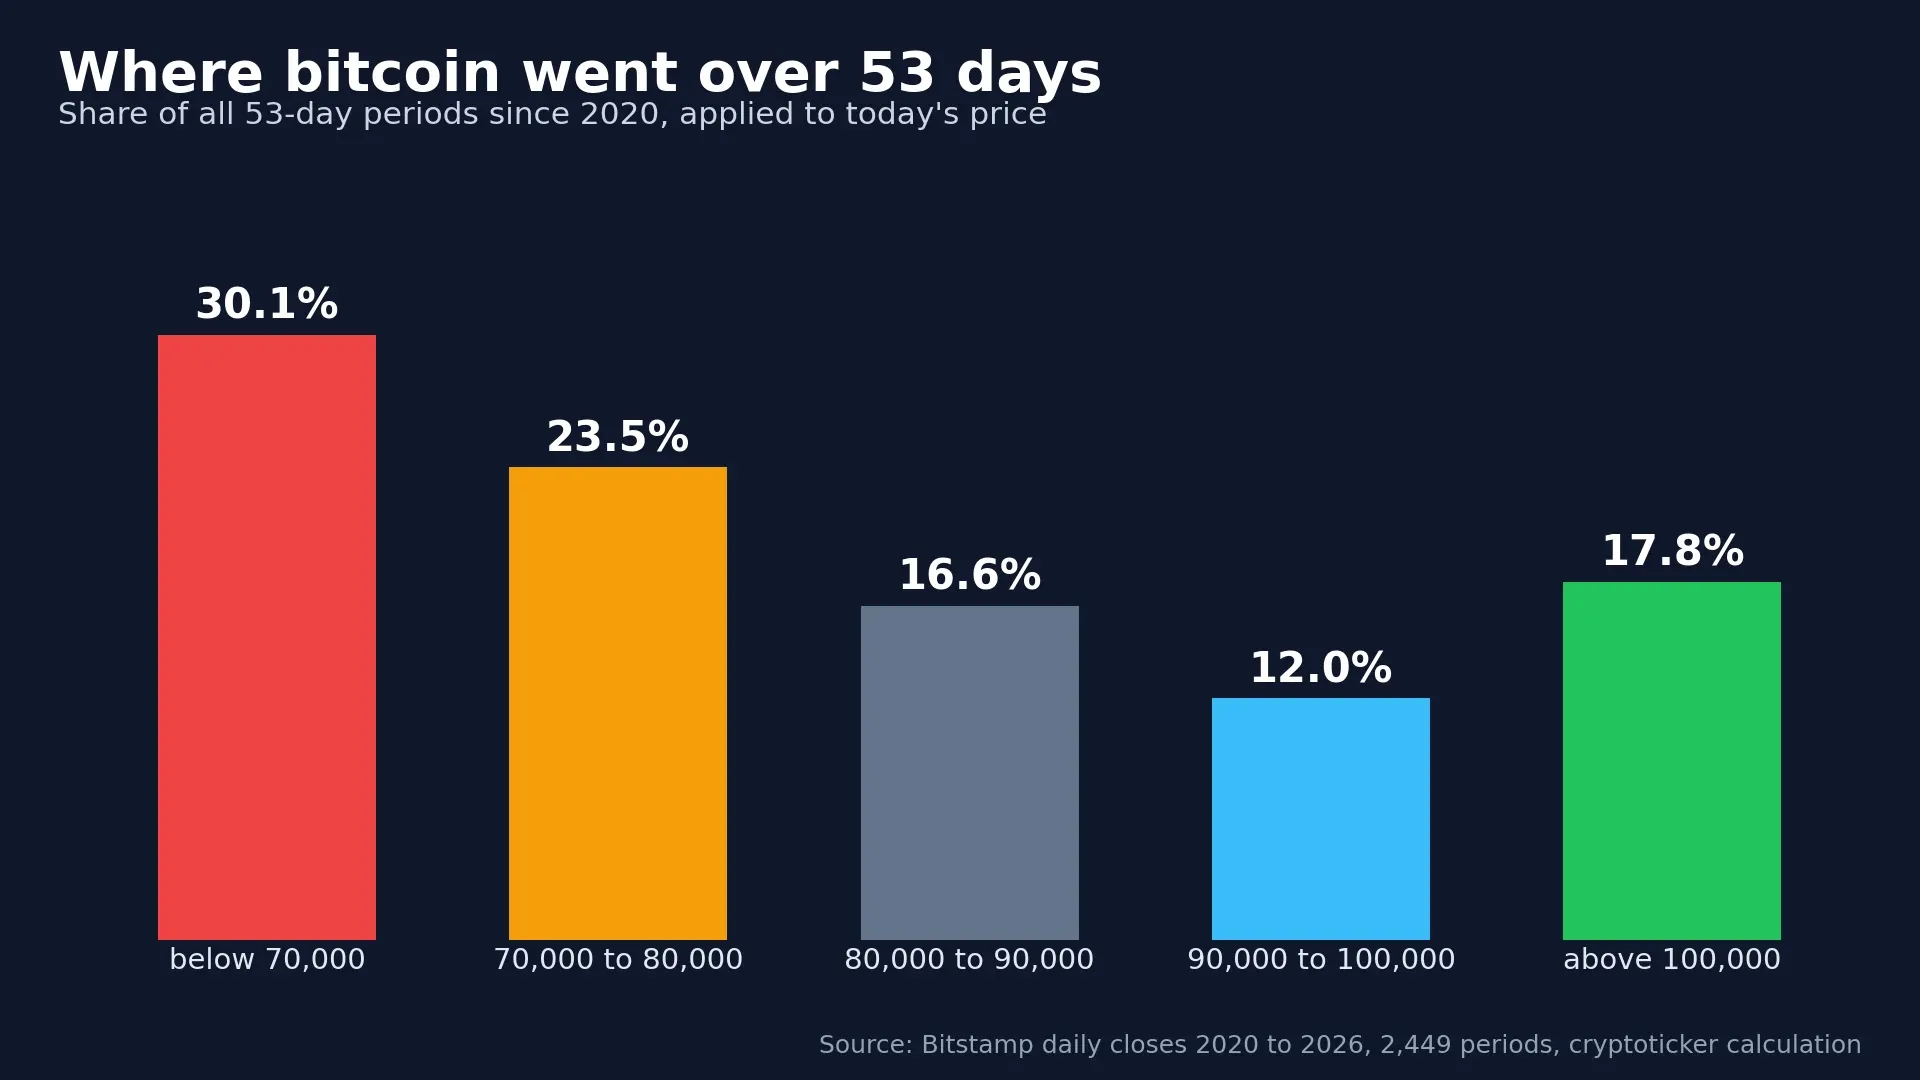
From Sunday, there are 53 days left until New Year's Eve. We looked at every window of that length since 2020, 2,449 in total, and measured how far bitcoin moved from the first daily close to the last. We then applied those percentage moves to today's price of $75,700.
| Price on Dec 31 would be | Required move | Share since 2020 | Share since 2015 | Share in bear phases |
|---|---|---|---|---|
| below $70,000 | -7.5% or worse | 30.1% | 28.5% | 29.3% |
| $70,000 to $80,000 | -7.5% to +5.7% | 23.5% | 21.6% | 21.3% |
| $80,000 to $90,000 | +5.7% to +18.9% | 16.6% | 17.1% | 19.0% |
| $90,000 to $100,000 | +18.9% to +32.1% | 12.0% | 11.6% | 12.0% |
| above $100,000 | +32.1% or more | 17.8% | 21.1% | 18.4% |
Based on Bitstamp daily closes: 2,449 windows since 2020 and 4,275 since 2015. A bear phase counts every start day on which bitcoin was at least 30% below its prior high (2,749 windows). The windows overlap, so the shares are historical frequencies, not probabilities for this year.
The main takeaway is how wide bitcoin's range is. Only in about a quarter of cases did the price stay within -7.5% and +5.7%. In 46% of windows it rose more than 5.7%, in 30% it fell more than 7.5%. Bear phases, including the crypto winters of 2018 and 2022, look much like the average: the distance from the record alone says little about where the next few weeks will go. Past performance shows bitcoin's volatility; it does not predict this year's outcome.
 Crypto brokers compared
Short-term catalysts: key dates that can move the bitcoin price
The next eight weeks are packed. Each scenario above has a date on which it gets confirmed or ruled out.
| Date (ET) | Event | Why it matters for bitcoin |
|---|---|---|
| Tue, Nov 10, 8:30 a.m. | October consumer price index (CPI) | Hot inflation would cement a December hike |
| Wed, Nov 11 | MSCI publishes its November index review, including the list of companies caught by its new rule for firms without a core operating business | If Strategy is on it, index funds may have to sell the stock |
| Wed, Nov 18, 2 p.m. | Minutes of the October 28 Fed meeting (expected) | Shows how many officials want a hike |
| Wed, Nov 25, 8:30 a.m. | October PCE price index and Q3 GDP, the day before Thanksgiving | The Fed's preferred inflation gauge |
| Fri, Nov 27, 3 a.m. | Deribit monthly options expiry, about $5.4 billion, max pain $80,000 | Traders watch whether price drifts toward max pain into expiry |
| Mon, Nov 30 | Trump Media noteholders can demand up to $1 billion in cash | Possible bitcoin sales from the company's treasury |
| Fri, Dec 4, 8:30 a.m. | November jobs report | Last major data point before the Fed meeting |
| Wed, Dec 9, 2 p.m. | Fed rate decision with new projections | FedWatch shows 76.8% odds of a hike to 4.00% to 4.25% |
| Fri, Dec 25, 3 a.m. | Deribit year-end expiry, about $10.6 billion, max pain $75,000 | The largest expiry of the year |
Sources for the dates: the Bureau of Economic Analysis release schedule, the FOMC calendar and MSCI's index review dates. Under Fed practice, the minutes come out three weeks after the meeting.
Should I buy bitcoin now? What you can do this week
Nobody reliably buys the exact bottom, and in today's crypto market the swings are large. If you plan to buy bitcoin for the long run anyway, a fixed schedule usually works better than waiting for the low. Whether now is a good time to buy bitcoin is a question a plan answers better than a gut feeling. Three things help.
Dollar-cost averaging beats timing
A simple example using Bitstamp daily closes: putting $100 into bitcoin on the first of every month in 2026 means $1,100 invested, now worth about $1,144, a 4.0% gain at an average price of $72,815. Buying it all on January 1 at $88,728 would leave you down 14.7%. The gap is even starker from the record: a lump sum on October 6, 2025, at the record close of $124,728 is down 39.3% today, while a monthly plan started that day is down only about 2.5%. Which platforms offer recurring bitcoin buys is shown in our comparison buy bitcoin with a savings plan.
Buy in tranches and set a loss limit
If you want to put a larger amount to work, split it into three or four parts and buy on fixed days, for example after the key dates above. That way not everything lands on a single price. Just as important is the downside: decide before you buy how large a loss you will accept, and only invest money you will not need for years. Any purchase should fit your investment objectives, risk tolerance and financial situation. In the 2018 and 2022 bear markets, bitcoin lost more than 75% from its peak. Where you can buy safely and at low cost is compared in our crypto exchange comparison.
Taxes: holding period and losses
In the US, the IRS treats bitcoin and other digital assets as property. Coins held for more than a year qualify for long-term capital gains rates of 0%, 15% or 20%, while gains on coins held a year or less are taxed as ordinary income. Selling at a loss can offset capital gains, and up to $3,000 of net losses a year can be deducted from ordinary income. This section is not tax advice; check your situation with a tax professional.
Bitcoin remains a highly volatile asset. This article is not investment advice; the scenarios show what matters into year-end, not where the price will land.
FAQ: Will bitcoin go back up?
Transparency note: This article was produced with the assistance of artificial intelligence and reviewed by our editorial team before publication. All figures and claims were checked against the primary sources linked in the text. The feature image was generated with AI.
Related articles
- Is Bitcoin Still a Good Investment in October 2026?
- Ethereum Price Below $2,300: Is $2,000 Next or Is This the Bottom?
- Crypto ETF Outflows Pass $1 Billion in October: Is Wall Street Dumping Bitcoin and Ethereum?
- Bitcoin Crash: Why BTC Fell to $75,568, How Low It Could Go and How to Hedge
- Bitcoin Price Prediction: BTC Price of $86,000 REACHED! What Next?
Which topics should we dive deeper into?
Select what genuinely interests you. Your picks feed directly into our editorial planning.
Crypto news that's actually worth your time.
Weekly. 60 seconds. Carefully curated by our editors: no hype, no promo flood, no spam.

November 3, 2026 9:29 AM

Solana Price Below $95: Record ETF Outflows and Whale Selling Push SOL to a 7-Month Low
Solana price drops under $95 after a record $71 million ETF outflow and whale dumping. SOL is 19% down in a month. Is $78 the next stop?
March 20, 2026 12:38 PM
3 Reasons Why Bitcoin Price Will Not Crash to $0
Bitcoin price will not crash to $0. Here are 3 key reasons why BTC remains supported by adoption, security, and long-term scarcity.

June 20, 2026 3:27 PM

Bitcoin ETF Outflows Hit Record Levels: Why Institutions Are Pulling Billions From BTC
Spot Bitcoin ETFs just logged their longest outflow streak ever, shedding billions as BTC sits near $63K. Here's what's driving it and what it means.
November 6, 2026 9:19 PM
Bitcoin price prediction: $430 million outflow pushes the 2026 ETF balance below zero
Analysis: US bitcoin ETFs lost $869.8 million in four trading days, and the balance for 2026 is back below zero. What the outflows reveal about the price at $75,800, which levels count until the end of November and what investors in Germany can make of it.
February 11, 2026 7:05 AM
5 Things to Look for BEFORE Buying Bitcoin
Thinking about entering the crypto market? Discover the 5 essential factors to check before you buy Bitcoin to secure your investment and strategy.
June 25, 2024 11:00 PM

How to Buy Bitcoin on Bitget: A Step-by-Step Guide
Want to buy Bitcoin and still confused about which platform to use? Look no further! Check Bitget, and this full guide, step by step...
April 8, 2025 8:30 AM

BlackRock CEO Forecast: Will a Recovery Follow the Crypto Market Crash ?
BlackRock CEO Larry Fink hints at what will happen next, following the crypto market's sharp downturn, wiping billions in value. So, is a recovery in sight, or are we bracing for more pain?
October 26, 2026 7:36 AM

Bitcoin Price Crash: Top 3 Reasons Why BTC Price Dropped Below $80,000
Bitcoin price crashed below $80,000 over the weekend. Oil, ETF outflows and a wave of liquidations explain the move, and the Fed decides this week.

November 4, 2026 8:36 PM

Bitcoin Price Jumps Above $80,000: Why the Market Rose After the Midterms
Bitcoin (BTC) jumped above $80,000 although Trump and the Republicans clearly lost the midterms. Oil, Wall Street and $378 million in short liquidations explain the move. Which levels count now and what could tip the picture.
September 28, 2026 9:47 AM
XRP Price Drops Below $1.50: Where Is Ripple Heading This Week?
XRP price slips under $1.50 after a red weekend. Here is the XRP price analysis with the higher and lower targets that matter this week.

October 9, 2026 4:16 PM

Bitcoin Price Prediction: Standard Chartered Sticks to $100,000 as ETFs Shed $729 Million in Two Days
Standard Chartered is holding to $100,000 by year-end, yet US spot ETFs lost $729 million on Wednesday and Thursday. Bitcoin stands at around $83,100. What would have to happen by December, and which levels count now.
October 29, 2026 9:49 PM

Is This the End? How Low Bitcoin Could Fall After the Binance Hack
About $2.8 billion left a Binance hot wallet and Bitcoin slid below $79,000. Whether this turns into a real crash depends on one question. Three scenarios, the key price levels for Bitcoin, Ethereum and Solana and what to do now.
April 9, 2026 2:22 PM

Is XRP Coin Worth it in 2026? Portfolio Analysis and Price Outlook
XRP trades at $1.33 as Q2 2026 begins. We analyze its portfolio value, distance from ATH, and if Ripple’s legal clarity makes it a buy.
July 27, 2024 2:34 PM

Why Is The Crypto Market Up TODAY?
With the Bitcoin 2024 Conference taking place now in Nashville, the crypto market is showing bullish signals, intriguing traders around the future of Bitcoin and Altcoins.
May 10, 2026 1:29 PM
Solana Price Eyes $100 Breakout as Bitcoin Solidifies Gains Above $80k
Solana (SOL) targets the $100 psychological level while Bitcoin (BTC) holds firmly above $80,000, signaling a major shift in the 2026 crypto market structure.
March 31, 2025 10:57 AM

Top 3 Reasons Why NOW Is a Good Time to Buy Cryptos
Crypto prices have dropped over 20% in the past month, but smart investors see this as an opportunity. Here’s why now is the perfect time to buy cryptos before the next surge!
May 18, 2026 1:07 PM

Is Solana a Good Buy in 2026? SOL Price Analysis and Potential ROI
Solana (SOL) trades at $95.50 after slipping back below the $100 resistance. Here's how SOL's potential returns stack up against BTC, ETH, and XRP.
March 29, 2026 2:07 PM

Is Ethereum a Good Store of Value?
Is Ethereum a reliable store of value? We analyze ETH price history, the "ultrasound money" narrative, and its long-term potential for 2026 and beyond.
September 23, 2024 8:44 AM

Is it a Good Idea to Buy XRP below $0.60?
With recent XRP price drops positioning it below the $0.60 mark, investors are left pondering. Is it a good idea to buy XRP below $0.60?
April 22, 2026 9:11 AM
Bitcoin Price Hits $78,000 as Ceasefire Extension Ignites Bullish Momentum
Bitcoin breaches $78,000 following the US-Iran ceasefire extension and a $2.5 billion MSTR purchase. Here is the weekly BTC chart for key 2026 price targets.
August 9, 2024 10:16 AM

Bitcoin Price Prediction: After Breaking The $60k Mark, Can BTC Price Surpass $70k Next?
A huge surge in Bitcoin price is on the horizon with multiple signals waving for investors to grab this opportunity. Explore the potential for BTC price...

November 4, 2026 7:42 AM

Bitcoin ETF Outflows Pass $1 Billion: Why Institutions Are Selling After the Midterms
Spot Bitcoin ETFs bled over $1 billion in three sessions as the Binance hack and the midterms spooked institutions. Where does BTC go next?


More from CryptoTicker