
Bitcoin price analysis: BTC breaks the July low, is $50,000 next?
Bitcoin trades below its 200-week average and the daily RSI sits at 17. These are the levels that decide whether the crash runs to $50,000.

Which topics should we dive deeper into?
Select what genuinely interests you. Your picks feed directly into our editorial planning.
Crypto news that's actually worth your time.
Weekly. 60 seconds. Carefully curated by our editors: no hype, no promo flood, no spam.
Bitcoin has broken through the floor that held all year. $Bitcoin dropped to $55,150 early on Saturday, 21 November 2026. That is below the July low of $57,700 and the lowest level since September 2024. At 11:00 UTC, BTC traded at $57,822, down 6.6% in 24 hours and 14% over the week. From its record close of $124,753 in October 2025, bitcoin has now lost 54%, and 40% from this year's high of $96,929 in January.
Live prices are on our crypto prices page. These are the levels that matter now:
| Level | Price | Why it matters |
|---|---|---|
| Resistance 3 | $72,532 | 200-day moving average |
| Resistance 2 | $67,974 | 200-week moving average |
| Resistance 1 | $60,000 | Old range floor, now resistance |
| Price now | $57,822 | 21 November 2026, 11:00 UTC |
| Support 1 | $55,150 | Saturday's low |
| Support 2 | $53,949 | September 2024 low (daily close) |
| Support 3 | $50,000 | Psychological level |
Why did bitcoin break the July low?
Several drivers hit at once: markets expect the Fed to raise rates in December, AI and chip stocks keep sliding, spot ETFs are losing money, and leveraged longs are being flushed out. When BTC lost $60,000 on Friday evening, $553 million was liquidated in one hour. Over 24 hours, liquidations reached $2.64 billion, and 90% of them hit traders betting on higher prices.
Is bitcoin below the 200-week moving average?
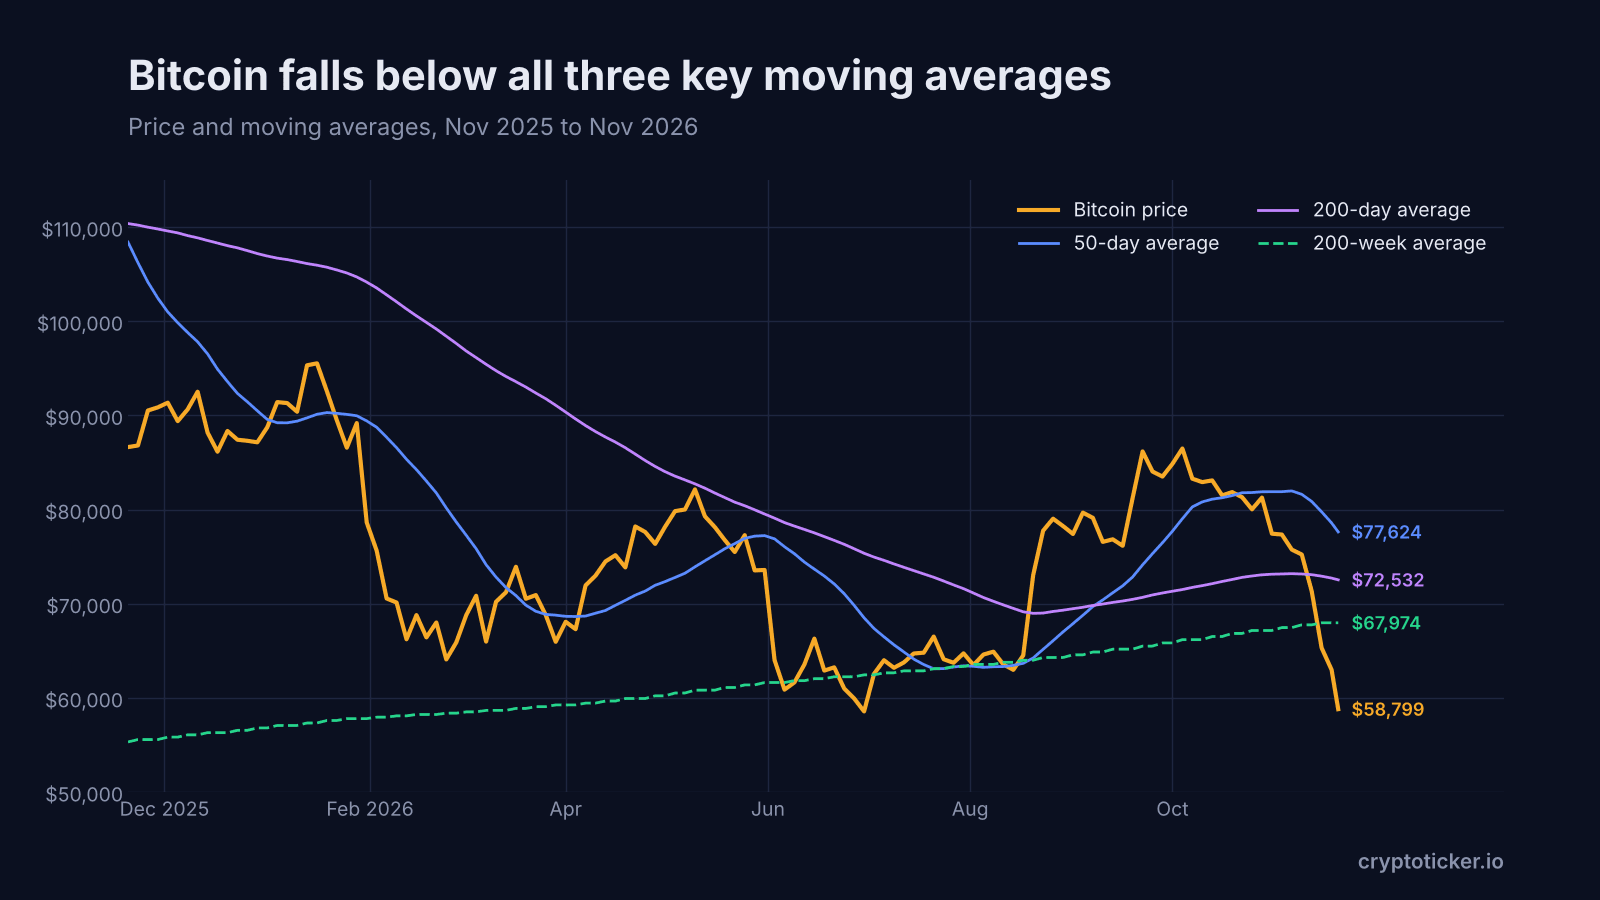
Yes, and that is the most important signal on the chart. The 200-week moving average, often seen as the long-term floor of a bull cycle, sits at $67,974. Bitcoin trades about 15% below it. It is the second break this year: in late June, BTC also slipped under the line before reclaiming it in August. In the 2022 bear market, bitcoin stayed below its 200-week average for months before the cycle bottomed.
The shorter averages point the same way. The 50-day moving average stands at $77,624 and the 200-day at $72,532, both well above the price. The 50-day line has dropped by more than $3,700 in ten days, so a death cross, when the 50-day falls below the 200-day, could follow within weeks if the slide continues.
Is bitcoin oversold?
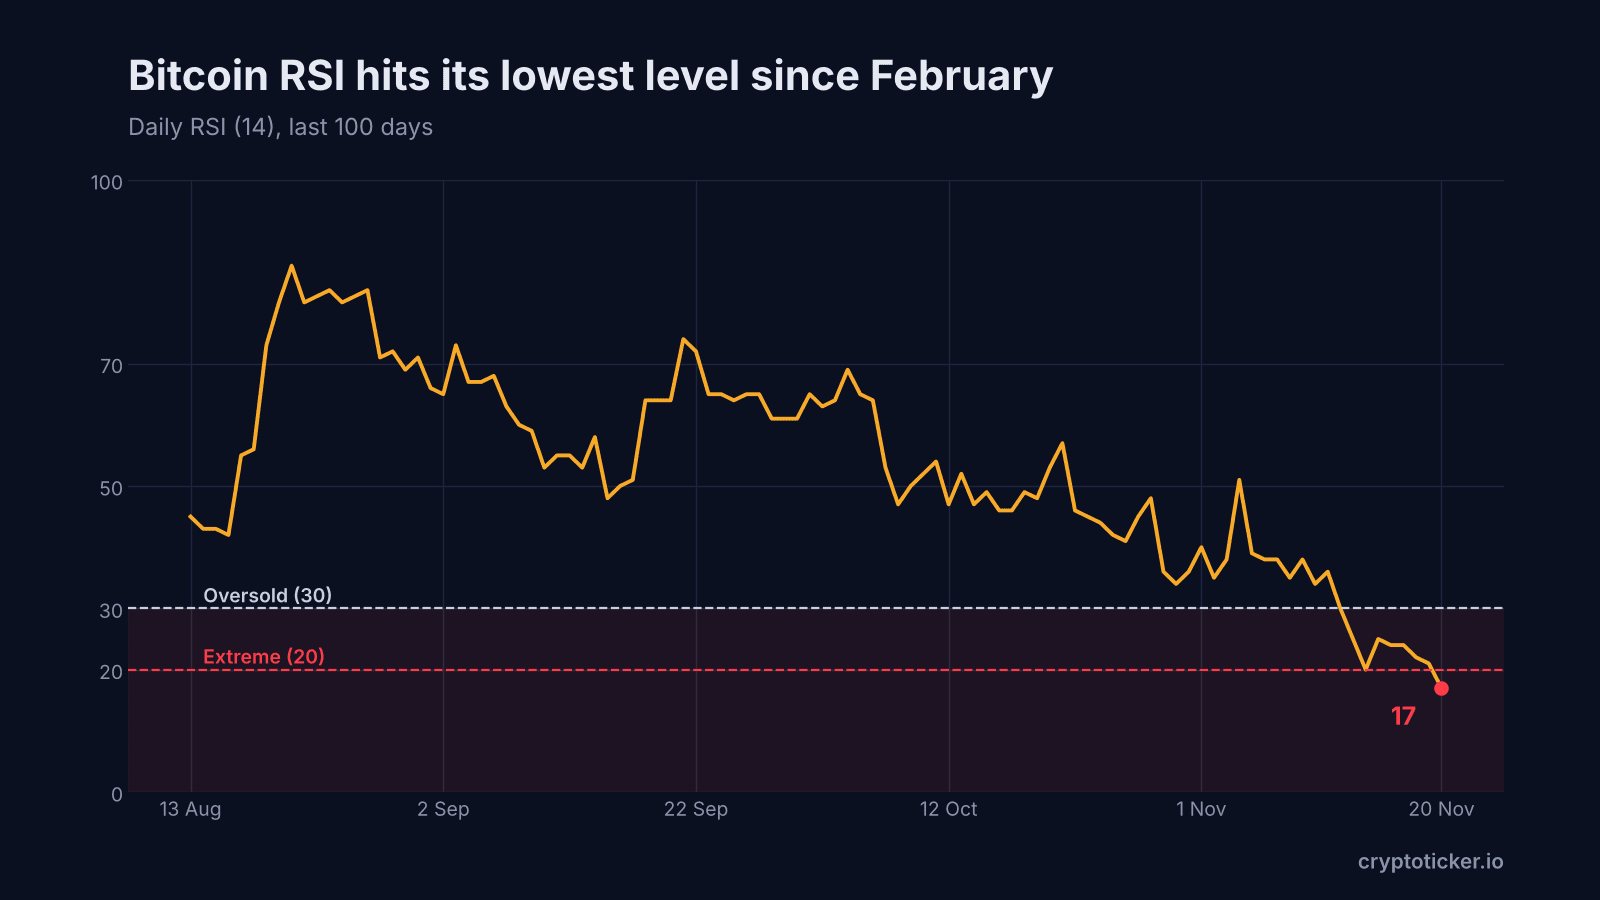
Very. The daily RSI (14) closed Friday at 17, its lowest reading since February 2026, when it hit 16 with bitcoin at $62,702. Readings below 20 are rare and usually come near short-term lows.
History gives no guarantee, though. Since 2022, the daily RSI fell below 22 five times before this week. Thirty days later, bitcoin was higher three times, by 4% to 7%, flat once and 8% lower once, in June 2026. Oversold markets tend to bounce, but a bounce is not a bottom.
Bitcoin support levels: how low can BTC go?
The first support is Saturday's low at $55,150. Below that, the September 2024 low at $53,949 (daily close) is the last major floor before round numbers take over. Wintermute has flagged the $50,000s as the zone that decides the bigger trend, and $50,000 is also the psychological level most traders watch.
Bitcoin resistance levels: what does BTC need to recover?
The broken lows now act as resistance. The first hurdle is the band between $57,700 and $58,559, the July low and the June closing low. Above that comes $60,000, the old floor of the range. A real trend change would need a weekly close back above the 200-week average at $67,974.
Bitcoin price prediction: three scenarios for the coming weeks
Bullish scenario: relief rally toward $64,000
With the RSI this stretched, a short squeeze is possible. If bitcoin reclaims $60,000, the mid-November range between $62,000 and $65,000 is the next target. A softer tone from the Fed or a return of ETF inflows could trigger it.
Base scenario: sideways between $54,000 and $60,000
Crashes are often followed by weeks of choppy trading. Until the Fed decision on 9 December, bitcoin could swing inside the range between the September 2024 low and $60,000.
Bearish scenario: a slide to $50,000
A daily close below $53,949 would open the way to $50,000. More forced selling, further ETF outflows or a half-point Fed hike would make this scenario more likely.
What does the bitcoin chart mean for investors?
The trend points down on every timeframe, and the indicators are stretched. That mix often produces sharp swings in both directions. Avoid leverage, decide in advance at which levels you would buy or reduce, and keep coins you do not trade in your own wallet. For live updates during the crash, follow our bitcoin crash live ticker.
Partner links: some links on this page are partner links. If you become a customer through one of them, we may earn a commission at no extra cost to you. Selection, ratings and ranking are decided independently by our editorial team. Ethics and Independence · Ownership and Funding
For later? Save this article and find it again in your profile.
More on Bitcoin: All Bitcoin news at a glance
Related articles
- Bitcoin price back to $100,000 by New Year's Eve? The odds are brutal
- Bitcoin Chart Analysis: Price, Key Levels and the Week Ahead
- Bitcoin price prediction: Wintermute warns of the $50,000s, the level that decides
- Bitcoin price prediction: Mayer Multiple drops to 0.88, 11 percent below the 200-day line
- Bitcoin price breaks below the 200-week line: how low can BTC go?
Which topics should we dive deeper into?
Select what genuinely interests you. Your picks feed directly into our editorial planning.
Crypto news that's actually worth your time.
Weekly. 60 seconds. Carefully curated by our editors: no hype, no promo flood, no spam.

November 13, 2026 5:19 PM

Bitcoin price slides to the 200-week moving average after US producer prices
After the US producer prices for October, bitcoin falls to around $68,100 and now sits barely above the 200-week moving average. Which figures explain the slide, how often the line gave way in 2026 and which levels matter now.
November 12, 2026 5:42 PM

Bitcoin price falls below $72,000: the reasons behind the drop
Bitcoin fell below $72,000 and its 200-day moving average on Thursday, its lowest level since August 20. The Nvidia CEO's resignation, MSCI's removal of Strategy, ETF outflows and rate worries all hit on the same day.
November 11, 2026 5:13 AM

Bitcoin price at $73,700: outflows from BlackRock's IBIT show no sign of stopping
Analysis: Bitcoin trades at around $73,700 on Wednesday morning, just above its 200-day moving average. BlackRock's bitcoin fund IBIT has lost money for seven trading days in a row, $1.66 billion in total, while equities rallied.
November 10, 2026 9:24 PM

Bitcoin price prediction: lowest level since August, will the $72,000 zone hold?
Analysis: bitcoin falls to its lowest level since August 20 after the US inflation data and tests the 200-day average at $73,150. What ETF outflows, the options market and the Fed mean for the zone between $72,000 and $75,000.

November 9, 2026 11:17 AM

Bitcoin slips below Strategy's $75,451 cost basis as Saylor's 849,327 BTC go underwater
Analysis: Bitcoin trades at around $74,030 on Monday, below the $75,451 average price at which Strategy bought its 849,327 BTC. What the SEC filing reveals about the purchases, which levels matter now and how Bitcoin and Strategy shares are taxed in Germany.
November 9, 2026 5:13 AM

Bitcoin price holds $74,800 as the 200-day average at $73,170 faces US inflation data
Analysis: Bitcoin starts the week at around $74,800 after briefly dropping to $73,477 on Sunday evening, its lowest level since August 21. The 200-day moving average sits just below, and US inflation data is due on Tuesday.

November 7, 2026 10:59 PM

Will Bitcoin Go Back Up? Three Scenarios to Year-End: $70,000, $80,000 or $100,000
Bitcoin (BTC) is 40% below its record, ETFs are bleeding cash and the Fed may hike. What happened since early November, which levels decide between $70,000, $80,000 and $100,000, and what price history says about the 53 days to New Year's Eve.
November 7, 2026 11:12 AM

Bitcoin Price Prediction: BTC Sits on the $75,700 Cost Basis of Recent Buyers
Analysis: Bitcoin trades at around $75,900 on Saturday, almost exactly at the cost basis of investors who bought in the past 155 days. Which levels count until the end of November, and what this means for purchases made since June.
November 7, 2026 9:46 AM

Crypto Crash: Why Bitcoin, Ethereum, XRP and Solana Fell This Week and What Comes Next
Bitcoin lost its post-election gains, ETH hit a 10-week low and XRP led the losses. The four drivers behind this week's crypto crash and the levels to watch.
November 6, 2026 5:22 AM

Bitcoin price at $75,700: BTC trades below its 100-day line ahead of the US jobs report
Context: Bitcoin starts Friday at $75,692, a good $5,000 below Thursday's high and under its 100-day line. The US jobs report for October follows at 2:30 p.m. German time, and it will decide whether the 200-day line at $73,200 becomes the next target.
November 5, 2026 9:12 PM

Solana Price Slides to $89, First Test of the 200-Day Line Since August
The Solana price fell 6.4 percent to around $89 on November 5 and touched its 200-day line for the first time since August. A chip sell-off on the Nasdaq set it off, amplified by more than $1 billion in liquidations and ongoing ETF outflows.
November 5, 2026 8:07 AM

Bitcoin Price Prediction: 24,912 Calls Against 8,223 Puts, What Friday's Expiry Decides
On Friday, Bitcoin options worth about $2.65 billion expire at Deribit, with three times as many calls as puts. The price sits just above max pain. Which levels count now and what range the options market is pricing in.
November 4, 2026 5:23 AM

Bitcoin price at $76,947: after election night, the $75,740 low is the line to watch
By Wednesday morning, Bitcoin (BTC) had recovered half of its US election-night slide and stood at $76,947. Which levels matter now, and why purchases from November 2025 become tricky for German taxpayers this week.
November 3, 2026 8:59 AM

Ethereum Price Below $2,300: Is $2,000 Next or Is This the Bottom?
Ethereum price slips toward $2,250 as $3 billion leaves DeFi. Whales are buying the dip. Does ETH hold $2,200 or test $2,000 next?
November 3, 2026 8:28 AM

Why Is Crypto Down Today? The 5 Reasons Behind the November 3 Sell-Off
Why is crypto down today? Bitcoin sits near $76,000 after the Binance hack, a hawkish Fed and a Nasdaq slide. The five drivers, explained.
November 3, 2026 5:15 AM

Bitcoin price at $76,887: BTC slips to its 100-day line on US election day
Bitcoin falls to its 100-day average of around $76,540 on the morning of the US election and briefly trades below it for the first time since August. For German buyers from November 2025, the one-year holding period ends at the same time, with consequences for offsetting losses.
November 2, 2026 9:36 PM

Bitcoin price prediction: $295 above the 100-day line, the level that decides
Analysis: the daily low was $295 above the 100-day line at $76,035. Four trading days before the US midterm elections and with an 82.6 percent rate expectation for December, this gap will decide the coming weeks.
October 31, 2026 10:52 AM

XRP Price Crash Continues: XRP Loses $1.30 Support, Here Is the Next Target
XRP price crashes below $1.30 after weeks of defending the level. We analyze the chart and reveal the next short-term target for XRP as selling continues.
October 31, 2026 9:46 AM

Bitcoin Price Crash Continues: BTC Slips Below $78,000, Here Is the Next Target
Bitcoin price crashes below the key $78,000 area as selling pressure builds. We analyze the chart and reveal the next short-term target for BTC.
October 30, 2026 8:02 AM

Bitcoin Price After Binance Hack: Only 2% Down. What Comes Next?
Bitcoin fell only 2% after the biggest crypto hack ever drained $2.8 billion from Binance. Here are the higher and lower Bitcoin price targets now.
October 27, 2026 12:31 PM

XRP Price Crashes Below $1.30: What Caused It and What Comes Next
XRP price has dropped below $1.30 after weeks of selling. Here are the factors behind the XRP crash and the next high and low price targets.
October 26, 2026 7:36 AM

Bitcoin Price Crash: Top 3 Reasons Why BTC Price Dropped Below $80,000
Bitcoin price crashed below $80,000 over the weekend. Oil, ETF outflows and a wave of liquidations explain the move, and the Fed decides this week.
October 10, 2026 10:44 AM

Top 3 Coins to Watch Next Week: These Altcoins Could Explode
Twelve of the top 17 coins closed the week in the red. These three didn't. Here are the altcoins to watch next week and the catalysts behind them.
September 28, 2026 9:47 AM

XRP Price Drops Below $1.50: Where Is Ripple Heading This Week?
XRP price slips under $1.50 after a red weekend. Here is the XRP price analysis with the higher and lower targets that matter this week.
September 11, 2026 8:32 AM

Bitcoin Price Drops 4% in a Week, and the Chart Just Got Interesting
Bitcoin price fell 4% this week and lost the $78,000 shelf. Here is what the chart says about the next support, resistance and price targets.


More from CryptoTicker