
XRP Price Drops Below $1.50: Where Is Ripple Heading This Week?
XRP price slips under $1.50 after a red weekend. Here is the XRP price analysis with the higher and lower targets that matter this week.




Which topics should we dive deeper into?
Select what genuinely interests you. Your picks feed directly into our editorial planning.
Crypto news that's actually worth your time.
Weekly. 60 seconds. Carefully curated by our editors: no hype, no promo flood, no spam.
The XRP price lost the $1.50 mark on Monday morning, trading around $1.47 after a 2.9% daily drop. That is not the end of the world, but it is an important level, and the way $XRP behaves around it will decide the whole week. Here is what the chart is telling us.
Why Did the XRP Price Drop Below $1.50?
Zoom in on the last seven days and the picture is clear: XRP has been printing lower highs since the local peak near $1.63 on September 23. A second attempt at $1.60 on September 25 failed as well, and since then the price has been bleeding slowly, from $1.55 to $1.52 to $1.50, and now $1.47.
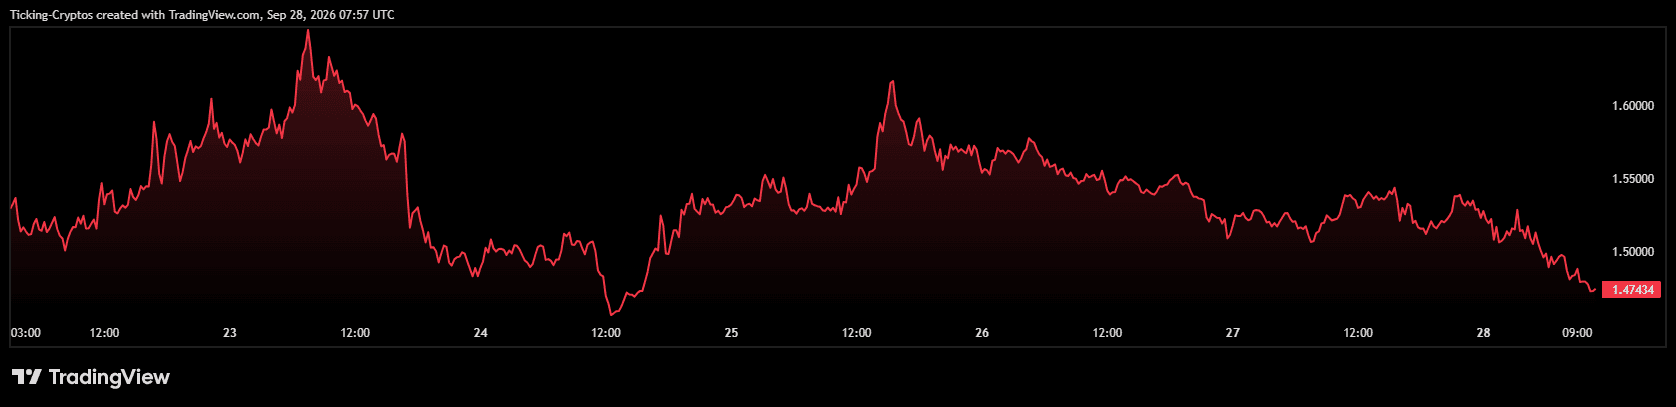
Nothing dramatic happened on any single day. This is the kind of sell-off where buyers simply do not show up, and every small bounce gets sold. After the strong rally in early September, some cooling was overdue, and the market is now testing whether $1.50 is real support or just a number.
Check the live crypto prices on CryptoTicker to follow the move in real time.
What Does the Daily XRP Chart Show?
The bigger picture is more constructive than the weekly candles suggest.
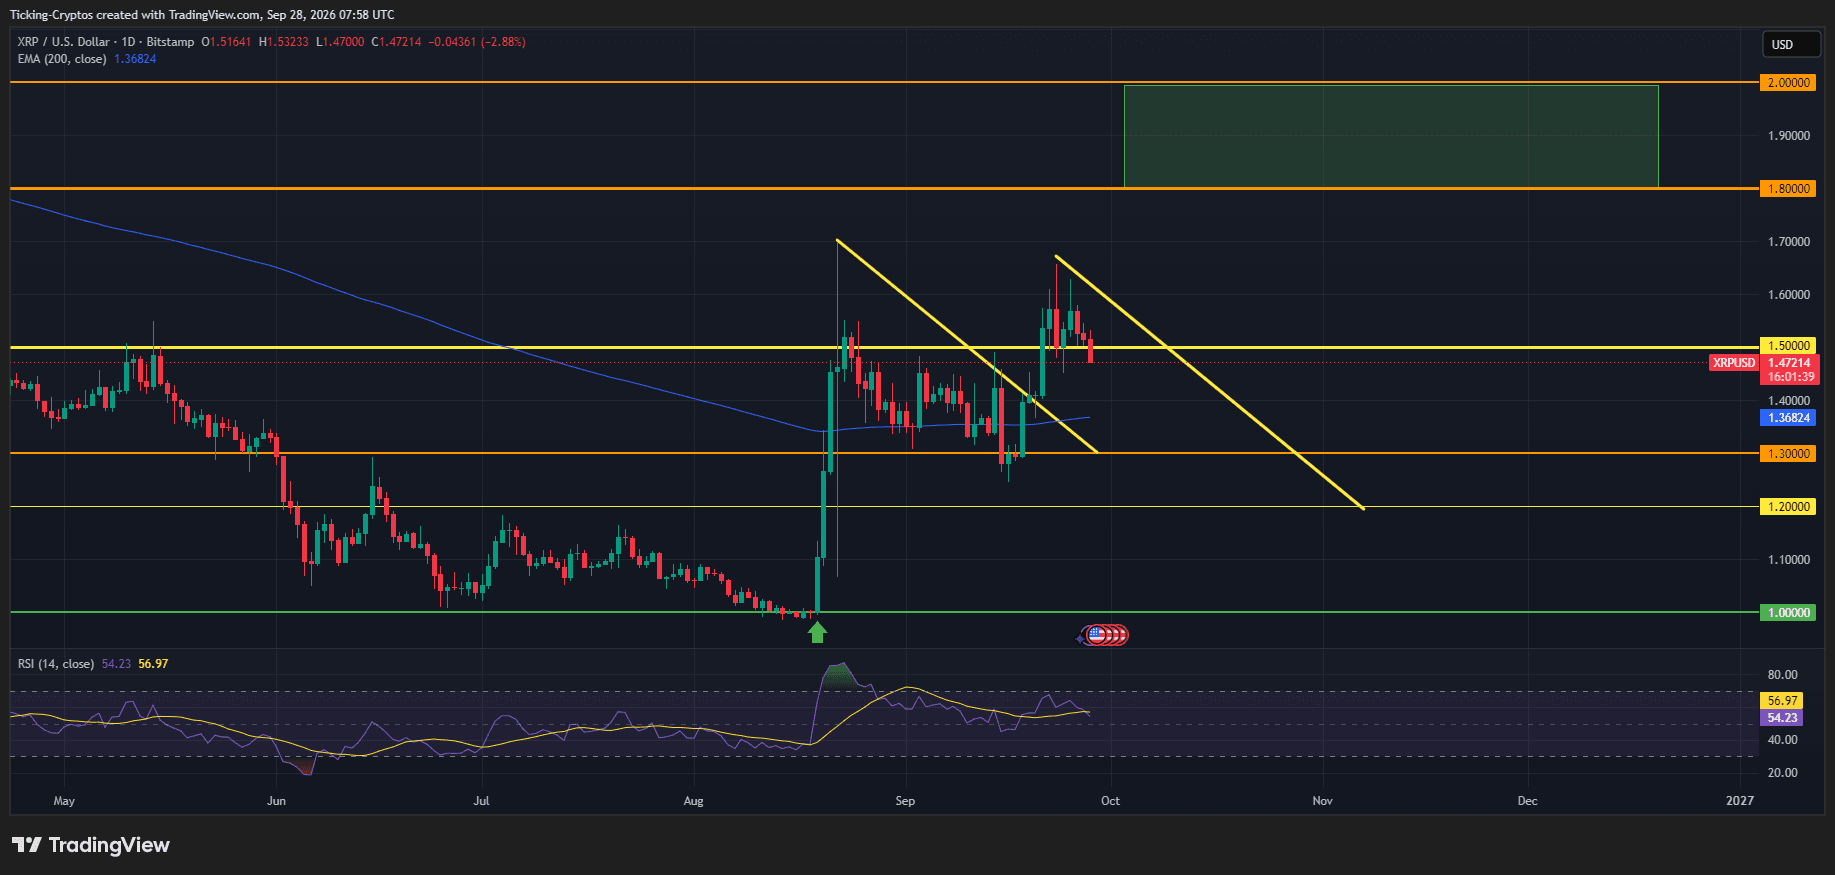
Three things stand out on the daily chart:
- XRP is still above the 200-day EMA. The long-term average sits at $1.37, and it is now curling upward for the first time since spring. As long as XRP stays above it, the medium-term trend remains bullish.
- The first downtrend line is already broken. The descending trendline from the late-August spike to $1.70 was cleared in mid-September when XRP pushed back above $1.50. That breakout is what triggered the rally to $1.67.
- A second downtrend line is now in play. From the September 23 high, a new descending line runs toward $1.20 by mid-November. The current pullback is happening right under it. For the bulls, breaking this line is the job for October.
The RSI is at 54, neutral, with room to move in either direction. No overbought or oversold signal, which means momentum is not driving this yet. Price levels are.
What Are the Higher XRP Price Targets This Week?
The first task for the bulls is simple: close a daily candle back above $1.50. Do that, and the drop below $1.50 becomes a fakeout rather than a breakdown.
- Target 1: $1.55. The zone where XRP spent most of last week and where the second descending trendline currently sits. A move here would be the first real sign of strength.
- Target 2: $1.60 to $1.63. Last week's twin highs. A break above this range would put the September 23 high back in play.
- Target 3: $1.67 to $1.70. The September high and the August spike top. Not a realistic target for this week unless a catalyst hits, but it is the level that opens the road to the $1.80 to $2.00 zone marked as the medium-term target on the chart.

What Are the Lower XRP Price Targets This Week?
If XRP cannot reclaim $1.50 in the next day or two, the downside levels are just as clear:
- Target 1: $1.40 to $1.42. The area of the mid-September consolidation, where XRP based before its last leg up. Expect buyers to defend it.
- Target 2: $1.37. The 200-day EMA. This is the most important support on the chart. A daily close below it would flip the medium-term picture from bullish to neutral.
- Target 3: $1.30. The horizontal support that held twice in September. Losing $1.30 would confirm the second descending trendline and put $1.20 on the table, though that is a scenario for a broader market sell-off, not for a normal week.

 CryptoTicker trading game: try it free
XRP Price Prediction: Bullish or Bearish?
For this week, XRP is a range trade between $1.37 and $1.60, and $1.50 is the pivot inside that range. The base case is a dip toward $1.40 to $1.42 that gets bought, followed by another attempt at $1.50. The bullish case needs a quick reclaim of $1.50 and a push into $1.55. The bearish case is a close below the 200-day EMA at $1.37.
The longer-term structure is still healthy. XRP is up nearly 50% from the $1.00 low in August, the 200-day EMA is turning up, and the $1.80 to $2.00 target zone remains valid into Q4. Pullbacks to support in an uptrend are usually opportunities, not warnings. Watch $1.37 and $1.50, and let the chart do the rest.
More on XRP: All XRP news at a glance
Related articles
- XRP Price Prediction: Can XRP Hit $3 Soon If the Bull Market Returns?
- XRP Price Prediction: Is XRP Ready to Hit $2 in 2026?
- XRP Price Prediction: Ripple Finds Strong Support Near $1.60 Level
- XRP Price Prediction: XRP Jumps Above $2.30 as Bullish Momentum Builds
- XRP Price Prediction: Is Now the Right Time to Buy XRP After the Dip?
Which topics should we dive deeper into?
Select what genuinely interests you. Your picks feed directly into our editorial planning.
Crypto news that's actually worth your time.
Weekly. 60 seconds. Carefully curated by our editors: no hype, no promo flood, no spam.

July 17, 2026 7:55 PM
Is XRP a Good Investment in 2026? Price Analysis and Prediction
XRP has broken out of its summer range and is holding above its 200-day average — without the catalyst the market waited a year for. What the chart, the CLARITY Act and 2026 forecasts really say.

September 23, 2024 8:44 AM
Is it a Good Idea to Buy XRP below $0.60?
With recent XRP price drops positioning it below the $0.60 mark, investors are left pondering. Is it a good idea to buy XRP below $0.60?
December 10, 2024 12:30 AM

Bitcoin Price Drops Below $100K – Is a Bigger Crash Coming?
Bitcoin has fallen below $100K, triggering a broader market correction of over 8% in the last 24 hours. With profit-taking and large sell-offs hitting the market, could Bitcoin drop to $90K or lower?
July 7, 2024 3:21 PM
XRP, DOGE, and ADA Price Prediction: A Fast Recovery BUT How Long Lasting?
The potential turnaround for XRP, Dogecoin, and Cardano as key metrics indicates a buying opportunity amidst the current market downturn. Here is the latest XRP, DOGE, and ADA price prediction and analysis for a better understanding.
August 3, 2026 10:41 AM
Is XRP Coin a Good Buy At Current Prices?
XRP trades at $1.29 and has lost both moving averages, with the 50-day EMA dropping back below the 200-day on 17 October. Why the $1.20 shelf now decides where the recovery finds its floor.
February 14, 2026 6:43 PM
XRP Price Prediction: Ripple Eyes $1.50 Breakthrough After 4% Daily Jump
XRP price surged 4% today, testing the critical $1.50 resistance. Our prediction explores if Ripple can hit $2.00 or if a dip to $1.15 is more likely.
December 19, 2024 2:31 PM

XRP Crash: What Happened and What's Next for the Last Days of 2024?
XRP recent crash has left investors on edge as the crypto faces significant market turbulence. But what are the reasons behind the drop?
October 7, 2026 8:42 PM
Can XRP Price Reach $10? Here Is What the Math Says
XRP trades near $1.42 after losing $1.50. We check the $10 forecasts, the charts and the market cap math to see if XRP can really reach $10.
June 19, 2026 11:56 AM
XRP Price Down 40% in 2026: Will $1.00 Support Spark a Rebound?
XRP has dropped to its 2026 low around $1.12, down roughly 40% YTD. With $1.00 looming as major support, here's why a rebound could follow.
January 16, 2026 2:33 PM

XRP Price Prediction: Bullish Breakout Confirmed as XRP Smashes Through Key Triangle
XRP breaks its descending triangle higher! Here are the latest XRP price predictions, bullish targets for 2026, and the worst-case support levels to watch.
May 26, 2026 6:15 PM
XRP Price Prediction: Ripple Signals a Violent Reversal Toward the $2.50 Target
XRP lost 40% over the last six months, but technical indicators suggest a macro bottom is in. What are the potential returns from current prices?
September 22, 2026 5:54 PM
XRP Price Prediction: Breakout Puts $1.80 Back In Play
XRP just snapped its descending trendline and reclaimed $1.50 with RSI at 67. Here is what the daily chart says about the road to $1.80 and above.
December 16, 2025 10:25 AM
XRP Price Crash: Why XRP Fell Below $2 and Where is it Heading Next
XRP lost the $2 level after a sharp rejection and is now sliding toward a critical $1.80 support zone. Here’s what the chart is signaling next.
September 21, 2026 11:44 AM
XRP Price Breaks Its Downtrend: Is $2 Finally In Sight?
XRP just snapped the trendline that capped it all September. Here is what the chart says about $1.50, $1.80 and the road to $2.
June 25, 2024 6:26 PM

Solana Price Prediction: Will SOL Surpass 200$?
Why Solana, Shiba Inu, and Cardano are poised for a major rebound, according to the latest market analysis. Can Solana capitalize on the buy signals and reach a new price target?
August 29, 2026 10:30 AM
XRP Price Prediction: XRP Ripped From $1 To $1.66 In Three Days, Here Is Where It Goes Next
XRP exploded 66% off the $1 floor, then gave back a third of it. Here is the full chart breakdown and the XRP price targets that matter now.
June 4, 2026 3:50 PM
XRP Price Crash: Token Breaks Crucial 1.20 Support Level as Bearish Momentum Accelerates
XRP breaks below the critical 1.20 support level, accelerating its price crash. Technical indicators point to further downside risk.
March 23, 2026 6:00 AM
XRP Price Holds Key Support — Is a Breakout Coming Next?
XRP price holds above key support near $1.38 despite market volatility. Is XRP preparing for its next breakout move?
February 7, 2026 6:30 PM

Ethereum Price Prediction 2026: Technical Analysis of ETH Coin During the Crypto Crash
Ethereum price faces a major test at $1,800. This 2026 technical analysis of the ETH coin explores recovery targets and deeper crash support levels.
September 1, 2026 11:14 AM

XRP Price Falls 8% in a Week: Is This Dip Actually Worth Buying?
XRP gave back 8% this week after a violent August melt-up. Here is what really drove that rally, what the chart says now, and what buying here depends on.
April 4, 2026 11:00 AM

XRP News Today: Ripple RLUSD Expansion and the CLARITY Act Impact
XRP faces technical pressure while Ripple’s RLUSD stablecoin gains global traction. Explore how the CLARITY Act could redefine the XRP Ledger ecosystem.
April 6, 2026 6:24 PM

Ethereum Price Analysis: ETH Consolidates Between $1,800 and $2,100, What’s Next?
Ethereum price is stuck in a tight range between $1,800 and $2,100. Analysts warn of a decisive breakout or breakdown as volatility reaches a boiling point.
September 29, 2026 10:38 AM
Bitcoin Falls Toward $83,000 as Trump Rejects Iran Ceasefire Deal
Bitcoin slipped toward $83,000 after Trump rejected Iran's Hormuz proposal, sending oil above $100 and wiping out $478 million in crypto liquidations.
June 30, 2024 7:29 PM

DOGE Price Prediction for July 2024: What to Expect?
What lies ahead for DOGE in July 2024? Here is a brief analysis as we are about to end June and enter into July, along with predictions for DOGE's price movement and market trends.
March 11, 2026 8:31 AM

Why is Bitcoin Moving Sideways? 3 Reasons for the BTC Price Consolidation
Bitcoin has dropped only 0.9% this month but remains trapped in a range. Here's why BTC is moving sideways and how traders are profiting from 63K to 73K.


More from CryptoTicker