
XRP Price Prediction: XRP Ripped From $1 To $1.66 In Three Days, Here Is Where It Goes Next
XRP exploded 66% off the $1 floor, then gave back a third of it. Here is the full chart breakdown and the XRP price targets that matter now.

Which topics should we dive deeper into?
Select what genuinely interests you. Your picks feed directly into our editorial planning.
Crypto news that's actually worth your time.
Weekly. 60 seconds. Carefully curated by our editors: no hype, no promo flood, no spam.
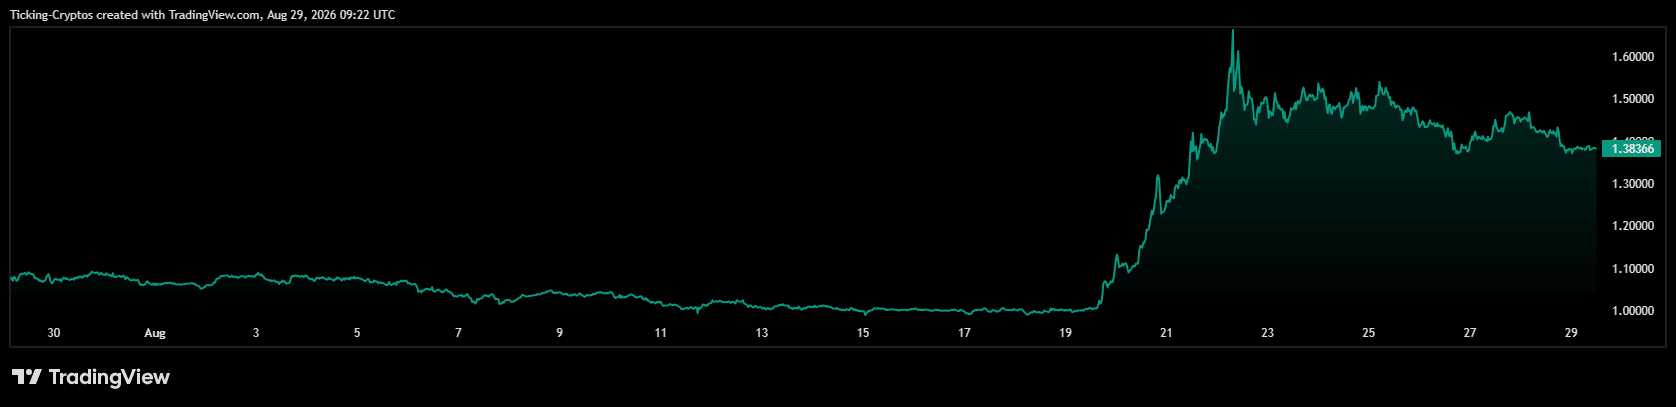
For three weeks in August, XRP did absolutely nothing. It sat on the $1.00 handle like a rock in a river, and most of the market stopped looking at it. Then on August 19 it went vertical, and by August 22 it had printed roughly $1.66. XRP now trades around $1.38.
That is the setup. Now let's look at why it happened and where the chart says it goes from here.
What XRP News Is Actually Moving The Price?
Three headlines are doing the heavy lifting, and only one of them is really new.
- Evernorth cleared its SEC hurdle. The XRP treasury company announced that the SEC declared its registration statement effective for the proposed business combination with Armada Acquisition Corp. II. Armada shareholders now vote on September 30, and if it passes, the combined entity is expected to list on Nasdaq under the ticker XRPN. Evernorth currently holds around 473 million XRP and is backed by Ripple, SBI Group, Pantera Capital, Kraken, GSR and Arrington Capital. Think of it as the first serious attempt at a Strategy-style treasury vehicle built entirely around XRP.
- ETF flows woke up. SoSoValue data showed US spot XRP ETFs pulled in $28.14 million in net inflows on August 26, the second-largest single day of 2026 and the strongest in more than seven months. The streak has now run multiple weeks without a single day of net outflows. Cumulative inflows since launch sit near $1.62 billion.
- The XRP Ledger crossed 5 billion lifetime transactions. Nice milestone for a 14-year-old network, and it will get quoted in every bullish thread this week. Be honest about what it is though: a lagging adoption stat, not a price catalyst.
One caveat worth keeping in your head. A $28 million inflow day being called a seven-month high tells you more about how dead the previous seven months were than about how big this session was. And ETF flow data does not tell you who bought. Retail with a brokerage account buys the exact same share as a pension fund.

How Did XRP Jump From $1 To $1.38?
The move was not a slow accumulation. It was a squeeze.
$XRP spent August 5 through August 18 grinding lower inside a tight band between roughly $1.00 and $1.06, with a visible flush toward the $1.00 line around August 11 to 15. That is the kind of price action that builds up a wall of short positions and stop orders sitting just above the range.
On August 19 the range broke. Over the next 72 hours XRP went from about $1.05 to a spike high near $1.66, a move of roughly 58% measured from the breakout and about 66% measured off the $1.00 base. Futures volume across Binance, Bybit, OKX and Bitget hit $11.37 billion on August 22, the highest reading since early February.
That combination, a long flat base plus a vertical candle plus record futures volume, is the fingerprint of a short liquidation cascade rather than steady spot accumulation. Bitcoin breaking above $80,000 in the same window gave the whole altcoin complex the push it needed, and XRP was the most heavily shorted large cap sitting on a spring.
Since the $1.66 spike, XRP has been rolling over in a sequence of lower highs: roughly $1.55, then $1.52, then $1.50, now $1.38. That is textbook post-spike distribution.
What Does The XRP Chart Actually Show?
Look at the shape of the move, not the percentage.
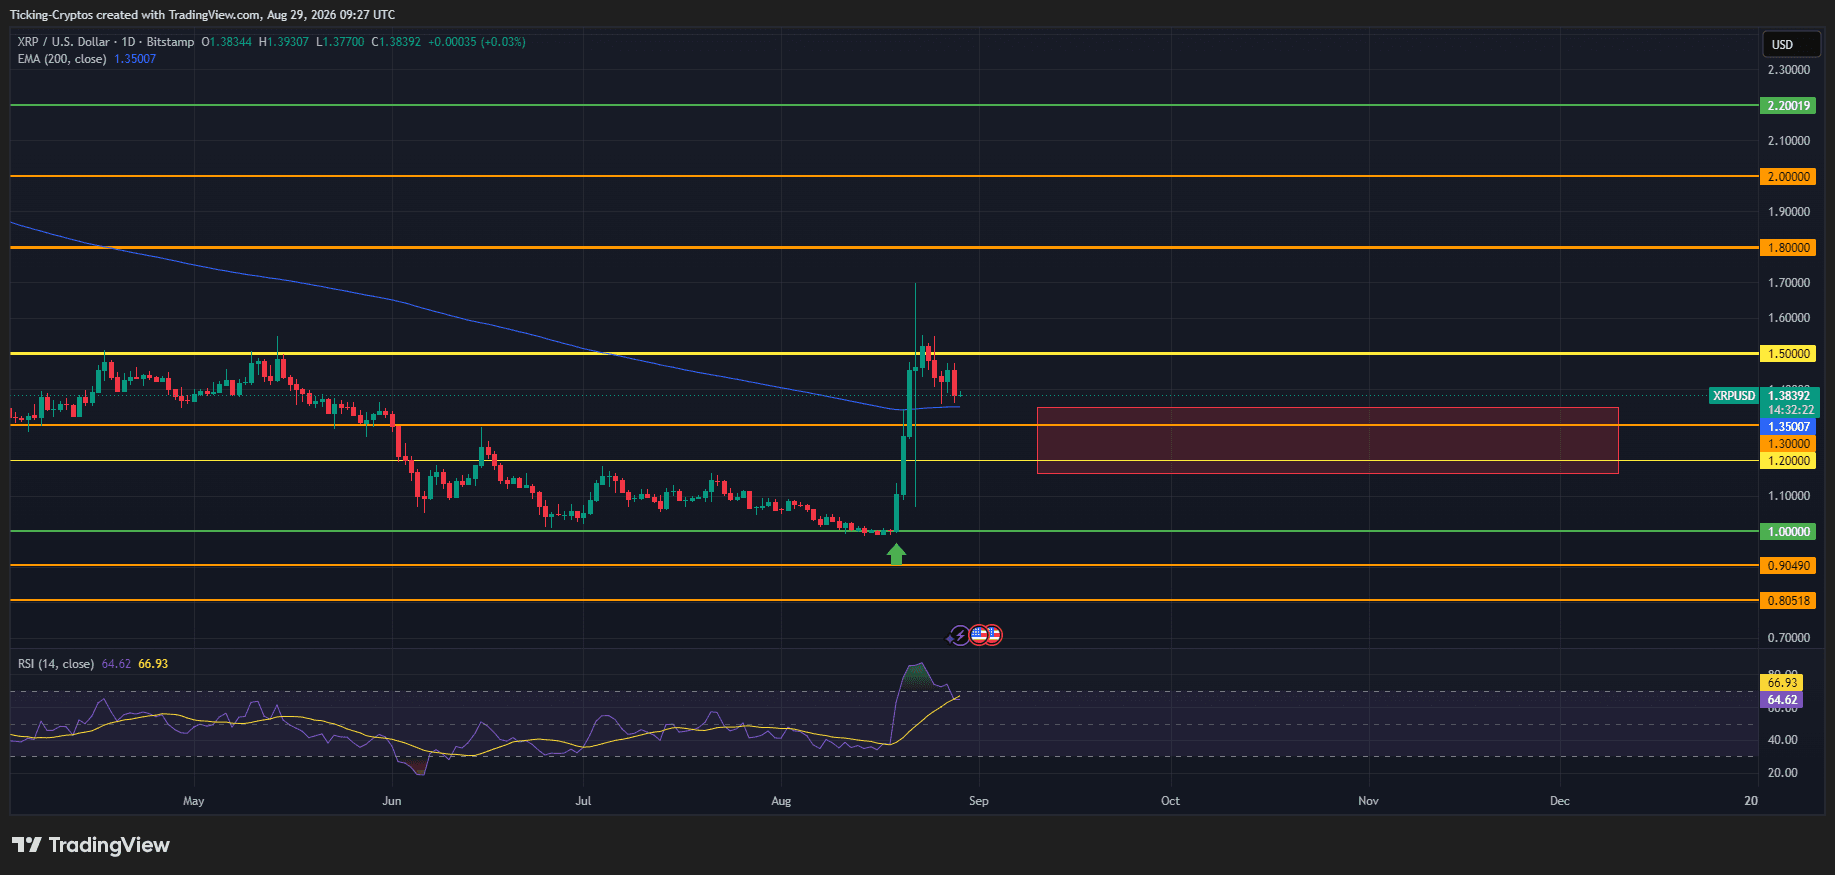
The rally from $1.05 to $1.40 happened so fast that almost no volume traded in between. There is a price vacuum sitting under the market between roughly $1.10 and $1.30. Nobody accumulated there, nobody has a cost basis there, so there is nothing structural to catch a falling price inside that zone. Vacuums cut both ways: they let price rip upward with no resistance, and they let it drop back through with no support.
The second thing the chart shows is that XRP has failed to make a new high since August 22. Every push since then has topped lower. The pullback has now been running for a full week, which matches how XRP corrections have historically behaved after moves of this size. They take time. They do not resolve in an afternoon.
Third, XRP is still holding above its key daily moving averages and is still up meaningfully on the month. This is a pullback inside an uptrend until proven otherwise. It only becomes a failed breakout if $1.30 goes.
Worth remembering for scale: XRP printed roughly $2.43 in January 2026 and its cycle top was $3.65 back in July 2025. Even at $1.66, this rally recovered a small fraction of that.
 Find a crypto exchange with an EU licence
Where Are The Key XRP Support And Resistance Levels?
Resistance:
- $1.43 to $1.47 is the immediate ceiling. This has capped price repeatedly over the past few sessions.
- $1.55 is the level that matters. It was the floor of the post-spike consolidation, and it flipped to resistance when XRP lost it. A sustained daily close above $1.55 is the single cleanest bullish confirmation available right now.
- $1.66 to $1.69 is the spike high. Getting there requires new buyers, not just short covering.
Support:
- $1.38 is first support and XRP is sitting directly on it as you read this.
- $1.30 is the line that defines the whole setup. Below it, the vacuum opens up.
- $1.10 is the top of the old range and the first real structural shelf underneath.
- $1.00 is the base. Losing this invalidates everything about the August move.
XRP Price Prediction: What Are The Realistic Targets?
Bullish case: $1.55, then $1.80 to $2.00
XRP holds $1.38, reclaims $1.47, and closes a daily candle above $1.55. That confirms the pullback was a consolidation rather than a top and opens a retest of $1.66. Above the spike high, the next meaningful area is $1.80 to $2.00, with $2.00 being the round number every analyst is already circling. The fuel for this is a clean Evernorth shareholder vote on September 30, continued ETF inflow streaks, and Bitcoin holding above $80,000. Probability feels moderate. This needs a catalyst, not just hope.
Base case: chop between $1.25 and $1.50
The most boring outcome is also the most likely. XRP has just moved 66% in three days on a squeeze. Markets that do that usually spend weeks digesting it. Expect XRP to grind sideways inside a widening $1.25 to $1.50 range, frustrating both sides, until the September calendar delivers something. The two dates on that calendar are the Fed decision on September 16 and the Evernorth vote on September 30.
Bearish case: $1.20, then $1.10, then a $1.00 retest
If $1.30 breaks with volume, the vacuum does its job. There is very little to slow a move down until $1.10, and once there, the $1.00 base is only one bad session away. The structural argument for this case has not gone anywhere: Ripple releases 1 billion XRP from escrow at the start of every month and typically re-escrows 600 to 800 million, leaving 200 to 400 million tokens of new circulating supply each month. That is still entering the market faster than the entire ETF complex is absorbing it.
What Could Break This XRP Setup?
Watch these four things:
- The Evernorth vote on September 30. A delay, a failed vote or a closing condition problem kills the XRPN narrative outright, and that narrative is carrying a lot of this move.
- ETF flows turning negative. The inflow streak is the second leg of the story. The day it snaps, the bid thins out.
- Bitcoin losing $80,000. XRP has no independent bid right now. If BTC rolls over, XRP goes with it and faster.
- The monthly escrow release. September 1 brings another billion. Check the re-escrow number before reacting to the headline, because most coverage ignores it and gets the supply math wrong.
The Bottom Line On XRP
XRP did something genuinely impressive in August. It broke a range that had been suffocating it since June and it did so with real volume behind it. But the move was driven more by liquidations than by accumulation, and the week of lower highs since the top tells you the buyers who chased $1.60 are now underwater and selling into strength.
$1.30 is your line. Above it, this is a healthy pullback in an uptrend with $1.55 as the next real test. Below it, you are looking at a fast trip back to where this all started.
Frequently asked questions about XRP after the 66 percent rally
Partner links: some links on this page are partner links. If you become a customer through one of them, we may earn a commission at no extra cost to you. Selection, ratings and ranking are decided independently by our editorial team. Ethics and Independence · Ownership and Funding
For later? Save this article and find it again in your profile.
More on XRP: All XRP news at a glance
Related articles
- XRP Chart Analysis: Price, Key Levels and the Week Ahead
- Bitcoin Chart Analysis: Price, Key Levels and the Week Ahead
- XRP price prediction: 240 million XRP move at a two-year low, but not to an exchange
- XRP drops out of the top 5 and keeps lagging bitcoin
- XRP price prediction: can record whale wallets offset $18 million in ETF outflows?
Which topics should we dive deeper into?
Select what genuinely interests you. Your picks feed directly into our editorial planning.
Crypto news that's actually worth your time.
Weekly. 60 seconds. Carefully curated by our editors: no hype, no promo flood, no spam.

November 11, 2026 7:14 AM

XRP price prediction: funding rate at a 13-month high, what it means for your coins
Analysis: XRP has lost 30 percent since early October, yet leveraged buyers are paying more in funding than at any point in 13 months. Plus the picture for the spot ETFs and the last emptied wallet of the Binance attacker.
November 8, 2026 7:16 AM

Binance XRP scarcity index at a four-year high: XRP price prediction ahead of the weakest weekly close since August
Analysis: XRP is scarcer on Binance than at any point in four years, with CryptoQuant's scarcity index at 2.1. Yet the US spot ETFs took in nothing for an entire week, and at $1.16 XRP is heading for its lowest weekly close since August.

November 7, 2026 7:14 AM
XRP Price Prediction: Long Squeeze Drags XRP to $1.15, the Level That Decides
Analysis: XRP fell to $1.1518 early on Saturday, its lowest level since August 20, after a long squeeze forced $16 million of positions shut. Yet on OKX, 4.3 long accounts still face every short account, and below the price sits a band with almost no trading history.
November 6, 2026 7:31 AM
XRP Price Prediction: Third Test of the $1.19 Zone in Eight Days
Analysis: XRP fell to $1.188 on Friday morning and is testing the zone around $1.19 for the third time since October 30. Futures positioning, Binance reserves and the US jobs report will decide whether it holds once more.
November 1, 2026 12:16 PM

XRP price prediction: 133 million tokens leave the exchanges, and what is behind it
Analysis: the exchange wallets attributed to Ripple shrank by 133 million XRP in the week to October 31, while the monthly release window opens on November 1 for more than a billion tokens. Both figures are documented; how this counter-movement should be read follows further down as the editorial team's assessment.

October 31, 2026 10:52 AM
XRP Price Crash Continues: XRP Loses $1.30 Support, Here Is the Next Target
XRP price crashes below $1.30 after weeks of defending the level. We analyze the chart and reveal the next short-term target for XRP as selling continues.
October 30, 2026 6:37 PM

XRP price prediction: will the price rise after $8.4 million of inflows?
Analysis: the US XRP funds took in a net $8.43 million on Thursday, the strongest daily figure of October. Why that sum still barely moves the price and which two levels count now.
October 29, 2026 7:16 AM
Ripple Is Now a Bank: Why XRP Price Keeps Falling Anyway
Ripple got final OCC approval for a national trust bank, BNY custody and a Moody’s rating in one week. XRP fell anyway. Here is why.
October 27, 2026 12:31 PM
XRP Price Crashes Below $1.30: What Caused It and What Comes Next
XRP price has dropped below $1.30 after weeks of selling. Here are the factors behind the XRP crash and the next high and low price targets.
October 20, 2026 10:28 AM
XRP price prediction: a 13-week inflow streak breaks as $2.47 million leaves a single fund: what you can do now
The US spot ETFs on XRP gave up more money than they took in last Friday, for the first time in 13 weeks. The amount is small, the signal is not, and for investors in Germany a decision between an ETN and a direct purchase hangs on it.
October 7, 2026 8:42 PM
Can XRP Price Reach $10? Here Is What the Math Says
XRP trades near $1.42 after losing $1.50. We check the $10 forecasts, the charts and the market cap math to see if XRP can really reach $10.
October 3, 2026 11:01 AM
XRP Price Prediction: Can XRP Hit $3 Soon If the Bull Market Returns?
XRP is stuck near $1.50 in a falling wedge. Our XRP price prediction maps the path to $2, $2.75 and $3 if the crypto bull market comes back.
September 29, 2026 7:20 PM

One Billion XRP Unlocks on October 1: The Level That Decides
XRP's next monthly escrow deadline expires on October 1, and up to one billion tokens can come free. What that means for the price at $1.52 and which levels to note down beforehand.
September 29, 2026 10:38 AM
Bitcoin Falls Toward $83,000 as Trump Rejects Iran Ceasefire Deal
Bitcoin slipped toward $83,000 after Trump rejected Iran's Hormuz proposal, sending oil above $100 and wiping out $478 million in crypto liquidations.
September 28, 2026 9:47 AM
XRP Price Drops Below $1.50: Where Is Ripple Heading This Week?
XRP price slips under $1.50 after a red weekend. Here is the XRP price analysis with the higher and lower targets that matter this week.
September 26, 2026 7:36 PM

XRP Price Prediction: Which Scenarios and Which Costs to Check Before the Quarter Ends
XRP trades at $1.55 on September 26, 2026, and on October 1 a release window opens covering up to 1 billion XRP. What the ETF inflows set against it, which levels count, and which costs really make an order more expensive.
September 22, 2026 5:54 PM
XRP Price Prediction: Breakout Puts $1.80 Back In Play
XRP just snapped its descending trendline and reclaimed $1.50 with RSI at 67. Here is what the daily chart says about the road to $1.80 and above.
September 21, 2026 11:44 AM
XRP Price Breaks Its Downtrend: Is $2 Finally In Sight?
XRP just snapped the trendline that capped it all September. Here is what the chart says about $1.50, $1.80 and the road to $2.
September 18, 2026 4:41 PM
Solana Price Prediction: Why SOL Is Setting Up for $120
Solana just tagged $110 and the 200 EMA is rising. Here is what the SOL chart says about $120 and what has to hold first.
September 18, 2026 11:39 AM
Ethereum Price Prediction: Why ETH Is Closing In on $3,000
Ethereum is coiling between $2,400 and $2,600 with a rising 200 EMA underneath. Here is what the ETH chart says about $3,000.
September 16, 2026 2:03 PM
XRP Price Crashes 9% as CLARITY Act Dies: How Low Can XRP Go?
XRP price crashed almost 9% after the Senate killed the CLARITY Act. Here is why XRP fell harder than Bitcoin, and the XRP price targets that matter now.
September 11, 2026 9:50 AM

XRP Price Crashes 6% in a Week: Buying Opportunity?
XRP price fell 6.45% this week to $1.35 and is now sitting on its 200 EMA. Here is what the chart says before the Senate vote on September 15.
September 6, 2026 11:19 AM
Bitcoin Price Today: BTC Holds Firm Before The Biggest Week Of The Month
Bitcoin sits near $80,000 after a jobs report killed a four-month high. CPI, the Fed and a Senate vote all land in the next ten days.
September 1, 2026 11:14 AM
XRP Price Falls 8% in a Week: Is This Dip Actually Worth Buying?
XRP gave back 8% this week after a violent August melt-up. Here is what really drove that rally, what the chart says now, and what buying here depends on.
August 30, 2026 1:32 PM
Bitcoin Price Correction: Why BTC Stalled Dead at $78,000 Again
Bitcoin corrected from $81,455 after a hawkish Fed. The chart shows the exact same rejection level as May. Here are the upside and downside targets.
More from CryptoTicker