
Ethereum Price Prediction: Why ETH Is Closing In on $3,000
Ethereum is coiling between $2,400 and $2,600 with a rising 200 EMA underneath. Here is what the ETH chart says about $3,000.





Which topics should we dive deeper into?
Select what genuinely interests you. Your picks feed directly into our editorial planning.
Crypto news that's actually worth your time.
Weekly. 60 seconds. Carefully curated by our editors: no hype, no promo flood, no spam.
Ethereum spent most of this year looking like the coin everybody had given up on. Then one candle in August changed the entire picture, and ETH has been quietly building a launchpad ever since. The $3,000 level is no longer a fantasy number. It is roughly 19% away, and the chart is doing exactly what it needs to do to get there.
Where Is the ETH Price Right Now?
$Ethereum is trading at $2,510 on the daily, up 2.65% on the session, after opening at $2,445 and tagging $2,518 intraday. The low of the day was $2,435, which is the important part, because that is the third time in a month buyers have shown up in that exact zone.
Step back and the year looks brutal. ETH ground sideways through April near $2,400, rolled over in May, and collapsed through June into a low around $1,550. That is a drawdown of more than 65% from the August 2025 all-time high near $4,946. July was a slow repair job above $1,600. August was a boring drift between $1,900 and $2,050.
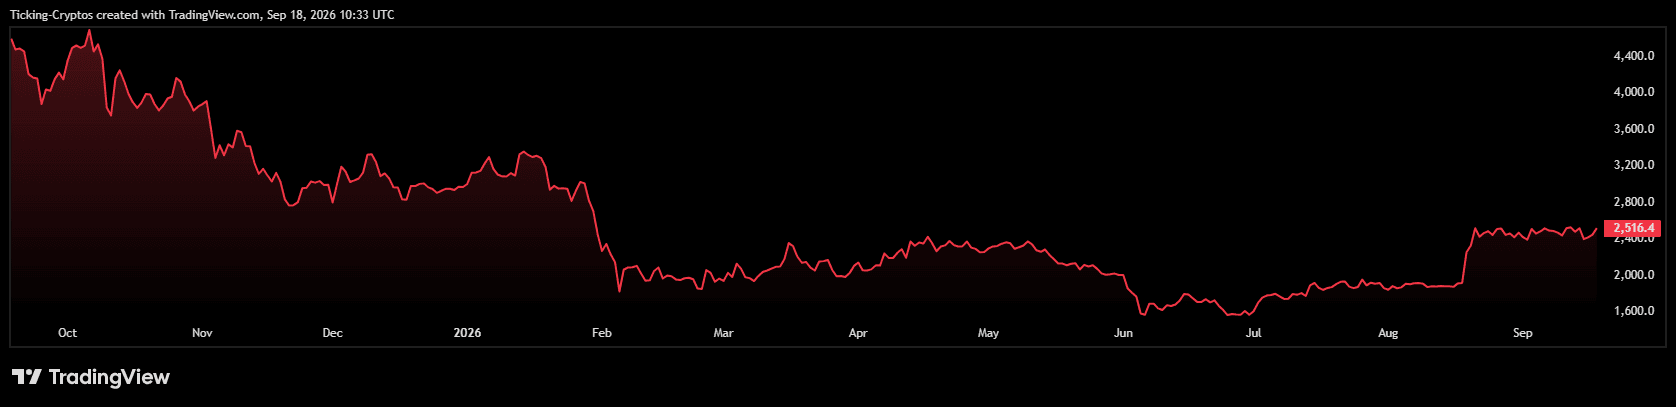
Then came the candle. In mid-August, Ethereum went vertical in a single daily session, ripping from roughly $1,950 through $2,000, through the 200 EMA, through $2,400, and closing near $2,500. That is a 28% expansion move in one bar, and it did not retrace. Everything since has been consolidation, not distribution.
What Does the ETH Chart Say About $3,000?
The structure right now is a textbook range. $2,400 is the floor. $2,600 is the ceiling. Ethereum has been locked between them for a full month, and neither side has broken.
That matters more than it sounds. When a market makes a violent vertical move and then goes sideways at the highs instead of giving the move back, it is usually absorbing supply rather than topping out. Sellers who wanted out at $2,400 have been getting filled for four weeks, and price has not cracked.
The measured move math is clean. The $1,600 to $2,000 base was 400 points wide, and the breakout above $2,000 projected $2,400. That target was hit almost exactly. The current $2,400 to $2,600 range is 200 points wide, so a clean daily close above $2,600 projects $2,800. From there, $3,000 is the next horizontal level on the chart, and it is the level that was acting as resistance through the entire first half of the year.
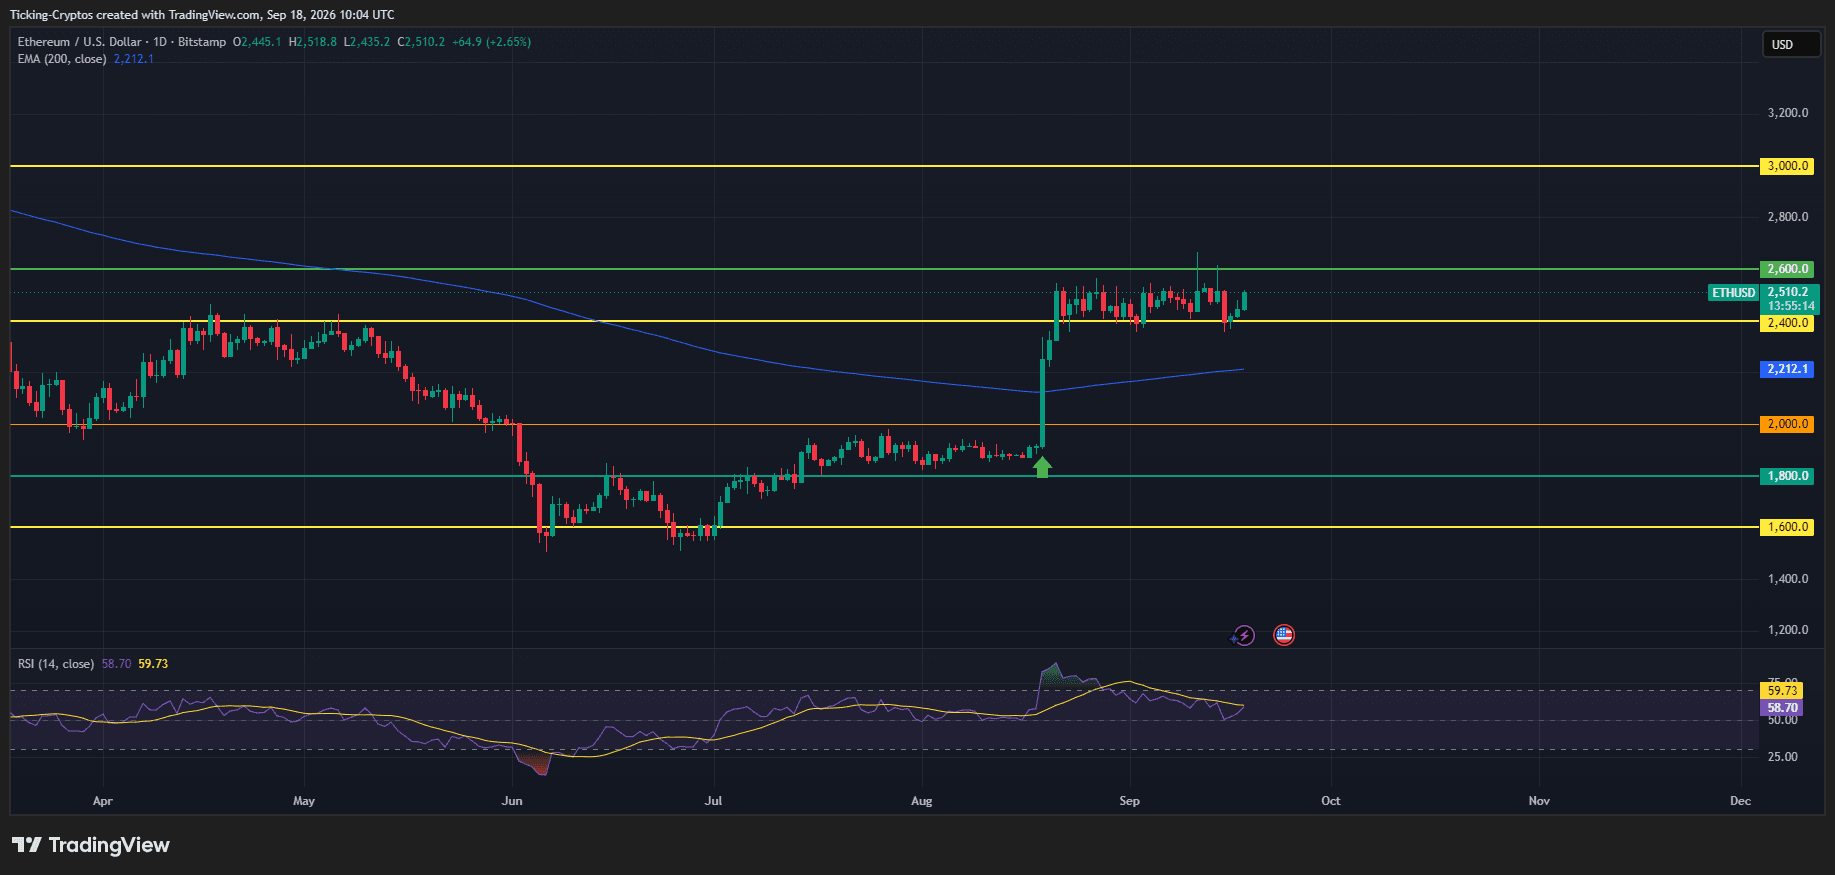
So the path is not a single leap. It is two steps: reclaim and hold $2,600, then run the gap to $2,800 where there is almost no historical resistance, then attack $3,000.
Is the 200 EMA Turning Bullish for Ethereum?
The 200-day EMA sits at $2,212. For eight straight months it pointed down, and every rally in spring and summer died against it. Ethereum is now trading roughly 13% above it, and more importantly, the line itself has flattened and hooked upward for the first time this year.
A rising 200 EMA underneath price is what separates a dead-cat bounce from a trend reversal. As long as ETH stays above it, the medium-term bias flips from bearish to constructive, and pullbacks become buyable instead of terrifying.
RSI backs this up without screaming. The 14-period reading is 59.73, sitting just above its own signal line at 58.70. That is the bullish half of the range with no overbought condition anywhere in sight. Ethereum can rally another 15% before RSI even starts flashing warnings, which is exactly the kind of fuel tank you want before a breakout attempt.
Are ETF Inflows Strong Enough to Push ETH to $3,000?
The chart is not moving in a vacuum. Institutional flow has flipped hard in Ethereum's favor.
US spot Ethereum ETFs pulled in roughly $1.75 billion to $1.85 billion in August 2026, their best month since August 2025, after more than $1 billion had left the funds in May and June. The week ending September 11 added another $197 million, a fourth consecutive positive week, while Bitcoin ETFs bled $463 million over the same stretch. A single session on September 11 brought in $216 million, the largest daily total of that week.
That divergence is the story. Money is not leaving crypto, it is rotating from Bitcoin into Ethereum, and the staking yield inside the newer ETH products is a large part of why. Ethereum spot ETFs now hold $16.31 billion in total net assets, around 5.28% of Ethereum's entire market capitalization.
One caveat worth being honest about: the buying is heavily concentrated, with BlackRock's ETHA accounting for roughly 72% of the inflow streak that began in mid-August. A trend carried by one issuer is a trend with a single point of failure.
 Compare the best crypto exchanges
The other catalyst is on the roadmap. The Glamsterdam upgrade has slipped to Q4 2026, with the Sepolia testnet fork scheduled for 28 September. A delayed catalyst is still a catalyst, and it lands right in the seasonal window where crypto tends to get interesting.
What Would Invalidate This Ethereum Price Prediction?
$2,400 is the line. It is the breakout level, it is the range floor, and it has now been defended three separate times. Bitfinex analysts also flagged the September 11 daily low near $2,432 as the level to watch on pullbacks.
A daily close below $2,400 kills the range and puts the $2,212 EMA directly in play. Lose that, and the August candle starts looking like a liquidity event rather than a trend change, with $2,000 the next real shelf underneath.
The bearish case is not just technical. ETF flows can stop as fast as they started, and the macro backdrop around Fed policy has been the single biggest driver of crypto beta all year.

 CryptoTicker trading game: try it free
Ethereum Price Prediction: How Soon Can ETH Hit $3,000?
Analyst targets are scattered across a wide band, which tells you the market genuinely does not know. CoinDCX puts September at a $2,800 target with a $2,405 to $2,950 range. LongForecast is far more aggressive, modelling a September close near $2,959 and October at $3,432. Messari's base case is $3,200 to $3,800 by December, with VanEck pointing to $4,500 if macro conditions improve. Prediction markets are more sober, giving roughly a 31% chance of a $3,500 touch before year end.
Strip out the noise and the chart gives a cleaner answer. Ethereum does not need a miracle to see $3,000. It needs one daily close above $2,600 with volume, and the structure opens up. Given the range has already compressed for four weeks with a rising 200 EMA underneath and RSI holding the bullish band, a breakout attempt in October is the base case, not the moonshot case.
Fail at $2,600 again and $ETH simply keeps grinding between $2,400 and $2,600 until something forces a decision. Ranges do not last forever.
Frequently asked questions about the Ethereum forecast
Related articles
- Ethereum Price Prediction: Can ETH Blast Toward $2,750 Next?
- Is an Ethereum Price Crash Imminent?
- Ethereum Price Analysis: ETH Consolidates Between $1,800 and $2,100, What’s Next?
- Ethereum Price Analysis: Key Levels Holding, Will ETH Crash or Bounce Toward $2,500?
- Ethereum Price Hit $2,600 Then Stalled: Here Is What Decides the Next Move
Which topics should we dive deeper into?
Select what genuinely interests you. Your picks feed directly into our editorial planning.
Crypto news that's actually worth your time.
Weekly. 60 seconds. Carefully curated by our editors: no hype, no promo flood, no spam.

September 18, 2026 4:41 PM

Solana Price Prediction: Why SOL Is Setting Up for $120
Solana just tagged $110 and the 200 EMA is rising. Here is what the SOL chart says about $120 and what has to hold first.
May 10, 2026 11:34 AM
XRP Price Prediction: Is XRP Ready to Hit $2 in 2026?
XRP is testing critical resistance at $1.45. Explore our XRP price prediction to see if institutional adoption and ETFs can drive the price to $2 in 2026.
June 12, 2024 2:17 PM

Ethereum (ETH) Price Prediction For BULLISH And BEARISH Scenarios
The latest analysis of Ethereum's price movements as of June 12, is divided between the 2 scenarios: bullish and bearish. But what drives each, and which is more likely to occur?
August 10, 2025 11:00 PM

Ethereum Price Prediction: Can the OKX Giveaway Boost ETH Price to a New ATH?
Ethereum trades above key support with bullish momentum. Could OKX’s latest giveaway help push ETH toward a new all-time high?
June 20, 2026 11:51 AM

Solana (SOL) Price Prediction: Can SOL Reclaim $76 and Target $90 — or Is $60 Back in Play?
Solana trades near $71 after bouncing off $60. We analyze the SOL/USD chart, key support and resistance, and the targets that matter next.
July 22, 2025 9:28 AM
XRP Price Prediction: Is Now the Right Time to Buy XRP After the Dip?
XRP price pulled back -2.6% in the last 24 hours following a sharp +22% weekly surge. Should you buy the dip or wait for a better entry?
November 17, 2025 8:55 PM

BREAKING: Ethereum Price Crashes Below $3,000 as Bitcoin Triggers Market Meltdown
Ethereum drops under $3,000 after Bitcoin’s fall below 92K. Chart signals deeper weakness as key support levels fail.
June 30, 2024 7:29 PM

DOGE Price Prediction for July 2024: What to Expect?
What lies ahead for DOGE in July 2024? Here is a brief analysis as we are about to end June and enter into July, along with predictions for DOGE's price movement and market trends.

March 8, 2026 10:06 AM

Ethereum Price Prediction: ETH Is Preparing for a Breakout From This Ascending Channel Formation
Ethereum trades near $1,960 inside an ascending channel formation. A breakout could push ETH toward $2,200 if key support holds.
August 2, 2024 10:32 PM

Ethereum Price Crash: What Next Support Levels For ETH Price Below $3K?
Ethereum fees just hit their lowest since late 2023, and now Ethereum price is trading near $3K with a high potential to drop below it... What's next?
May 16, 2026 2:22 PM

Ethereum Price Analysis as ETH risks Crashing below the $2,000 Support
Ethereum struggles to stay above key support levels. Technical charts and rising exchange inflows indicate that ETH could drop below $2,000 soon.
July 27, 2026 10:57 AM

Ethereum Price Analysis: ETH Rips 30%, Is $2,000 Next?
Ethereum just printed a 55-day high of $1,980 and is up 30% in 30 days. Here is what the 3H chart says about $2,000 and the targets beyond it.
August 29, 2026 10:30 AM
XRP Price Prediction: XRP Ripped From $1 To $1.66 In Three Days, Here Is Where It Goes Next
XRP exploded 66% off the $1 floor, then gave back a third of it. Here is the full chart breakdown and the XRP price targets that matter now.
March 26, 2025 7:01 PM

Can Dogecoin Price Hit $1 and Be the Surprise Winner of 2025?
DOGE price is climbing fast—could Dogecoin hit $1 in 2025? Here are the latest price analyses, bullish signals, and the key role of Elon Musk and X Payments in DOGE’s next moonshot.
August 8, 2025 1:20 PM

Ethereum Price Prediction: Can BlackRock’s $103M Buy Push ETH to $4,000?
Ethereum is trading just below $3,900 after BlackRock reportedly bought $103 million worth of ETH. Could this institutional move be the spark that sends ETH to $4,000?
May 20, 2024 12:08 PM

Ethereum (ETH) Up To $4000: Can ETH Break Out From The 3K Levels?
With 2 days until the SEC's decision on spot Ethereum ETFs, ETH price surges above the 3.1K and hints about new all-time-highs are on the horizon. Could ETH break out of the current levels and go back to around 4K as back in early March of this year?
April 11, 2026 12:41 PM

Ethereum Price Analysis: Is ETH Gearing Up for a $2,400 Breakout?
Ethereum shows bullish momentum as ETH price eyes the $2,400 resistance. Discover key support levels and technical indicators in our latest analysis.
September 26, 2026 1:02 PM

Ethereum Price Prediction: ETH Defends Key Support, Is $3,000 Next?
Ethereum is consolidating near $2,700 after a rejection at $2,800. Our Ethereum price prediction looks at what ETH needs for a run at $3,000.
February 18, 2026 6:53 AM

Ethereum Price Prediction: Will the $2,000 Support Hold or Is a Deeper Correction Looming?
Ethereum price struggles to maintain the $2,000 psychological level. Analyze the latest ETH coin news and price predictions for 2026 amid market consolidation.
September 4, 2026 11:32 AM

Ethereum Price Holds Above $2,500: One Level Is Still Blocking The Way
Ethereum trades at $2,517 after another rejection at the same ceiling. The jobs report lands in hours and decides which way this range breaks.
March 4, 2026 10:29 AM
Ethereum Price Reclaims Crucial Levels as Institutional Rotation Accelerates
Ethereum price shows bullish resilience as it battles key resistance at $2,100. Analysts weigh in on the impact of Harvard’s latest portfolio rotation into ETH.
December 10, 2024 12:30 AM

Bitcoin Price Drops Below $100K – Is a Bigger Crash Coming?
Bitcoin has fallen below $100K, triggering a broader market correction of over 8% in the last 24 hours. With profit-taking and large sell-offs hitting the market, could Bitcoin drop to $90K or lower?
June 25, 2024 6:26 PM

Solana Price Prediction: Will SOL Surpass 200$?
Why Solana, Shiba Inu, and Cardano are poised for a major rebound, according to the latest market analysis. Can Solana capitalize on the buy signals and reach a new price target?
August 10, 2024 6:02 PM

Ethereum Price Prediction: Amid Mixed Signals What To Expect For ETH Price?
Ethereum faces volatility and competition, but signs of bullish activity and whale accumulation suggest potential recovery. How does it compare to Solana, and what does the future hold for ETH?
June 28, 2024 12:25 PM

Solana News Today: Why is Solana Price up 10%?
Why is Solana's price up by 10%, despite the downtrend in the market? And what's behind the current optimism breaking key resistance levels?
May 27, 2025 11:59 AM

Ethereum Price Prediction: Will ETH Hit $3,000 in May and a New ATH in 2025?
Ethereum (ETH) is the most trending coin in May 2025. With Bitcoin cooling off, investors are now turning to ETH as their next opportunity. Potential breakout above $3,000 this month and a new all-time high before the year ends?

More from CryptoTicker