
Ethereum price prediction: the 200-day line is the level that decides
Analysis: Ethereum trades at $2,308 on Monday evening and falls for the fourth day in a row, below the 200-day average of $2,329 for the first time since August 20. Price, averages and the Fed date on Wednesday are documented; the editorial team's assessment stands separately in the text.


Which topics should we dive deeper into?
Select what genuinely interests you. Your picks feed directly into our editorial planning.
Crypto news that's actually worth your time.
Weekly. 60 seconds. Carefully curated by our editors: no hype, no promo flood, no spam.
Ethereum trades at around $2,308 on Monday evening and closes its fourth trading day in a row in the red. The price sits below the 200-day average of $2,329, and that is the real finding of the day: this line has carried every recovery of the current year.
Documented up to this point is the following: the price of $2,308, down 1.7 percent in 24 hours, the two moving averages from the chart further down, October's balance of minus 14.1 percent and the US Federal Reserve's rate decision on Wednesday. What the editorial team concludes from that for the coming days has a section of its own further down and is marked there as an assessment.
Where the price can point on a horizon of months is what our Ethereum forecast tracks continuously. This article takes today.
Where Ethereum stands on Monday evening
The day brought a narrow range. The high was $2,347 and the low $2,293, with 2.4 percent between the two. Ethereum's market capitalization comes to $282 billion, and trading turnover over the past 24 hours to $10.7 billion.
What decides, though, is not the single day but the run. Four daily closes in a row came in below the one before: $2,473 on October 22, then $2,386, $2,385 and $2,357, and today $2,306. Ethereum last traded that low on August 20, at $2,252 back then. The current month stands at minus 14.1 percent, counted from October 1 at $2,685. From the monthly high of $2,726 on October 5 it is minus 15.4 percent.
Bitcoin gave up less over the same period and stands at $79,776, down 0.9 percent in 24 hours. Ethereum is therefore losing faster than the market it was still leading in the summer.
What the 200-day line measures for Ethereum
The 200-day average is the mean of the daily closing prices of the past 200 days. It says nothing about what happens tomorrow. It says where the middle of the past nine months lies, and it shifts slowly, because each new day changes only a small part of the mean. That is exactly why traders watch it: it is a line many see at the same time and one that does not move with every daily swing.
For Ethereum that average sits at $2,329 today, the 50-day average at $2,457. The price is below both. That the short line runs above the long one also shows that the gap has opened only in recent weeks; in the summer the price was still well above them.
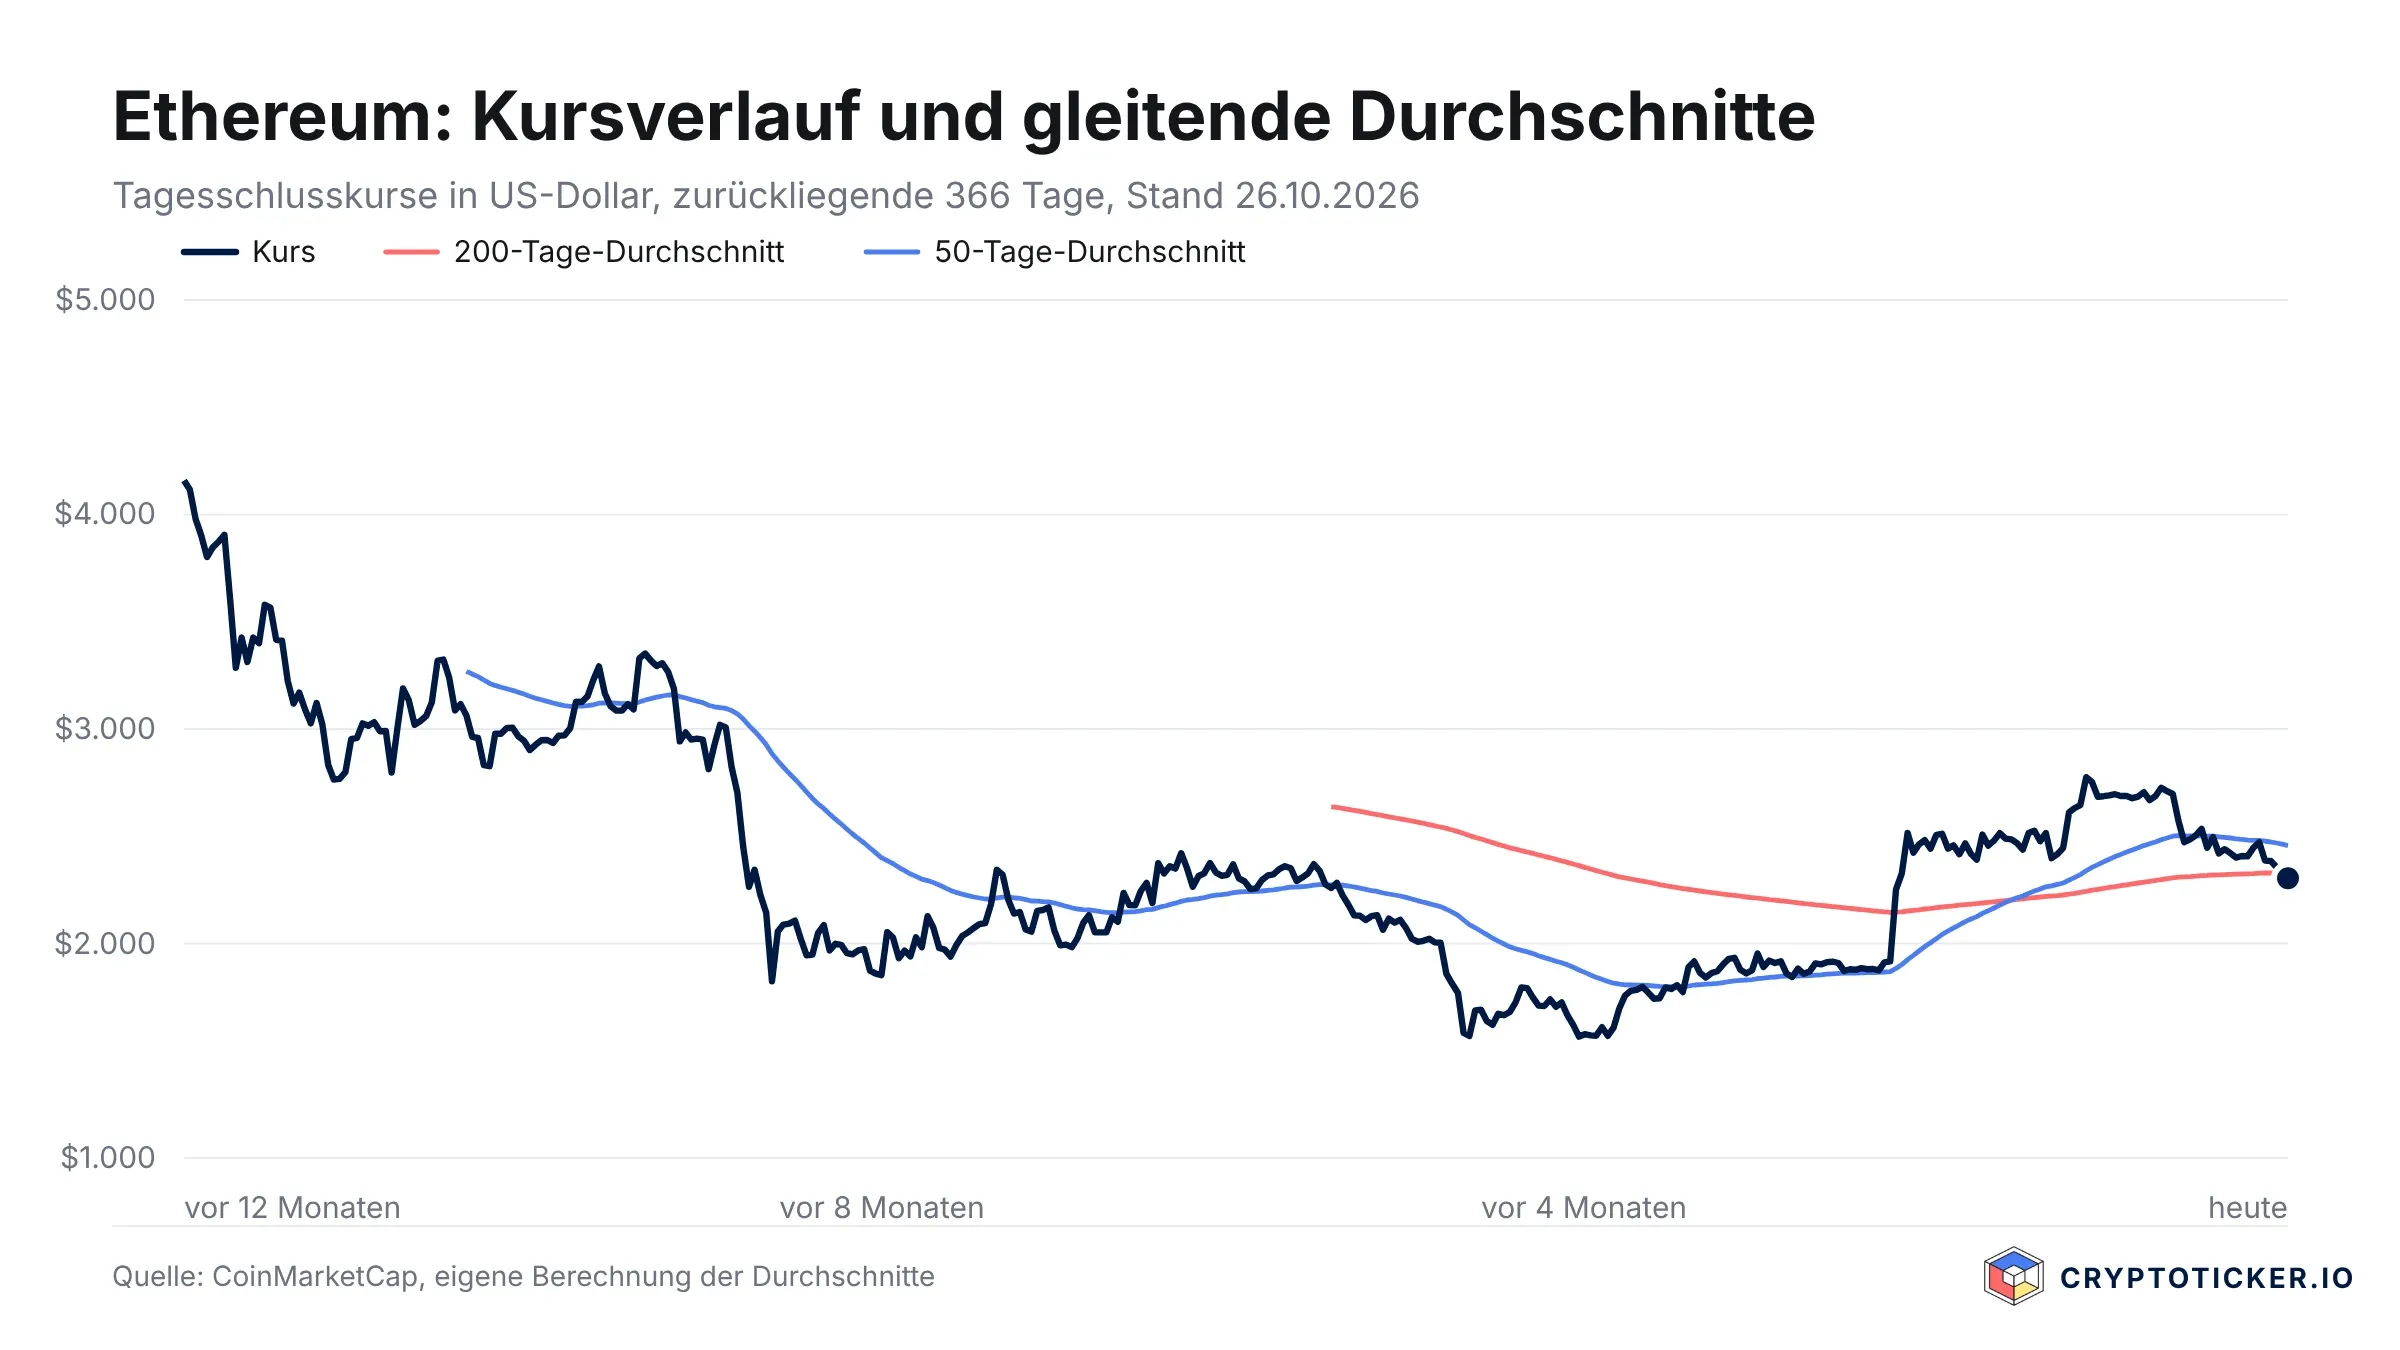
The chart also shows the year's span. The high was $4,159, the low $1,566 at the end of June. Measured from the high, Ethereum stands 44.5 percent lower, and 47 percent higher than the June low. Both figures belong together when placing today's level: the price is neither on the floor nor near its best mark.
Three reasons for the fourth day in the red
The first reason is the calendar. The US Federal Reserve meets on October 27 and 28, with the rate decision following on Wednesday evening. Ahead of such dates larger players take risk off, because the direction is open. That hits Ethereum harder than bitcoin, because the market there is thinner.
The second reason is the relative weakness against bitcoin. One ether currently costs 0.0289 bitcoin. As long as that ratio falls, capital is flowing away from Ethereum within the crypto market, and that works regardless of what the dollar price does.
The third reason is the line itself. When a closely watched level gives way, automatic sell orders sitting beneath it trigger. That amplifies a move which began for other reasons, and it explains why the slide of the past four days managed without a single large piece of news.
Buy or sell in this situation and you pay the spread between bid and ask along with it. On thin days it is wider than usual. A look at the crypto exchange comparison is therefore worth it right now, because fee structures differ markedly at small amounts.
 Compare the leading crypto exchanges now
The Fed decision on Wednesday and what it means for Ethereum
The meeting of the US Federal Reserve's open market committee runs on October 27 and 28, as set out in the Federal Reserve's meeting calendar. The connection to crypto runs through the interest rate: if it falls, money becomes cheaper, and assets without running income become relatively more attractive. If it stays higher than expected, the sum works out the other way.
For investors in Germany a second point matters here. Ethereum is traded in dollars, while your portfolio counts in euros. If the dollar falls after a rate decision, part of the dollar gain melts away in the conversion, and the other way round. This currency effect is no footnote: on a price move of a few percent it can account for half the result.
Ethereum measured against bitcoin
The ratio of ether to bitcoin is the figure that shows the direction within the crypto market. At 0.0289 bitcoin per ether it sits close to the lower edge of recent weeks. If you hold Ethereum because you are convinced by the blockchain and its applications, you take that number as a cost item: choosing Ethereum over bitcoin has cost money this month.
That is a different view from the one on the dollar price, and it leads to a different question. Counting in dollars, you ask whether the market as a whole turns. Counting in the ratio, you ask whether Ethereum converts its lead in applications back into price. Both questions share the same date on Wednesday, but not the same answer.

The one-year deadline on October 27 and loss offsetting
Here a date comes into play that has nothing to do with the chart and can still matter more for German investors. On October 27, 2025 Ethereum stood at $4,159, the high of the past twelve months. Anyone who bought on that day reaches the one-year deadline under Section 23 of the Income Tax Act tomorrow, while sitting on a loss of 44.5 percent.
On a gain the sum is simple: after a year of holding, the gain from a private disposal is tax-free. On a loss the logic turns around. Sell within the year and the loss counts for tax, and you can offset it against gains from other private disposals in the same year. Sell after the year has elapsed and the loss is irrelevant for tax, because a transaction outside the period is not taxable at all.
In concrete terms: if you hold Ethereum at a loss, stand shortly before the one-year deadline and have realized gains from other crypto sales this year, you have room to act before the deadline and none after it. If you are in profit, by contrast, selling before the deadline costs you the tax exemption. Which purchase date belongs to which position is shown by a clean record of your acquisitions; the tools for that are in the comparison of crypto tax tools.
Whether the one-year deadline stays in this form is politically open. Our page on the crypto holding period and its reform tracks the state of the debate and the deadlines that currently apply. For this year the one-year period applies unchanged, and the threshold for private disposal gains is 1,000 euros.
Why the purchase date decides and not the price level
The tax question hangs on the purchase date. Two investors with the same loss can therefore reach different outcomes if one bought in September 2025 and the other in February 2026. That is why a losing position is not one uniform case but as many cases as there are acquisitions.
 Find the right crypto tax tool for your records
The frame below and above
Below, the next justified level is the August 20 reading at $2,252. That is where the price sat the last time Ethereum traded this low, and the late-summer recovery began from there. Should that area not hold, the next orientation lies considerably lower, because between $2,252 and the June low of $1,566 the price has spent barely any time this year.
Above, two values matter, and both are in the chart. The 200-day average at $2,329 is only 1 percent away; reclaiming it would be a first sign, no more. It becomes solid only at the 50-day average of $2,457, because that is the area the past week's slide started from.
What has changed since Sunday's Ethereum article
On Sunday the gas fee was at the centre here. The analysis of 9.7 ETH burned in 24 hours dealt with how little ether the blockchain takes out of circulation when usage is thin. The price stood at $2,357 at the daily close of October 25.
Two things have come on top since. First, the price has given up a further 2.1 percent and thereby undercut the 200-day line, which still held on Sunday. Second, the Fed date has turned from next week's news into this week's news. The gas fee itself has not turned; Sunday's thin usage remains the backdrop against which the price is falling.
The editorial team's assessment
Our assessment: the break of the 200-day line is a weak signal so far, not a strong one. In favour of that reading is the gap of only 1 percent, the narrow daily range of 2.4 percent and bitcoin's loss of 0.9 percent, which shows that no market-wide sell-off is under way here. Against it stand the run of four days in the red and the falling ratio of 0.0289 bitcoin per ether, both signs that capital is not coming back just now.
This is decided on Wednesday, and not by the chart. A rate decision that calms the market turns the break into a four-day episode. If the rate stays higher than expected, the area around $2,252 gets tested this week. Predicting a direction without knowing the decision would be guesswork, and guessed numbers do not appear in this article.
Ethereum: the trend only turns above $2,457
Three steps make sense this week, and they do not depend on where the price runs.
- Check in your records which Ethereum acquisitions are at a loss and when their one-year deadline expires. A loss can be used for tax only on acquisitions inside the period; the tools for that are in the comparison of crypto tax tools.
- Compare your platform's fees and trading spread before you trade again ahead of Wednesday. On thin days the spread costs more than the order fee, and the differences are in the crypto exchange comparison.
- If you want to hold Ethereum for longer, check where the holdings sit. For amounts you do not want to touch beyond Wednesday, self-custody is the calmer solution; the devices are in the hardware wallet comparison.
(As of October 26, 2026. This article is not investment advice. Prices and fee structures change; check the terms with the provider before you buy.)
Frequently asked questions about Ethereum
Partner links: some links on this page are partner links. If you become a customer through one of them, we may earn a commission at no extra cost to you. Selection, ratings and ranking are decided independently by our editorial team. Ethics and Independence · Ownership and Funding
Transparency note: This article was produced with the assistance of artificial intelligence and reviewed by our editorial team before publication. All figures and claims were checked against the primary sources linked in the text. The feature image was generated with AI.
For later? Save this article and find it again in your profile.
More on Ethereum: All Ethereum news at a glance
Related articles
- Bitcoin price prediction: Mayer Multiple drops to 0.88, 11 percent below the 200-day line
- Ethereum Price Crashes Below $2,000: How Low Can ETH Go?
- Bitcoin price falls below $72,000: the reasons behind the drop
- Ethereum price prediction: can buyers hold $2,000 as ETF outflows shrink 99 percent?
- Bitcoin price prediction: lowest level since August, will the $72,000 zone hold?
Which topics should we dive deeper into?
Select what genuinely interests you. Your picks feed directly into our editorial planning.
Crypto news that's actually worth your time.
Weekly. 60 seconds. Carefully curated by our editors: no hype, no promo flood, no spam.

November 10, 2026 3:16 PM

US inflation runs hot: Bitcoin at $73,600 with stops in focus before December 9
Analysis: US consumer prices rose 0.4 percent in October, more than expected, and a Fed rate hike on December 9 now looks certain. Bitcoin slips to around $73,600 and trades just above its 200-day moving average.

November 9, 2026 3:15 PM

Solana price prediction: OKX open interest up 24 percent as SOL breaks below its 200-day average
Analysis: OKX traders hold 24 percent more SOL in open contracts than two weeks ago, even though the price has fallen to $87. What that leverage means for the $85 level, and how leveraged gains are taxed in Germany.
November 9, 2026 11:17 AM

Bitcoin slips below Strategy's $75,451 cost basis as Saylor's 849,327 BTC go underwater
Analysis: Bitcoin trades at around $74,030 on Monday, below the $75,451 average price at which Strategy bought its 849,327 BTC. What the SEC filing reveals about the purchases, which levels matter now and how Bitcoin and Strategy shares are taxed in Germany.
November 8, 2026 3:12 PM

Solana staking yields 5.2 percent while SOL has lost 19 percent in 30 days
Analysis: Staking SOL currently earns around 5.2 percent a year, but the price has lost 19.2 percent in 30 days. Since October 9, holders have also pulled 4.8 million SOL out of staking, while the price is clinging to the 200-day line at $89 on Sunday.
November 7, 2026 3:15 PM

Solana Price Prediction: China's Central Bank Targets the Shanghai Campaign. What Now for SOL?
Analysis: China's central bank has classified the Solana promotion in Shanghai as illegal financial activity and is investigating the firms that helped run the tour. SOL holds its 200-day line at $89.98 on Saturday, but the Solana blockchain now carries $1.6 billion less in stablecoins than 30 days ago.
November 7, 2026 9:13 AM

Dogecoin Price at $0.072 in a Death Cross: When Will DOGE Rise Again?
Since October 29, Dogecoin's 50-day moving average has been below its 200-day line. Our analysis shows why the signal comes late, which levels at $0.0760 and $0.0690 matter, and what November 2025 buyers in Germany should know before their holding period ends.
November 6, 2026 9:19 PM

Bitcoin price prediction: $430 million outflow pushes the 2026 ETF balance below zero
Analysis: US bitcoin ETFs lost $869.8 million in four trading days, and the balance for 2026 is back below zero. What the outflows reveal about the price at $75,800, which levels count until the end of November and what investors in Germany can make of it.

November 6, 2026 7:17 PM

Ethereum price prediction: 986,847 ETH queue to stake while only 4,320 ETH wait to exit
Close to one million ether is waiting to enter staking, while only 4,320 ETH want out. What that ratio says about ether at $2,229, which levels matter until the end of November and what stakers in Germany need to know about tax.
November 6, 2026 3:25 PM

Solana Price Prediction: Only $1.2 Million in ETF Outflows, Even Though Holders Are Under Water
Analysis: Solana fell 6.5 percent on Thursday, yet only $1.18 million left the US spot ETFs. Investors have paid in $1.467 billion since launch, while the funds' holdings are now worth $1.333 billion.
November 6, 2026 3:16 PM

Ethereum Price After the Jobs Report: 165,000 New US Jobs Sharpen Fears of a Fed Hike
Analysis: US payrolls grew by 165,000 in October, more than twice the forecast, and futures now put the odds of a Fed rate hike in December at around 80 percent. Ether sits at $2,236, its lowest level since August, as the 200-day line at $2,157 draws closer.
November 6, 2026 5:22 AM

Bitcoin price at $75,700: BTC trades below its 100-day line ahead of the US jobs report
Context: Bitcoin starts Friday at $75,692, a good $5,000 below Thursday's high and under its 100-day line. The US jobs report for October follows at 2:30 p.m. German time, and it will decide whether the 200-day line at $73,200 becomes the next target.
November 6, 2026 3:12 AM

Ethereum Price Falls 7.9 Percent to $2,237 After Seven Days of ETF Outflows
Analysis: Ether lost 7.9 percent in 24 hours to around $2,237 and fell harder than Bitcoin after a chip sell-off on the Nasdaq wiped out leveraged positions. The role of ETF outflows, the levels that matter now and what investors in Germany should consider on tax and buying.
November 6, 2026 1:27 AM

Is Aerodrome Finance a Good Buy at Current Prices?
Aerodrome Finance has lost about a third since mid-October and is now testing its 200-day average. Whether AERO is a good buy at current prices comes down to a few key levels.
November 6, 2026 1:17 AM

Chainlink Price Falls 7.6 Percent as Long Bets Grow: Will $10.26 Support Hold?
Chainlink lost 7.6 percent on November 5, falling to $10.69 as the Nasdaq sell-off dragged crypto lower. Yet on OKX the number of long accounts rose to as many as 2.59 per short account, and the 200-day line at $10.06 is moving closer.
November 5, 2026 7:14 PM

Solana Price Prediction: SOL Sits on Its 200-Day Line as DEX Volume Hits $2.39 Billion
Solana trades at $89.19 on Thursday evening, right on its 200-day moving average at $88.93. Volume on decentralised exchanges on the Solana blockchain rose 26.8 percent on the same day, while network fees are 40 percent below the previous month.
November 5, 2026 1:09 PM

Cardano Price Prediction: Down 26.5 Percent in 30 Days, the Levels ADA Must Hold Now
Cardano lost 26.5 percent in 30 days, four times as much as Bitcoin. Now the 20-day and 200-day averages sit almost at the same price right above the market. Why this zone decides and which scenarios follow for ADA.
November 5, 2026 12:07 PM

Ethereum Price Prediction: 77,441 Puts for November 13, Then the Options Market Flips
Ether just gained 5.5 percent, yet the options market is split: for November 13 there are three times as many puts as calls, for November 27 twice as many calls as puts. What that means and which levels count now.
November 4, 2026 3:15 PM

Solana price prediction: SOL tests the 200-day line at $88.88 ahead of Breakpoint London
Analysis: eleven days before the Breakpoint conference in London, Solana fell to $89.77, almost touching its 200-day moving average. Our review of the last three conferences shows how strongly the price moved before and after.
November 2, 2026 7:13 PM

Solana price prediction: 1,000 days without an outage, will the 200-day line at $89 hold?
Analysis: the Solana blockchain has run without a halt since February 6, 2024, and on November 2 the streak reaches exactly 1,000 days. The price still falls to $92.78, its lowest since August; we show which levels matter now and why technology alone does not carry the price.
October 29, 2026 9:33 AM

Bitcoin Cash falls below $286: the 200-day line that decides the trend
Bitcoin Cash loses almost 6 percent to $279.87 and slips below its 200-day line at $286.19. The trigger is the Fed rate pause of October 28, at which two members even voted for an increase.
October 28, 2026 9:27 PM

Ethereum staking at 2.63 percent: what investors need to know
Analysis: the Fed left the policy rate at 3.75 to 4.00 percent on Wednesday evening, and two members even wanted a hike. For Ether this decision counts for more than it does for Bitcoin, because the staking yield of 2.63 percent competes directly against the money-market rate.
October 26, 2026 6:30 AM

Bitcoin at $79,978: what to watch at the lowest level since September
Analysis: Bitcoin slipped to $79,332 overnight into Monday, its lowest level since September 18. Wednesday's Fed decision, Thursday's mining adjustment and the German one-year holding period will decide what the setback means for you.
October 25, 2026 6:19 AM

Bitcoin Price $80,853: The Fed Statement Comes at 7 p.m. German Time This Week
Germany moved its clocks to winter time last night, the United States does not follow until November 1. For one week every US date shifts forward by an hour, and this is the week that carries the rate decision on Wednesday and the options expiry on Friday.
October 23, 2026 10:23 AM

XRP price prediction: the 100-day average crosses the 200-day average, 6.05 billion XRP move onto exchanges: what matters now
Our reading: on October 21 XRP's 100-day moving average rose above its 200-day average, the first time in our measurable series since May 11. Over the same stretch exchanges took in 6.05 billion XRP, and the two numbers point in different directions.
October 21, 2026 7:19 AM

ETF inflows of $526.7 million meet a Bitcoin price of $82,708: the levels that decide before the Fed meeting
Bitcoin costs $82,708 on Wednesday morning after $526.7 million flowed into the US spot ETFs on Monday. October still leaves those funds in the red, and two moving averages frame the market until the Fed meets on October 28.


More from CryptoTicker