
Bitcoin price prediction: $430 million outflow pushes the 2026 ETF balance below zero
Analysis: US bitcoin ETFs lost $869.8 million in four trading days, and the balance for 2026 is back below zero. What the outflows reveal about the price at $75,800, which levels count until the end of November and what investors in Germany can make of it.


Which topics should we dive deeper into?
Select what genuinely interests you. Your picks feed directly into our editorial planning.
Crypto news that's actually worth your time.
Weekly. 60 seconds. Carefully curated by our editors: no hype, no promo flood, no spam.
US bitcoin ETFs are back in the red for 2026. On Thursday investors pulled $430.2 million from the spot funds, bringing outflows since Monday to $869.8 million, according to the TFTC ETF tracker, which is based on SoSoValue data. Bitcoin traded at around $75,800 on Friday evening, 0.4 percent below the previous day and just over 9 percent below its level a month ago. What is established: the funds are selling, and the price sits between two important moving averages. Our assessment follows further down: the outflows are more a consequence than a cause of the weakness, but they are no all-clear either.
For the coming weeks this means bitcoin needs new buyers, and the fund business is not supplying them right now. Our Bitcoin price prediction sets out where the price range lies over a horizon of months. This article is about the short term, meaning the levels that will decide by the end of November whether the pullback continues.
Bitcoin ETFs: four trading days, $869.8 million in outflows
The week began with a heavy loss. On Monday, November 2, the spot funds lost a combined $398.6 million. That was driven entirely by BlackRock's iShares Bitcoin Trust (IBIT), with $405.3 million in outflows, partly offset by a small inflow at Fidelity. Tuesday added a further $115.6 million in outflows. Wednesday brought the only countermove, with $74.6 million in inflows; that day bitcoin closed at $80,052, according to the tracker's reference price. Thursday followed with $430.2 million, the largest daily outflow of the week, and the reference price fell to $76,101.
A spot ETF holds actual bitcoin. When investors withdraw money, the fund redeems shares and reduces its holdings; the coins released reach the market through the fund's trading partners. Converted at the reference price, around 5,650 BTC left the funds on Thursday alone. For comparison: since the halving in April 2024, mining produces 3.125 BTC per block, which at around 144 blocks a day amounts to about 450 new bitcoin. Thursday's outflow therefore equals a little more than twelve days of new supply.
Total assets in US bitcoin ETFs stood at $96.65 billion on November 5. At the end of 2025 the figure was still $113.29 billion, according to SoSoValue. The decline has two overlapping causes: the lower bitcoin price and the outflows themselves.
Fidelity rather than BlackRock: who sold on November 5
On Thursday the picture shifted. The largest single outflow came not from BlackRock but from the Fidelity Wise Origin Bitcoin Fund (FBTC), at $199.9 million. IBIT lost $105.0 million, the Grayscale Bitcoin Trust (GBTC) $49.9 million, Franklin (EZBC) $32.9 million, VanEck (HODL) $23.6 million and ARK 21Shares (ARKB) $18.9 million. No fund reported an inflow that day.
Across the four days, IBIT accounts for almost the entire outflow, at $806.5 million. Fidelity, by contrast, has been $50.3 million in positive territory since Monday, because the fund collected $236.7 million on Wednesday. Bitwise (BITB) recorded $37.1 million in inflows. This distribution argues against an orderly retreat by a single group of investors. More likely, large holders are turning their positions on a daily basis, depending on how technology stocks on the Nasdaq perform.
That fits the backdrop. On Thursday the Nasdaq slid after a sell-off in chip and AI stocks, and bitcoin fell with it. According to CoinDesk, the cryptocurrency reclaimed the $76,000 mark on Friday, even though the funds had lost $430 million the day before.
ETF balance for 2026: from a surplus in October back below zero
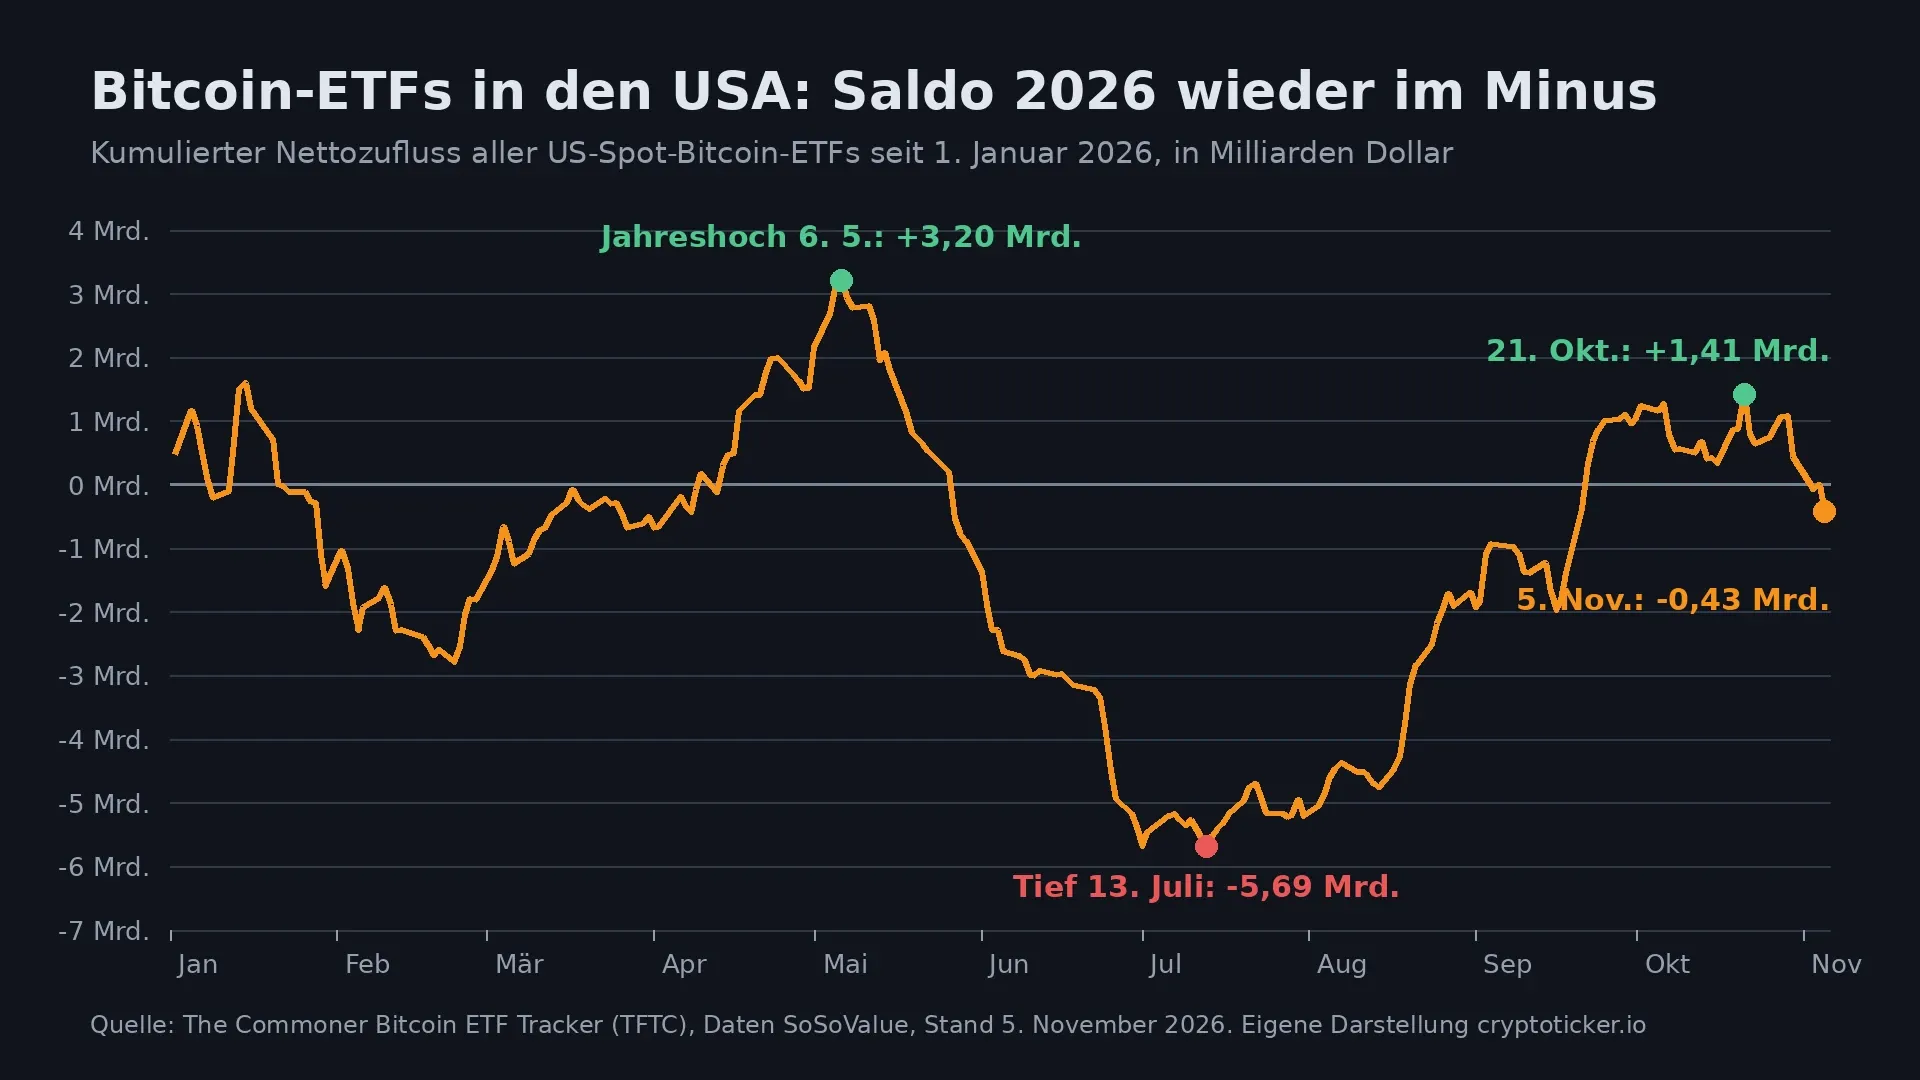
Adding up all daily flows since January 1, US bitcoin ETFs are now in negative territory. The TFTC tracker puts the figure at minus $431 million, while the SoSoValue analysis cited by BeInCrypto puts it at minus $502 million. The range arises because the two sources record individual days slightly differently. The direction is the same in both data series.
The course of the year shows how quickly the balance can turn. In early May there was a surplus of $3.20 billion, followed by a slump to minus $5.69 billion by July 13. With the recovery in August and September, the funds climbed back above zero at the end of September, and on October 21 the balance stood at plus $1.41 billion. October ended with $515 million in outflows, and the first week of November has used up the rest.
Compared with previous years: net inflows into the funds totalled $35.2 billion in 2024 and $21.4 billion in 2025. For the 2026 balance to end in positive territory, the remaining eight weeks would need more than half a billion dollars of inflows.
 Compare exchanges for your bitcoin purchase
Bitcoin since the options expiry: from $80,000 to $75,800
On Thursday morning our prediction on the options expiry described the situation ahead of Friday's deadline. Bitcoin had closed at just over $80,400 on Wednesday and was still trading around $80,000. Since then, three things have changed. First, the zone around $80,000 has broken; Thursday's daily high of around $80,800 was the last time the price traded above that mark. Second, the price has fallen below the 100-day moving average, which on Wednesday was still clearly beneath it. Third, the expiry is over, so the derivatives market is no longer holding back the price through open positions on Friday. New are Thursday's ETF outflows, which had not yet been published that morning.
All told, bitcoin has lost just over 5 percent since the last prediction article. Friday's daily low on the Kraken exchange was $74,790, and the rebound carried the price back to $75,800 by the evening.
Bitcoin between the 100-day and 200-day moving averages: the levels at $76,943 and $73,192
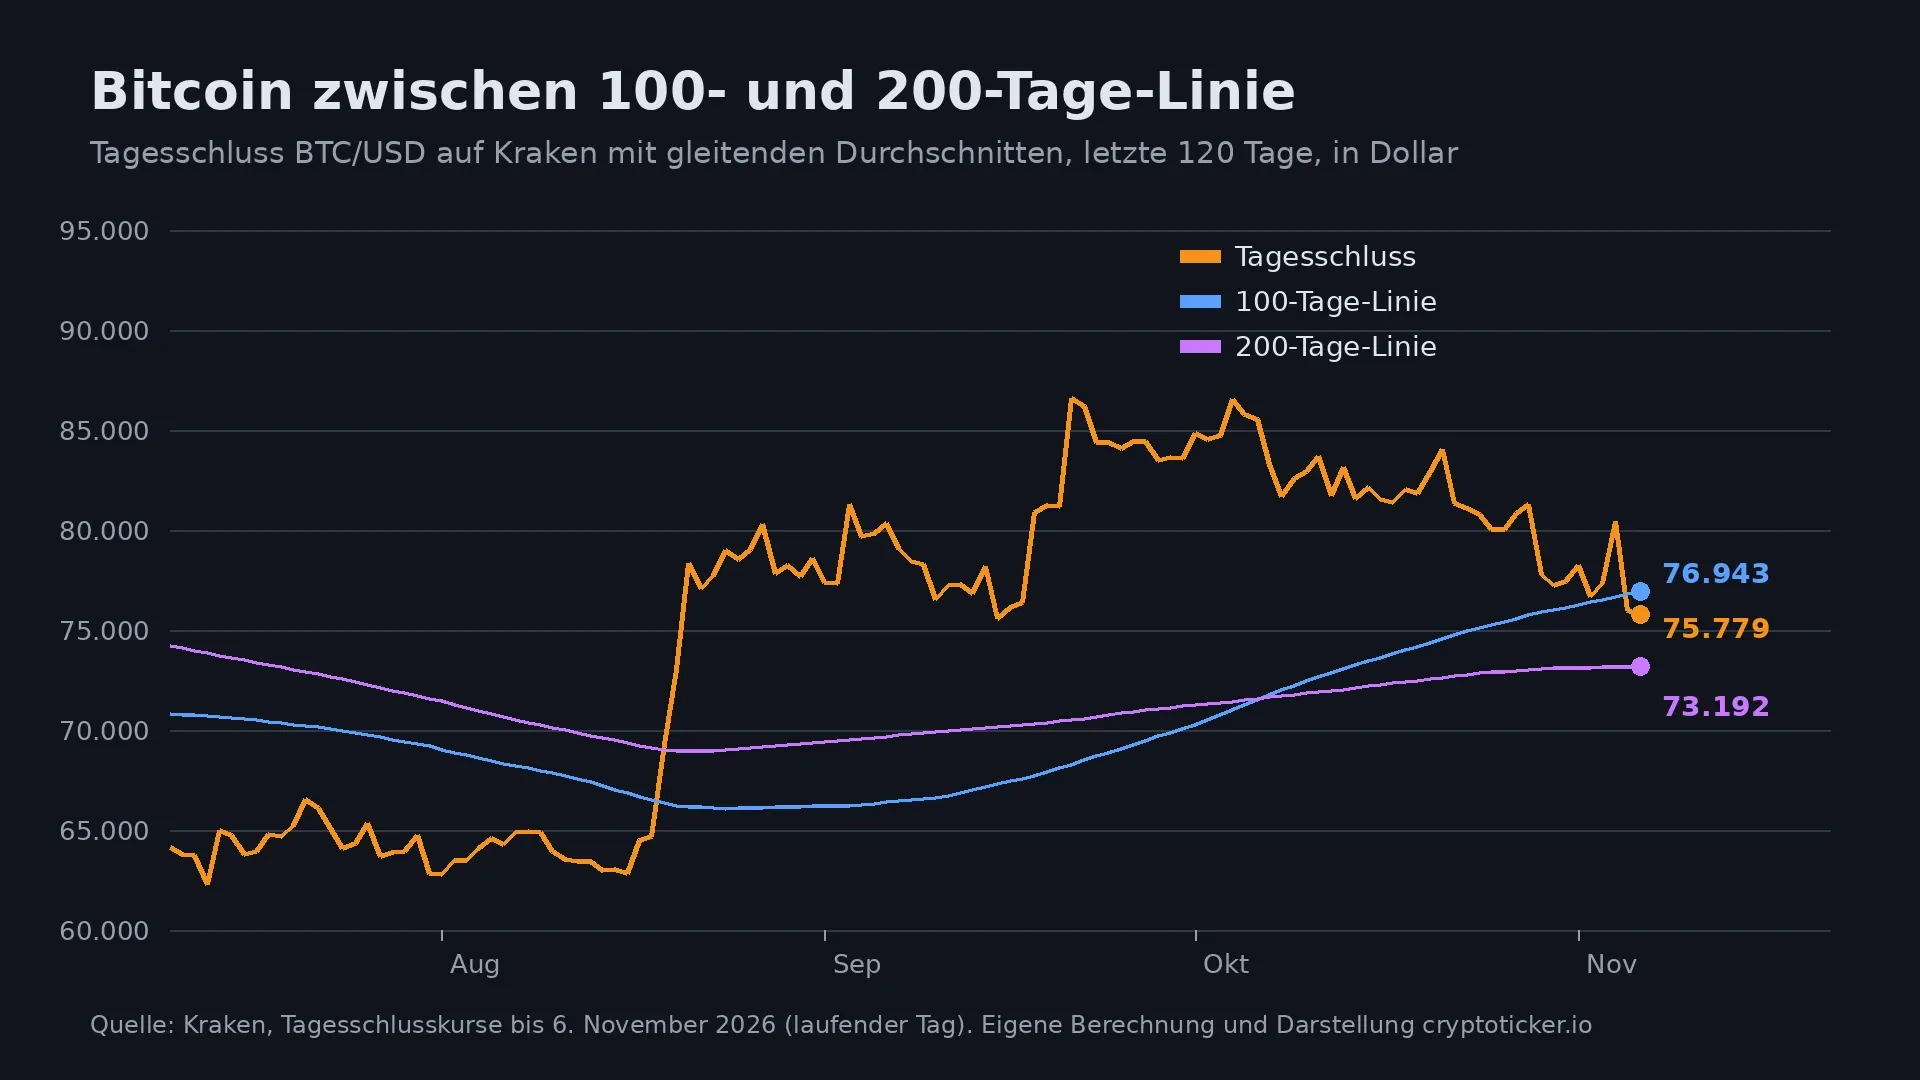
A moving average is the mean of closing prices over a fixed number of days. The line smooths out swings and shows whether the price is trading above or below its own trend. Based on Kraken's daily closing prices, the 100-day moving average stands at $76,943 on Friday and the 200-day moving average at $73,192. The 50-day moving average runs considerably higher, at $81,989.
Bitcoin is thus in a corridor of around $3,750 between the two longer averages. The 100-day line has turned into a hurdle from below. As long as there is no daily close above it, it acts as the first resistance. The 200-day line is the level against which long-term investors measure the underlying direction. Bitcoin only rose above it in August and has not fallen below it since.
Below the 200-day line comes the August 21 low at around $73,000. Below that begins the summer range, in which bitcoin swung between $62,500 and $66,500 until mid-August. On the upside, the next level is $80,000, where the price last closed on Wednesday.
 Find a tax tool for your bitcoin sales
Sentiment at 28 points: the Fear and Greed Index slips into fear
The Fear and Greed Index from alternative.me combines volatility, trading volume, social media sentiment and bitcoin dominance into a value between 0 and 100. On Friday it stands at 28 points, in the "fear" zone. On Thursday it was still at 50, or neutral. A move of 22 points in one day shows how strongly the sell-off on the Nasdaq has hit sentiment in the crypto market.
A low reading is not a buy signal. It only shows that many market participants have turned cautious. Historically, lows often fell in periods of great fear, but not every period of fear marked a low.
Scenarios to the end of November: recovery or a test of the 200-day line
Two paths for the coming three weeks can be derived from these levels.
Recovery: a daily close above $76,943
If bitcoin manages a daily close above the 100-day moving average and ETF flows turn positive on several days, the way back to the zone around $80,000 opens up. That is where Wednesday's close was, and where the price broke down on Thursday. A breakout above it would fully reverse this week's slide. The precondition is calmer technology markets, as bitcoin moved closely with the Nasdaq this week.
Setback: a daily close below $74,790
If bitcoin falls below Friday's low of $74,790, the 200-day moving average at $73,192 comes into focus. A daily close below it would be the first since August and would call the late-summer recovery into question. If further ETF outflows of several hundred million dollars a day persist, this scenario becomes more likely, because bitcoin from the funds would then flow into the market on a regular basis.
We are not naming a price target. Both scenarios depend on conditions that can be checked daily: the daily close relative to the two averages, and the ETF flows that the tracker adds after the US market close.
ETF outflows and price: the flows follow the price
Our assessment: this week's outflows are mainly a reaction to falling prices and weak technology stocks, not an independent trigger. Three observations from the data support this. On the only inflow day, Wednesday, bitcoin rose above $80,000. The large outflows came on Monday and Thursday, both days with a marked price decline. And the funds are taking turns: Fidelity collected money on Wednesday that flowed out again on Thursday.
Against this, the annual balance is tipping over again despite the late-summer recovery. Anyone who bought in via ETFs in October is now under water at today's price and could sell if weakness continues. That can amplify the move. We therefore regard the situation as tense, but not as a break in the trend, as long as the 200-day line holds.
US ETFs from Germany: the routes investors actually have
Retail investors in Germany generally cannot buy US spot funds such as IBIT or FBTC. They lack the key information document required under EU law, so banks and brokers block the purchase. Anyone who wants to hold bitcoin through a security turns to exchange-traded products such as ETNs, which are listed on Xetra or other German trading venues. Many of them are backed by bitcoin. Our guide to crypto ETFs in Germany gives an overview of products and costs.
The second option is buying directly through a crypto exchange or a broker licensed under MiCA, the EU regulation for crypto-assets. There the bitcoin belongs to you, and you can transfer it to your own wallet. The crypto exchange comparison shows which platforms are licensed in Germany and what they cost.
Holding period and ETN: the tax difference when selling at a loss
For investors in Germany, tax is what matters most in a weak market. Bitcoin held directly falls under private disposal transactions under Section 23 of the German Income Tax Act. If you sell after holding for more than a year, the gain is tax-free. Within that period, an exemption limit of 1,000 euros a year applies. Our overview of the crypto holding period summarises where the debated reform of the holding period stands.
When selling at a loss, timing is decisive. A loss within the one-year period can be offset against gains from other private disposal transactions. Once the period has expired, it has no tax effect. Anyone who bought in October 2025 near the all-time high of $126,080 is now around 40 percent down and has already passed the one-year mark. A sale would realise the loss, but it would no longer bring any tax benefit.
With ETNs, banks generally treat gains as capital income and withhold the 25 percent flat-rate withholding tax plus the solidarity surcharge directly. According to common practice, the one-year period does not apply there, and losses go into the bank's loss offset pot. Which route is cheaper depends on your holding period and your tax rate.
Bitcoin at $75,800: below $74,790, a test of $73,192 looms
- Set your levels: Note the 100-day moving average at $76,943 and Friday's low at $74,790. A limit or stop order at one of these levels takes the decision out of the hectic moment. Exchanges with low order fees are listed in the exchange comparison.
- Check your purchase dates: Go through your purchases by date and mark which bitcoin have been in your holdings for more than a year. Only then will you know whether a sale remains tax-free or produces a loss you can offset. The crypto tax tools help with this.
- Choose your route: Decide whether you want to hold bitcoin directly or through an ETN, and compare the running costs. Our comparison of crypto brokers shows the offers for the securities route.
(As of November 6, 2026. This article is not investment advice. Prices and fee structures change; check the terms with the provider before you buy.)
Frequently asked questions about the Bitcoin price prediction and ETF outflows
Transparency note: This article was produced with the assistance of artificial intelligence and reviewed by our editorial team before publication. All figures and claims were checked against the primary sources linked in the text. The feature image was generated with AI.
More on Bitcoin: All Bitcoin news at a glance
Related articles
- Solana price prediction: SOL tests the 200-day line at $88.88 ahead of Breakpoint London
- Bitcoin price prediction: $295 above the 100-day line, the level that decides
- Solana Price Prediction: Only $1.2 Million in ETF Outflows, Even Though Holders Are Under Water
- Is Aerodrome Finance a Good Buy at Current Prices?
- Solana price prediction: 1,000 days without an outage, will the 200-day line at $89 hold?
Which topics should we dive deeper into?
Select what genuinely interests you. Your picks feed directly into our editorial planning.
Crypto news that's actually worth your time.
Weekly. 60 seconds. Carefully curated by our editors: no hype, no promo flood, no spam.

October 23, 2026 10:23 AM

XRP price prediction: the 100-day average crosses the 200-day average, 6.05 billion XRP move onto exchanges: what matters now
Our reading: on October 21 XRP's 100-day moving average rose above its 200-day average, the first time in our measurable series since May 11. Over the same stretch exchanges took in 6.05 billion XRP, and the two numbers point in different directions.

October 9, 2026 4:16 PM

Bitcoin Price Prediction: Standard Chartered Sticks to $100,000 as ETFs Shed $729 Million in Two Days
Standard Chartered is holding to $100,000 by year-end, yet US spot ETFs lost $729 million on Wednesday and Thursday. Bitcoin stands at around $83,100. What would have to happen by December, and which levels count now.

November 5, 2026 1:09 PM

Cardano Price Prediction: Down 26.5 Percent in 30 Days, the Levels ADA Must Hold Now
Cardano lost 26.5 percent in 30 days, four times as much as Bitcoin. Now the 20-day and 200-day averages sit almost at the same price right above the market. Why this zone decides and which scenarios follow for ADA.
October 29, 2026 9:33 AM

Bitcoin Cash falls below $286: the 200-day line that decides the trend
Bitcoin Cash loses almost 6 percent to $279.87 and slips below its 200-day line at $286.19. The trigger is the Fed rate pause of October 28, at which two members even voted for an increase.
August 11, 2026 5:35 PM

Is Bitcoin a Good Buy at Current Prices?
Bitcoin trades about 29 percent below its twelve-month high and has slipped below its 50-day moving average. What chart structure, RSI and trading volume say about buying at current prices.
October 21, 2026 7:19 AM

ETF inflows of $526.7 million meet a Bitcoin price of $82,708: the levels that decide before the Fed meeting
Bitcoin costs $82,708 on Wednesday morning after $526.7 million flowed into the US spot ETFs on Monday. October still leaves those funds in the red, and two moving averages frame the market until the Fed meets on October 28.

November 4, 2026 7:42 AM

Bitcoin ETF Outflows Pass $1 Billion: Why Institutions Are Selling After the Midterms
Spot Bitcoin ETFs bled over $1 billion in three sessions as the Binance hack and the midterms spooked institutions. Where does BTC go next?
June 20, 2026 3:27 PM

Bitcoin ETF Outflows Hit Record Levels: Why Institutions Are Pulling Billions From BTC
Spot Bitcoin ETFs just logged their longest outflow streak ever, shedding billions as BTC sits near $63K. Here's what's driving it and what it means.
November 5, 2026 9:12 PM

Solana Price Slides to $89, First Test of the 200-Day Line Since August
The Solana price fell 6.4 percent to around $89 on November 5 and touched its 200-day line for the first time since August. A chip sell-off on the Nasdaq set it off, amplified by more than $1 billion in liquidations and ongoing ETF outflows.
October 26, 2026 9:32 PM

Ethereum price prediction: the 200-day line is the level that decides
Analysis: Ethereum trades at $2,308 on Monday evening and falls for the fourth day in a row, below the 200-day average of $2,329 for the first time since August 20. Price, averages and the Fed date on Wednesday are documented; the editorial team's assessment stands separately in the text.
September 20, 2026 1:11 PM

Bitcoin Golden Cross: What Twelve Signals Since 2014 Really Show
Bitcoin's 50-day line has crossed its 200-day line. We evaluated all twelve golden crosses since 2014 ourselves and measured what happened afterwards. The result argues against the common reading of the signal.
November 6, 2026 3:16 PM

Ethereum Price After the Jobs Report: 165,000 New US Jobs Sharpen Fears of a Fed Hike
Analysis: US payrolls grew by 165,000 in October, more than twice the forecast, and futures now put the odds of a Fed rate hike in December at around 80 percent. Ether sits at $2,236, its lowest level since August, as the 200-day line at $2,157 draws closer.
November 6, 2026 3:12 AM

Ethereum Price Falls 7.9 Percent to $2,237 After Seven Days of ETF Outflows
Analysis: Ether lost 7.9 percent in 24 hours to around $2,237 and fell harder than Bitcoin after a chip sell-off on the Nasdaq wiped out leveraged positions. The role of ETF outflows, the levels that matter now and what investors in Germany should consider on tax and buying.
November 6, 2026 5:22 AM

Bitcoin price at $75,700: BTC trades below its 100-day line ahead of the US jobs report
Context: Bitcoin starts Friday at $75,692, a good $5,000 below Thursday's high and under its 100-day line. The US jobs report for October follows at 2:30 p.m. German time, and it will decide whether the 200-day line at $73,200 becomes the next target.

August 30, 2026 1:32 PM

Bitcoin Price Correction: Why BTC Stalled Dead at $78,000 Again
Bitcoin corrected from $81,455 after a hawkish Fed. The chart shows the exact same rejection level as May. Here are the upside and downside targets.
November 4, 2026 5:23 AM

Bitcoin price at $76,947: after election night, the $75,740 low is the line to watch
By Wednesday morning, Bitcoin had recovered half of its US election-night slide and stood at $76,947. Which levels matter now, and why purchases from November 2025 become tricky for German taxpayers this week.
November 6, 2026 9:14 AM

Bitcoin Cash price drops 7.4 percent to $264, its lowest level since September 21
Bitcoin Cash has fallen to around $264, its lowest level since September 21, and is now holding only the 100-day line at $261. The decline follows a sell-off across the entire crypto market, amplified by liquidations of more than $1 billion.
October 20, 2026 7:29 AM

Bitcoin price at $81,993 and a third narrow daily range in a row: will the $81,481 level hold?
Bitcoin stands at $81,993 on Tuesday morning, wedged between the 50-day line at $81,481 and the 20-day line at $83,242. Three daily ranges in a row came in below the 90-day median, and 3,624 Bitcoin in options expire at 8am UTC.
November 1, 2026 12:10 PM

Bitcoin in November: What Ten Years of Monthly Returns Show After the Weakest October
Bitcoin ended October 2026 down 7.3%, its weakest October since 2016. We analysed ten years of monthly returns and show what they say about November and which dates will move the price now.
November 4, 2026 11:18 AM

Bitcoin price prediction: DVOL drops to 37 after the election, will the 100-day line hold?
Analysis: after the US election night, the DVOL volatility index has fallen from 40.89 to 37.03 points. What the options market expects for the 100-day line at $76,663 ahead of Friday's $2.46 billion expiry.
November 6, 2026 1:17 AM

Chainlink Price Falls 7.6 Percent as Long Bets Grow: Will $10.26 Support Hold?
Chainlink lost 7.6 percent on November 5, falling to $10.69 as the Nasdaq sell-off dragged crypto lower. Yet on OKX the number of long accounts rose to as many as 2.59 per short account, and the 200-day line at $10.06 is moving closer.
November 2, 2026 5:33 PM

Bitcoin ETFs Lost $643 Million in One Day: Most of 2026’s Gains Gone
US spot Bitcoin ETFs saw their biggest outflow since June on Friday, wiping out most of this year’s net inflows. Why it happened and what it means for the BTC price.
November 6, 2026 7:19 AM

XRP Price Drops to $1.20 and Below Its 200-Day Line: What Is Going On With XRP?
XRP loses 8.3 percent and trades at its lowest level since August. The Wall Street sell-off meets ETFs without inflows and a surplus of long accounts in the futures market.
November 5, 2026 7:14 PM

Solana Price Prediction: SOL Sits on Its 200-Day Line as DEX Volume Hits $2.39 Billion
Solana trades at $89.19 on Thursday evening, right on its 200-day moving average at $88.93. Volume on decentralised exchanges on the Solana blockchain rose 26.8 percent on the same day, while network fees are 40 percent below the previous month.
November 5, 2026 12:07 PM

Ethereum Price Prediction: 77,441 Puts for November 13, Then the Options Market Flips
Ether just gained 5.5 percent, yet the options market is split: for November 13 there are three times as many puts as calls, for November 27 twice as many calls as puts. What that means and which levels count now.
October 30, 2026 6:37 PM

XRP price prediction: will the price rise after $8.4 million of inflows?
Analysis: the US XRP funds took in a net $8.43 million on Thursday, the strongest daily figure of October. Why that sum still barely moves the price and which two levels count now.
October 5, 2026 4:33 PM

Cardano at a three-month high, the golden cross fell on October 1: the last one ended 42.4 percent lower
ADA stands at $0.27, its highest in three months, and the trade press traces the jump to a golden cross. Our own analysis of 721 daily candles shows two things the reports miss: the signal is four days old, and the last one ended 42.4 percent lower.
More from CryptoTicker