
Is Jupiter a Good Buy at Current Prices?
Jupiter has lost about a third of its value since the October high and now sits between its two key moving averages. Whether JUP is a good buy at current prices comes down to a few clear levels.


Which topics should we dive deeper into?
Select what genuinely interests you. Your picks feed directly into our editorial planning.
Crypto news that's actually worth your time.
Weekly. 60 seconds. Carefully curated by our editors: no hype, no promo flood, no spam.
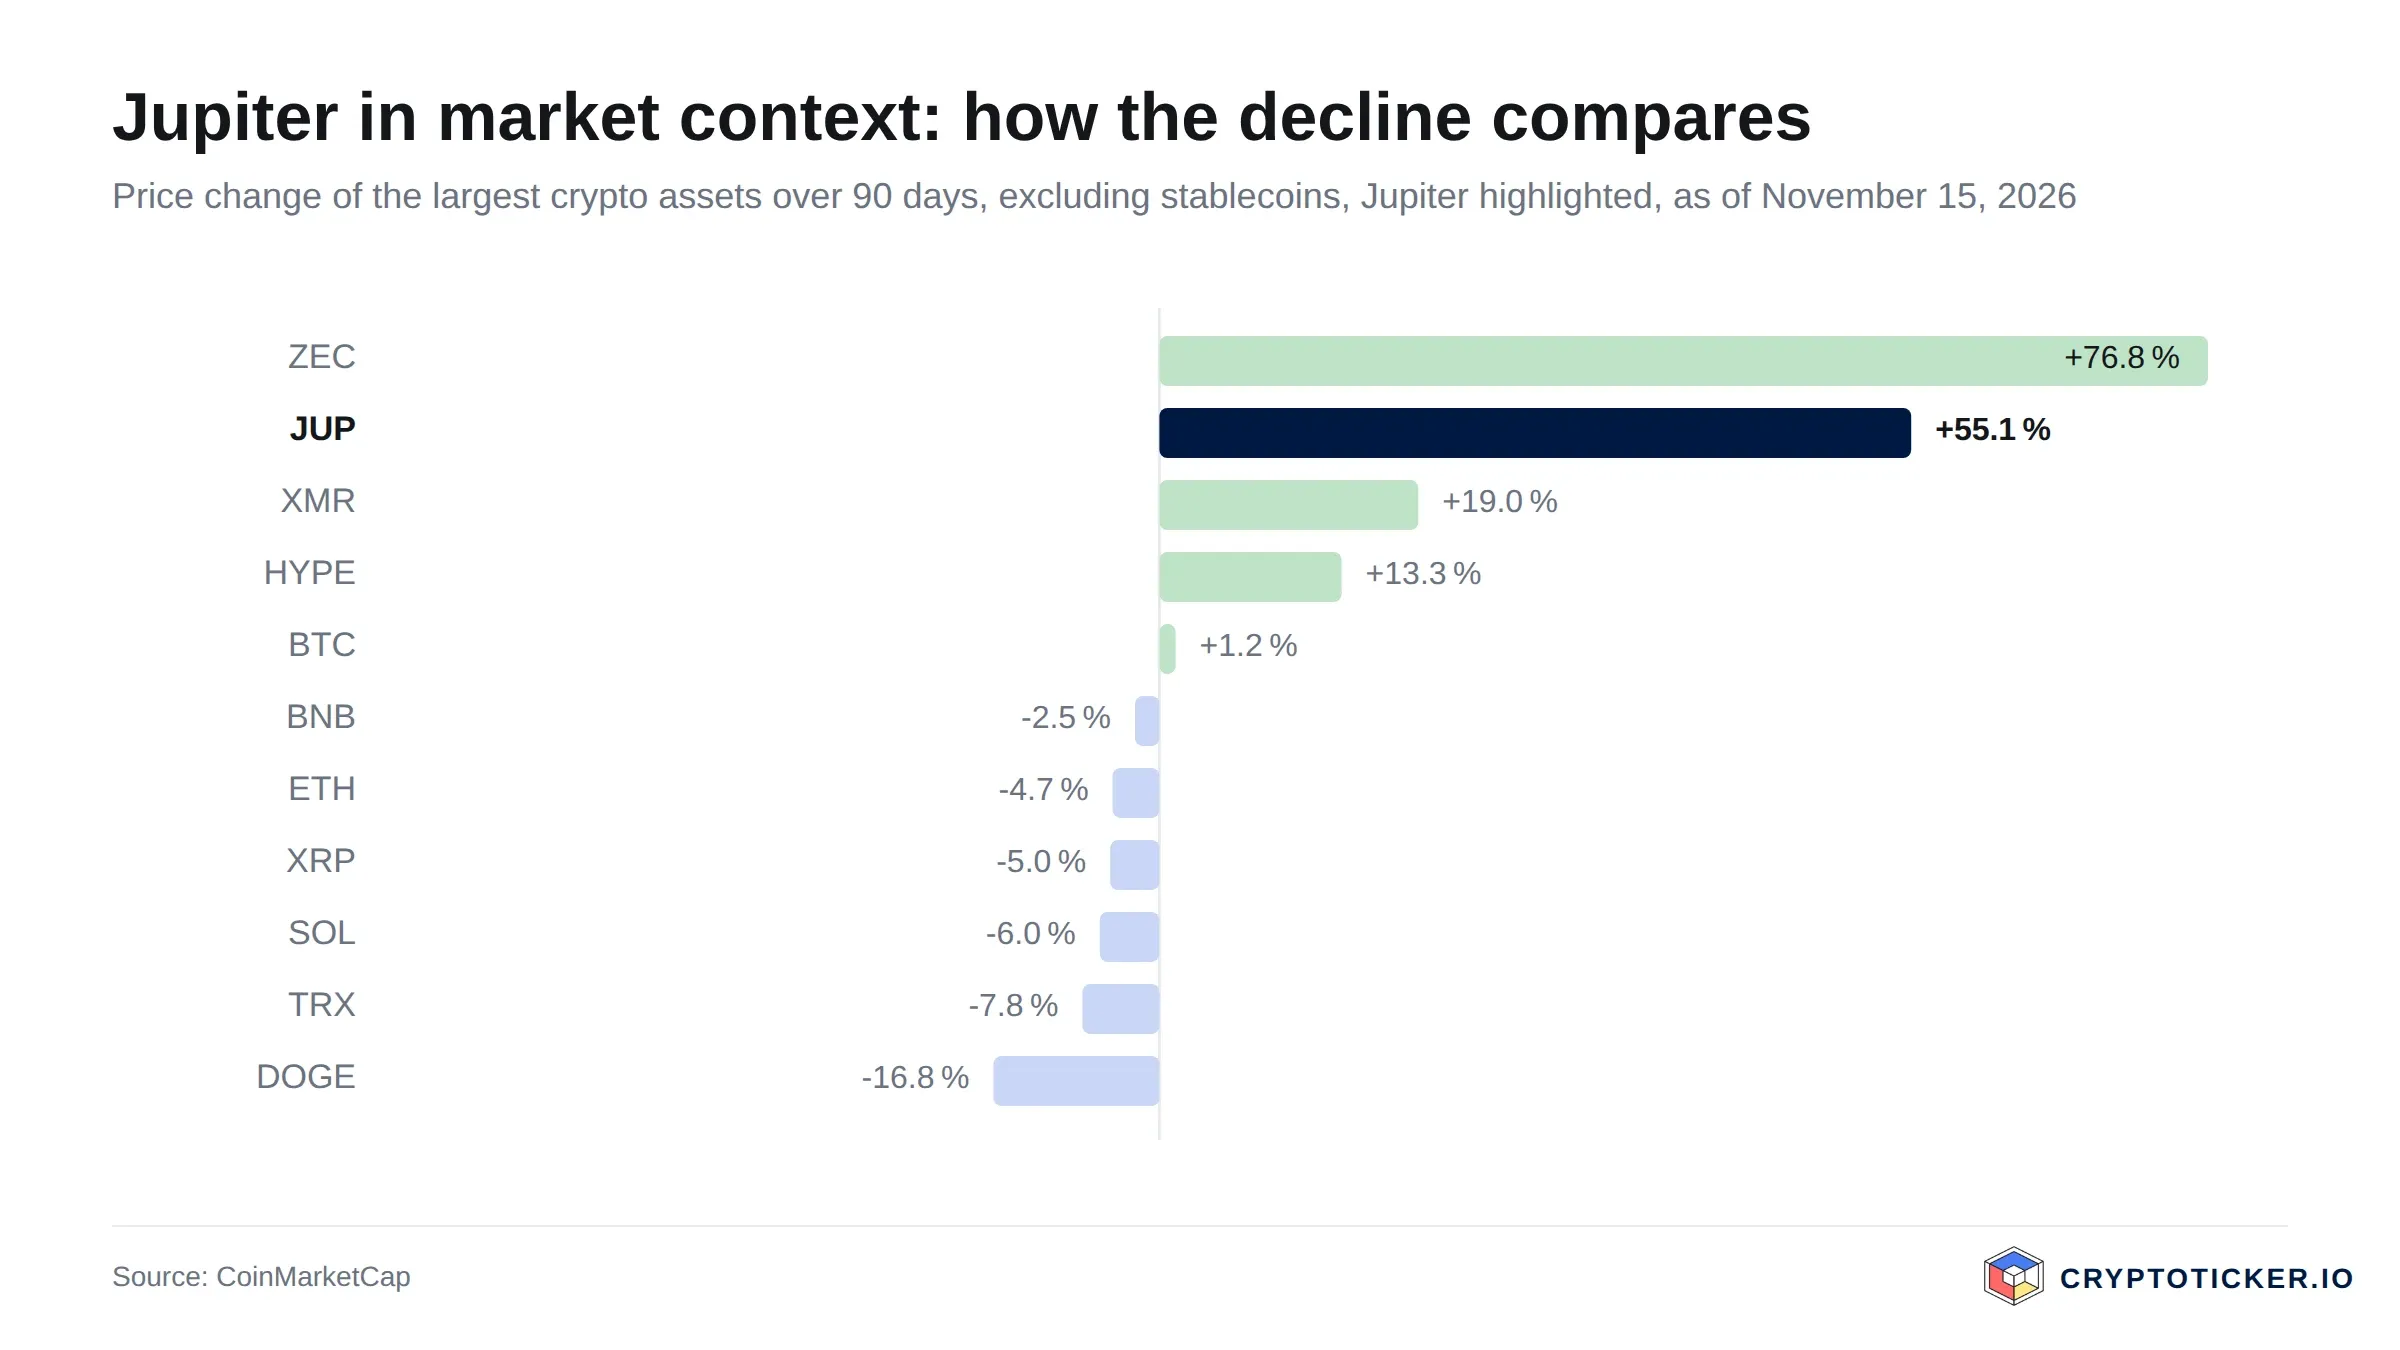
Jupiter trades at around $0.263 on 15 November 2026. That leaves JUP roughly 30 percent below its twelve-month high of $0.375, set on 10 October 2026, and about 92 percent above its twelve-month low of $0.137, which the price marked on 12 February 2026. Over 30 days the token has lost about 16 percent, over 90 days it is still up about 55 percent, and over twelve months it sits roughly 5 percent lower. Is Jupiter a good buy at current prices, or is the correction from the October peak still running?
cryptoticker.io compiled the price data itself on 15 November 2026 from the daily closing prices published by CoinMarketCap, and calculated the moving averages and the RSI from that series. For a longer-term view with scenarios, see our Jupiter price prediction.
Jupiter price analysis: where the JUP price stands now
At $0.263, the price sits between the two trend lines that matter most. We calculate the 200-day moving average, as an exponential average, at $0.242; JUP trades about 8 percent above it. The 50-day moving average stands at $0.274, roughly 4 percent above the current price.
Three levels follow from that. The first support is the low of the current correction: on 9 November 2026 JUP closed at $0.231, just below the 200-day average, and was back above it the next day. Since then it has recovered by around 14 percent. The 200-day average at $0.242 is therefore the line where buyers have stepped in twice in recent weeks. Below that lies the September low: on 16 September Jupiter closed at $0.216, and from there it climbed to the annual high of $0.375 in a little over three weeks. On the upside, the 50-day average near $0.274 is the first hurdle, followed by the interim high of $0.326 from 22 October.
Is the Jupiter downtrend broken or only interrupted?
A downtrend in the strict sense has only existed since 10 October. Before that, JUP had a strong rally behind it: from the September low of $0.216 it rose by about 74 percent within three weeks. Since the October peak the price has been printing lower highs, most recently $0.326 on 22 October, and lower lows down to 9 November.
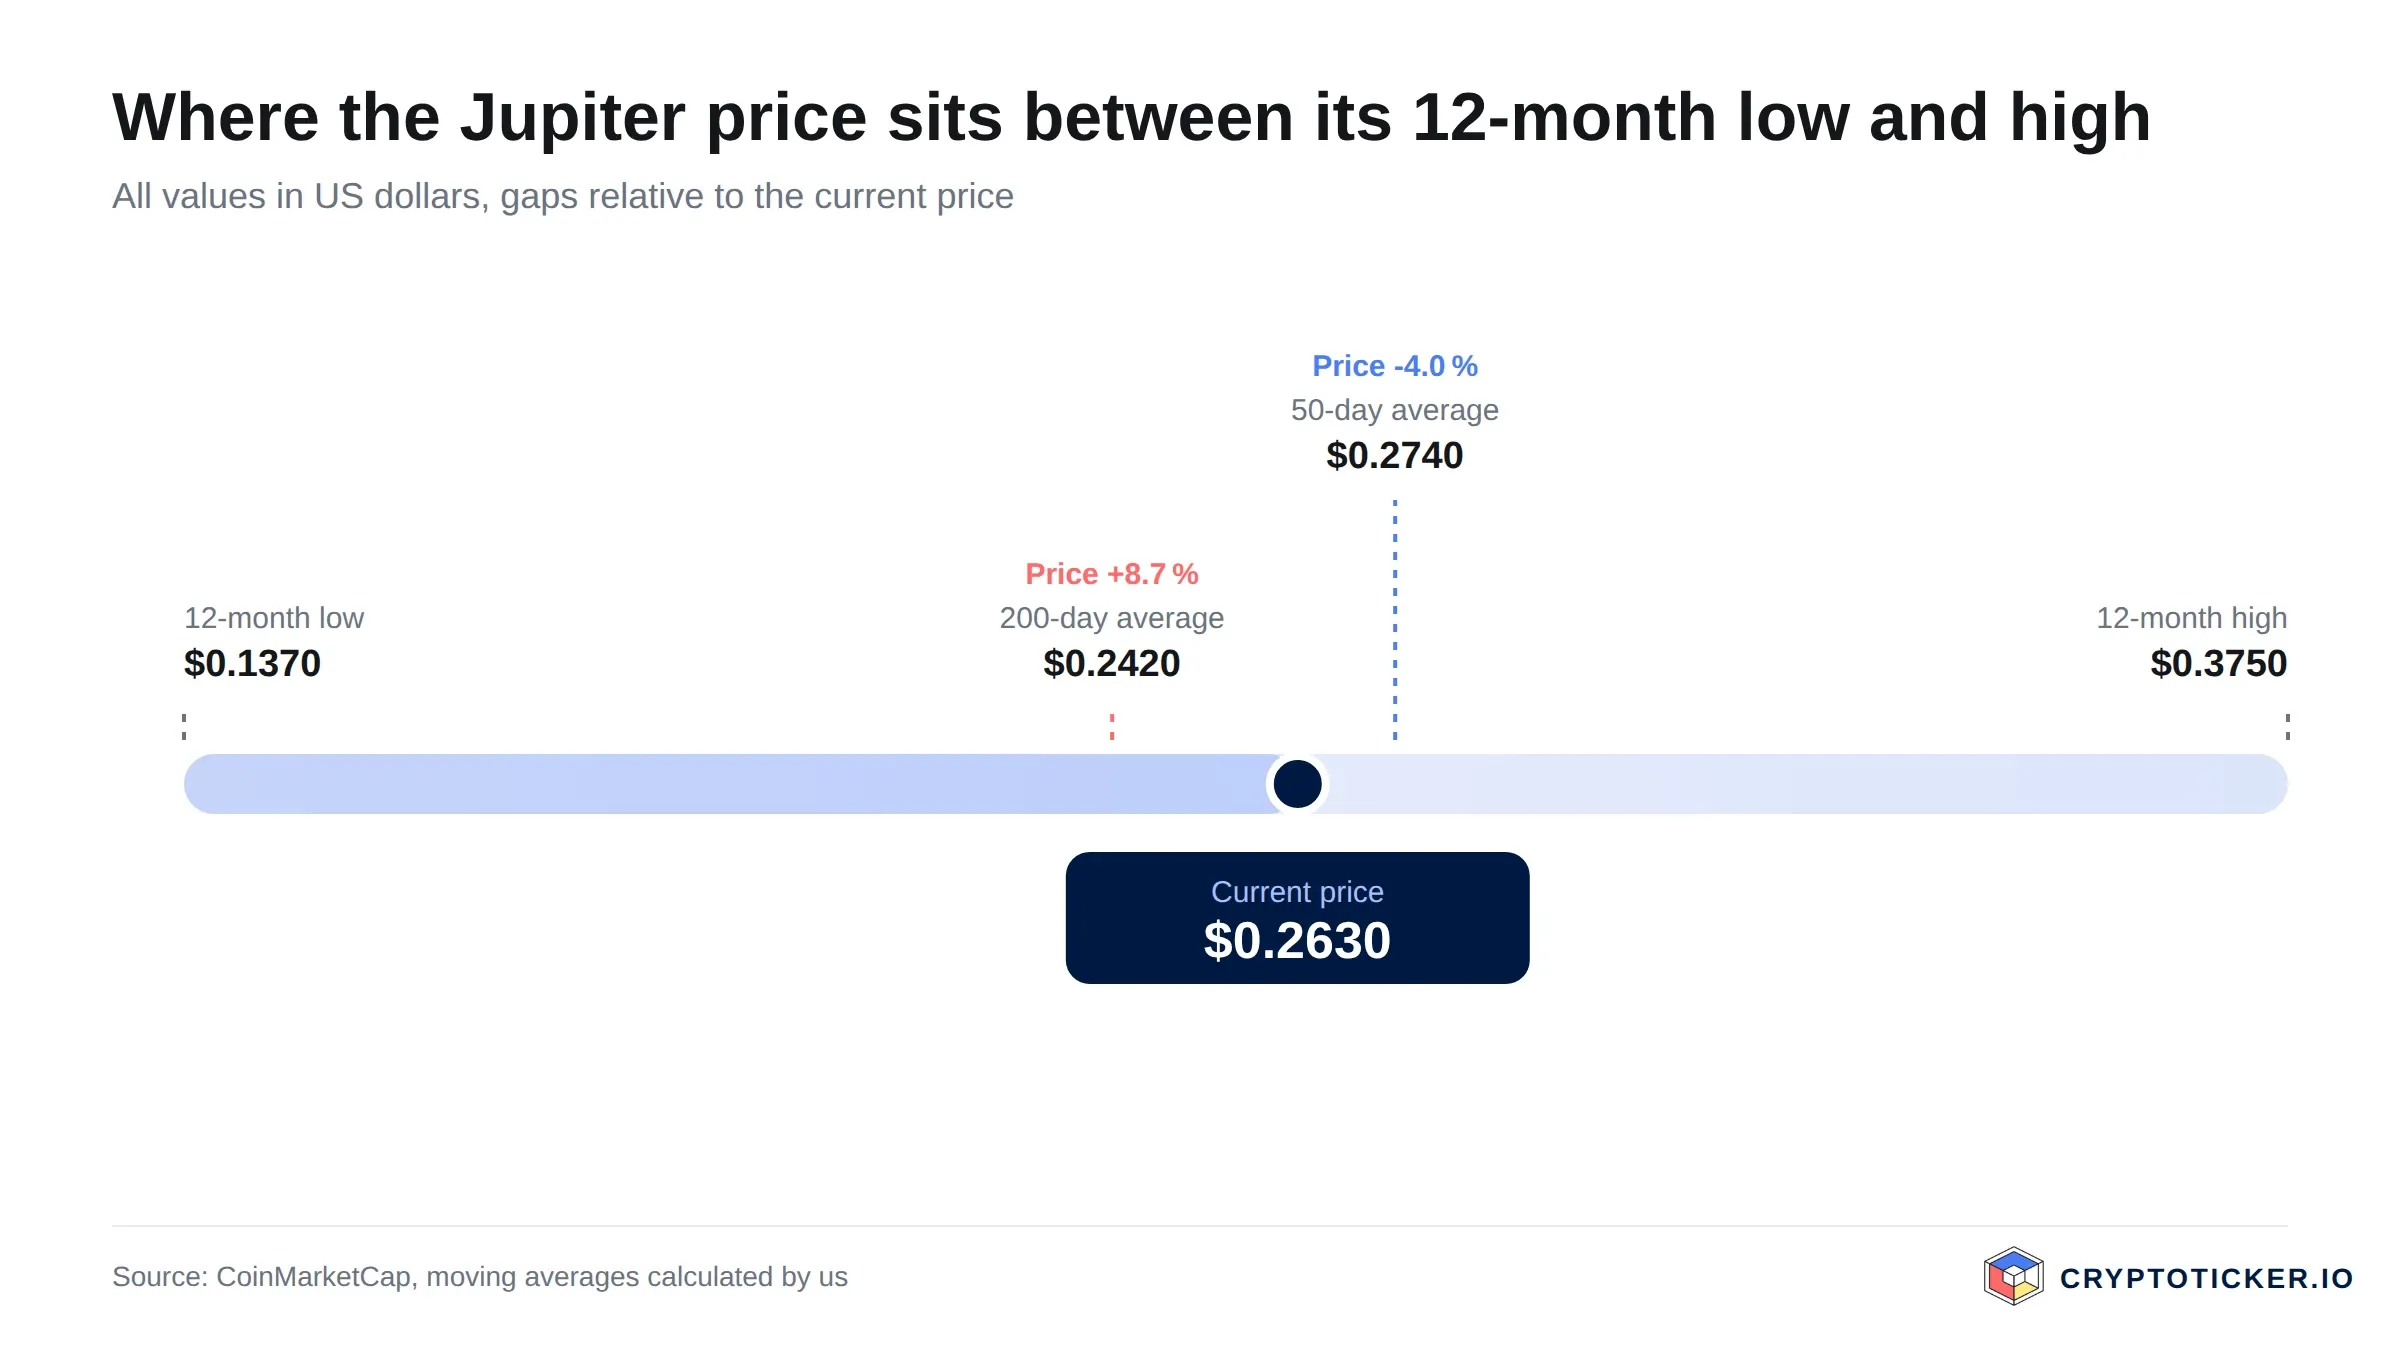
This short downtrend has not been broken yet. For that, JUP would first need a daily close back above the 50-day average and then a move through the interim high of $0.326. So far the token has only defended its latest low and pulled away from it. One encouraging detail is that the correction stalled at the 200-day average: on 6 and 9 November JUP closed just below the line and recovered above it the following day both times. As long as that line holds, the broader uptrend that began at the February low remains intact.
The wider market matters here. CoinMarketCap's Fear and Greed Index reads 13 on 15 November, deep in extreme fear. In phases like this, application tokens such as JUP usually fall harder than Bitcoin or Solana, but they also tend to recover faster once sentiment turns.
What the RSI and moving averages mean for a Jupiter entry
The 14-day RSI stands at 48.5, almost exactly in the middle of the scale. It signals neither an overbought nor an oversold market. For an entry, that means the indicator gives no reason to rush in, but it does not warn of overheating either.
The relationship between the averages says more. At $0.274, the 50-day average remains clearly above the 200-day average at $0.242, an arrangement traders read as a sign of an intact medium-term uptrend. The gap is narrowing, however, because the shorter average has been falling since mid-October. If the price slips below $0.242 and stays there, the two lines will converge further, and a downward cross would be a warning sign for trend followers.
Investors who time an entry by the averages have two obvious options. The cautious one waits for a daily close above $0.274 and pays a higher price for the confirmation. The contrarian one buys in tranches near the 200-day average and limits the risk with a clear level below the September low of $0.216.
 Compare crypto exchanges and fees
Jupiter trading volume: what it says about demand
Over the past 24 hours, JUP worth around $59 million changed hands, well above the previous day. The 30-day average is $32 million and the 90-day average $51 million. Current volume is therefore clearly above the monthly norm, but far below the peaks of the rally: on 9 October, one day before the annual high, turnover reached $182 million.
The pattern of recent weeks fits an ordinary correction. As the price fell from mid-October to early November, daily volume dropped to around $20 million, and on 8 November it was barely $12 million. There was no panic selling, rather a phase in which buyers were absent. Since the low on 9 November, price and turnover have been rising together. If that continues for several days, it would be a first sign that demand is returning.
Measured against a market capitalisation of $872 million, daily volume equals almost 7 percent. Jupiter ranks 60th among the largest crypto assets, so the token is actively traded rather than simply held.
Structural factors that support Jupiter
Jupiter is the largest trading aggregator on the Solana blockchain. An aggregator splits an order across several decentralised exchanges and routes it to wherever execution is best. Anyone swapping tokens on Solana often ends up going through Jupiter without noticing. How closely JUP is tied to Solana activity is something we described in September in our piece on the rotation in Solana DeFi: when trading volume on Solana rises, Jupiter's fees rise, and part of that revenue goes into buying back its own token.
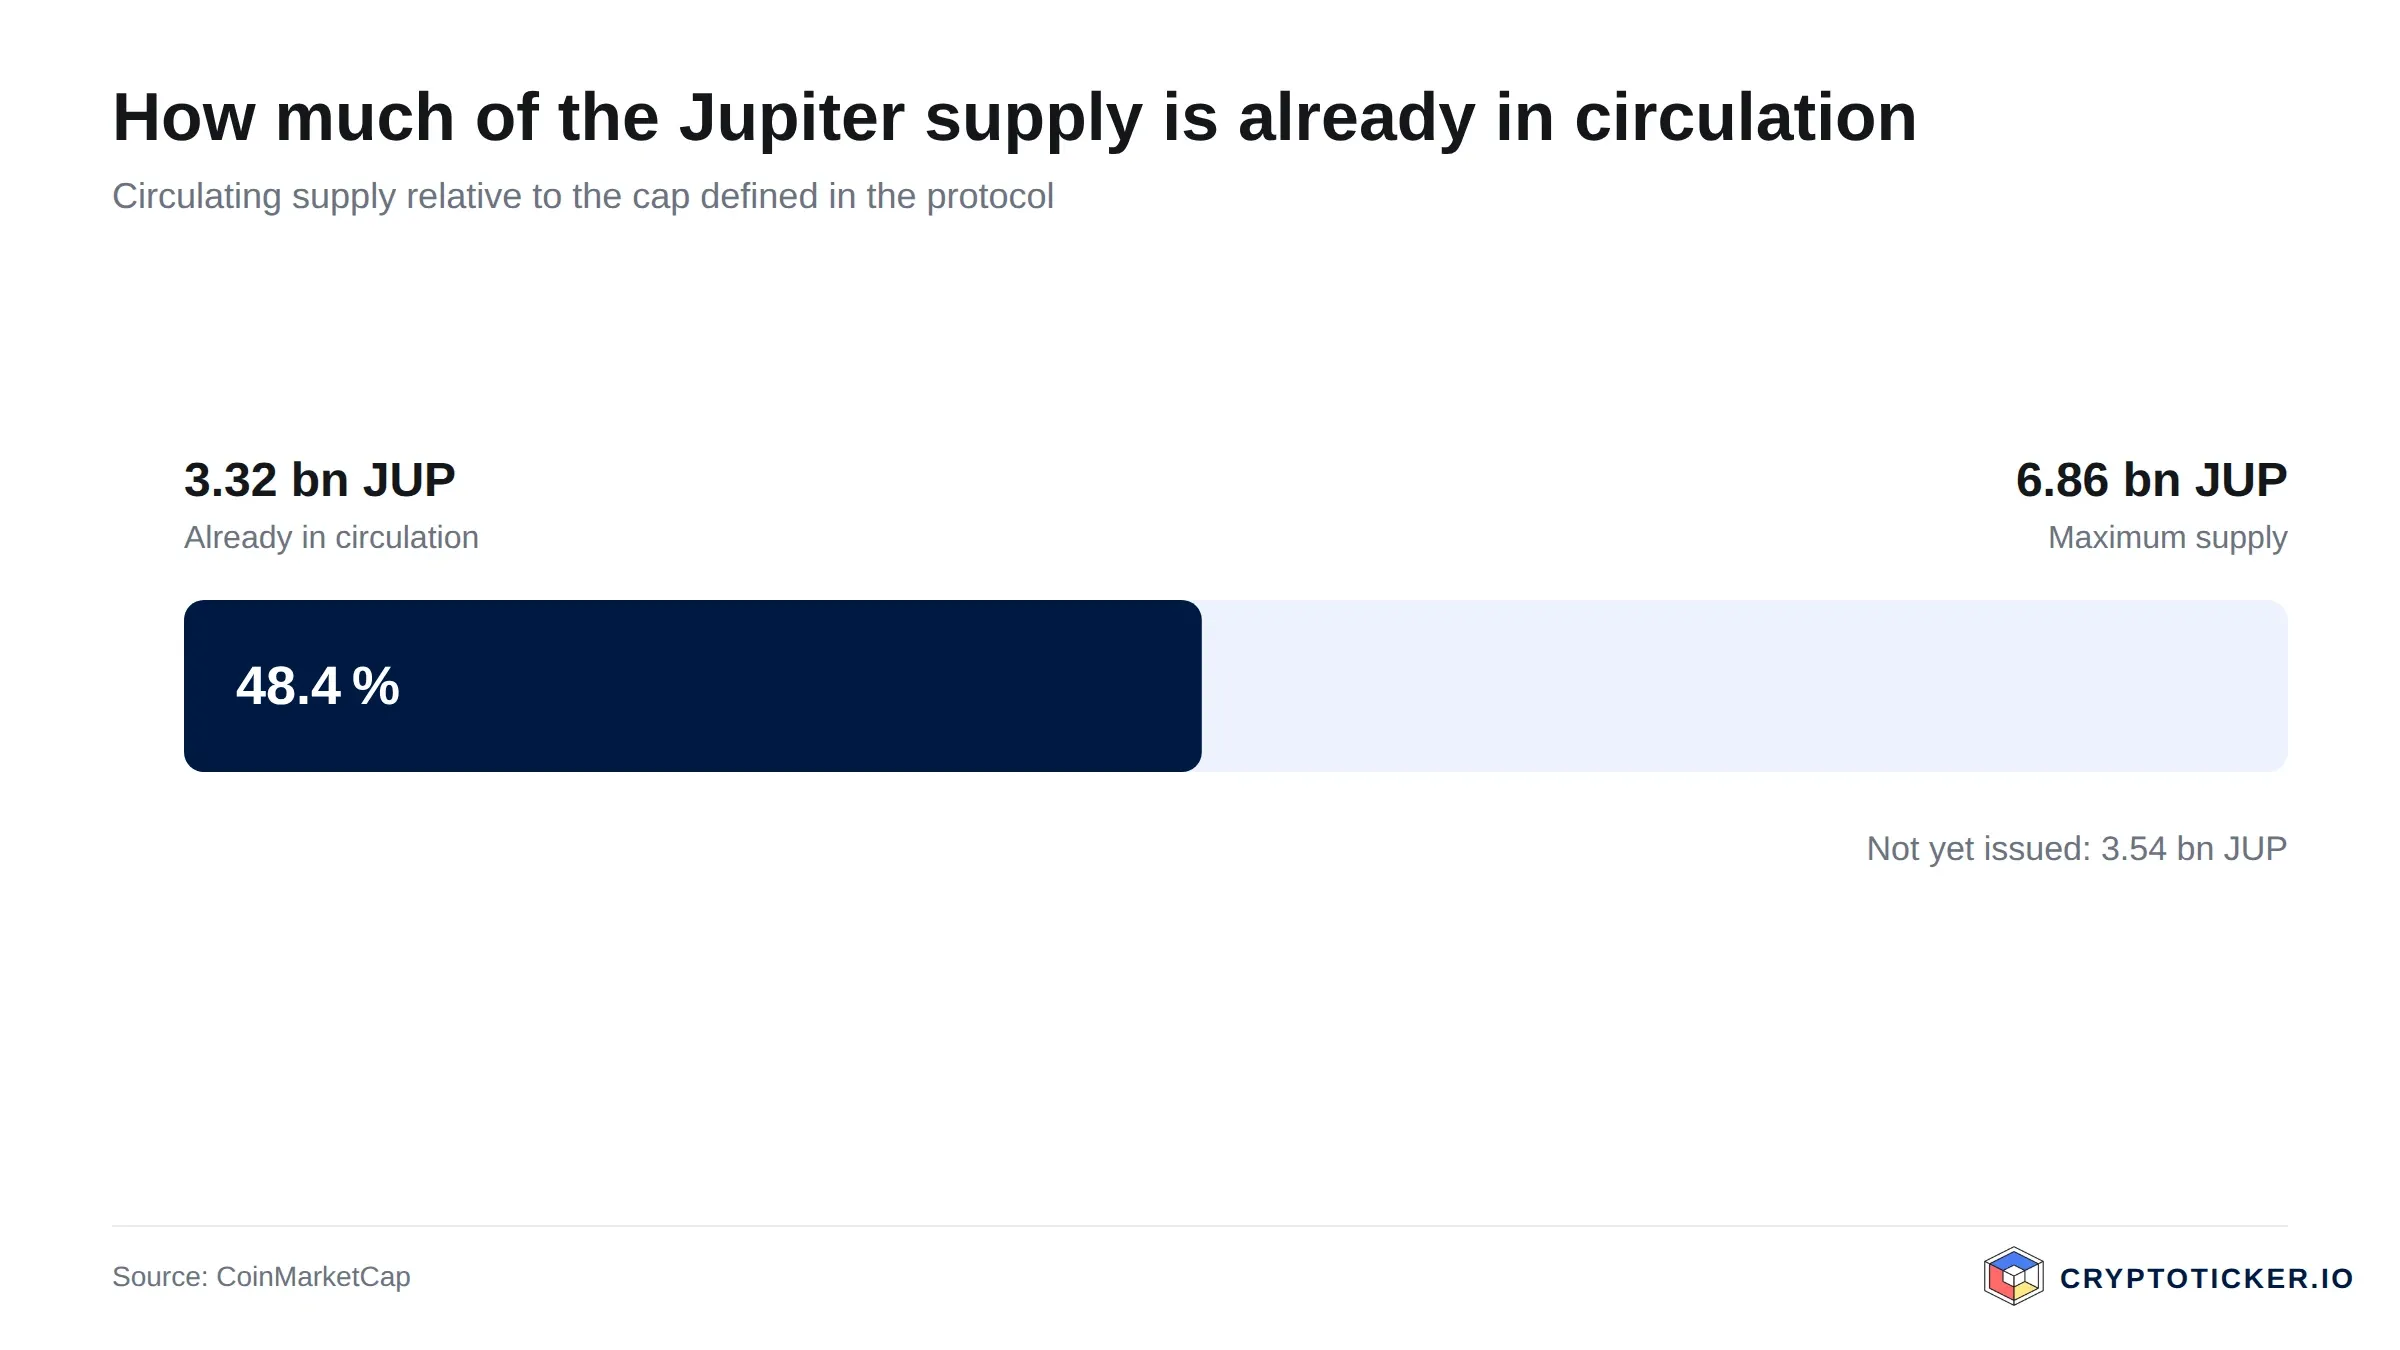
The supply mechanics are the second factor. CoinMarketCap lists a maximum supply of about 6.86 billion JUP, of which 3.32 billion are in circulation, roughly 48 percent. Ten billion tokens were originally planned; the community reduced that figure by vote. Buybacks funded by protocol revenue offset new token issuance, but only fully when trading volume stays high enough.
Third, Jupiter binds its holders through governance. Anyone who stakes JUP in the voting contract and takes part in votes receives a quarterly share of a pool of 50 million JUP. The current round for July to September 2026 can be claimed until 12 January 2027; our guide to claiming Jupiter ASR rewards explains how. On regulation, the EU's MiCA framework governs the supervision of crypto exchanges; the European Securities and Markets Authority ESMA publishes information on it.
Three reasons to buy Jupiter at current prices
- The correction stopped at the 200-day average. Twice in early November JUP closed just below the line at $0.242, most recently on 9 November at $0.231, and both times the market bought the dip the following day. The broader uptrend from the February low is undamaged.
- The distance to the annual high is wide. Around 30 percent separates the price from the October peak at $0.375. Investors who expect demand on Solana to return are buying considerably cheaper than five weeks ago.
- The business model is linked to real usage. Part of the trading fees flows into buybacks. If volume on Solana rises, JUP benefits directly, and at present extreme fear across the market is weighing on the price more than any decline in usage.
Compare MiCA-regulated crypto exchangesThree reasons against buying Jupiter at current prices
- The short-term trend points down. Since 10 October JUP has formed lower highs and lower lows, and the price sits below a falling 50-day average. A reversal is only confirmed by a daily close above $0.274.
- More than half of all tokens are not yet in circulation. Of 6.86 billion JUP, 3.32 billion circulate. Every further release adds supply; the fully diluted value is about $1.8 billion, more than double the market capitalisation.
- Two layers of risk sit on top of each other. If Solana loses users, every application built on it suffers. On top of that come Jupiter's own risks: a competing aggregator, a flaw in its smart contracts or a change to how fees are distributed would hit JUP alone.
How to buy Jupiter at current prices
The simplest route runs through a centralised exchange. Kraken lists JUP; what fees, deposits and supervision look like there is covered in our Kraken review. Whether and on what terms other platforms offer the token is shown in our crypto exchange comparison. Watch three costs: the trading fee per order, the spread between buying and selling price, and the fee for a later withdrawal to your own wallet.
If you already hold Solana, you can also swap for JUP directly on the blockchain, for example through the Jupiter interface itself. You will need a Solana-compatible wallet and a little SOL for network fees, which usually amount to fractions of a cent. On this route you alone are responsible for the recovery phrase, and a mistyped address cannot be reversed.
As for custody: small amounts for trading can stay on a regulated exchange. Larger holdings that you plan to keep for months, or to stake for the governance rewards, belong in a wallet you control, and for higher sums on a hardware device. A selection is listed in our hardware wallet comparison.
So is Jupiter a good buy at current prices?
In the short term, the zone between $0.242 and $0.274 decides. If the 200-day average holds and JUP reclaims the 50-day average on a daily close, the correction since October would be over and the interim high of $0.326 would come into range as the next target. If the price instead closes below $0.242 for several days, a return to the September low of $0.216 becomes the more likely scenario. Should that level give way as well, the case for a recovery with rising lows is invalidated.
In the long term, the answer depends less on the chart than on Solana. If Jupiter remains the main gateway to trading on that blockchain and volume there grows, buybacks funded by fees can offset the issuance of new tokens. If trading shrinks for months or Jupiter loses market share to other aggregators, dilution will prevail. The long-term thesis is invalidated if daily trading volume falls below $20 million for a sustained period while the price stays below $0.216. This assessment describes scenarios and is not a recommendation to buy.
Buying Jupiter: What to take away
- Three levels matter for JUP: $0.242 as the 200-day average, $0.274 as the 50-day average and $0.216 as the September low. The longer-term scenarios are set out in our JUP price prediction.
- Costs and supervision differ between platforms that list JUP. Investors who value oversight will find MiCA-licensed providers in our overview of regulated crypto exchanges.
- Custody deserves a decision before the purchase, especially if JUP is meant to be staked for governance rewards. Suitable devices are compared in our wallet comparison.
Disclosure: Some of the providers mentioned in this article work with us through affiliate programmes. This has no influence on the price analysis or the assessment of the chart; the price data comes from a public market data source and can be verified there.
(As of: 15 November 2026. This article is not investment advice. Prices, fees and conditions change; check them with the provider before every purchase. Crypto assets are subject to high price volatility, and a total loss is possible.)
Frequently asked questions about Jupiter
Partner links: some links on this page are partner links. If you become a customer through one of them, we may earn a commission at no extra cost to you. Selection, ratings and ranking are decided independently by our editorial team. Ethics and Independence · Ownership and Funding
Transparency note: This article was produced with the assistance of artificial intelligence and reviewed by our editorial team before publication. All figures and claims were checked against the primary sources linked in the text. The feature image was generated with AI.
For later? Save this article and find it again in your profile.
Related articles
- Bitcoin price prediction: Mayer Multiple drops to 0.88, 11 percent below the 200-day line
- Bitcoin price falls below $72,000: the reasons behind the drop
- Chainlink takes Moody's ratings across blockchains as LINK slips below its 200-day line
- Bitcoin price at $73,700: outflows from BlackRock's IBIT show no sign of stopping
- Bitcoin price prediction: lowest level since August, will the $72,000 zone hold?
Which topics should we dive deeper into?
Select what genuinely interests you. Your picks feed directly into our editorial planning.
Crypto news that's actually worth your time.
Weekly. 60 seconds. Carefully curated by our editors: no hype, no promo flood, no spam.

November 9, 2026 3:15 PM

Solana price prediction: OKX open interest up 24 percent as SOL breaks below its 200-day average
Analysis: OKX traders hold 24 percent more SOL in open contracts than two weeks ago, even though the price has fallen to $87. What that leverage means for the $85 level, and how leveraged gains are taxed in Germany.

November 9, 2026 11:17 AM

Bitcoin slips below Strategy's $75,451 cost basis as Saylor's 849,327 BTC go underwater
Analysis: Bitcoin trades at around $74,030 on Monday, below the $75,451 average price at which Strategy bought its 849,327 BTC. What the SEC filing reveals about the purchases, which levels matter now and how Bitcoin and Strategy shares are taxed in Germany.
November 9, 2026 5:13 AM

Bitcoin price holds $74,800 as the 200-day average at $73,170 faces US inflation data
Analysis: Bitcoin starts the week at around $74,800 after briefly dropping to $73,477 on Sunday evening, its lowest level since August 21. The 200-day moving average sits just below, and US inflation data is due on Tuesday.
November 8, 2026 3:12 PM

Solana staking yields 5.2 percent while SOL has lost 19 percent in 30 days
Analysis: Staking SOL currently earns around 5.2 percent a year, but the price has lost 19.2 percent in 30 days. Since October 9, holders have also pulled 4.8 million SOL out of staking, while the price is clinging to the 200-day line at $89 on Sunday.
November 7, 2026 3:15 PM

Solana Price Prediction: China's Central Bank Targets the Shanghai Campaign. What Now for SOL?
Analysis: China's central bank has classified the Solana promotion in Shanghai as illegal financial activity and is investigating the firms that helped run the tour. SOL holds its 200-day line at $89.98 on Saturday, but the Solana blockchain now carries $1.6 billion less in stablecoins than 30 days ago.
November 7, 2026 9:13 AM

Dogecoin Price at $0.072 in a Death Cross: When Will DOGE Rise Again?
Since October 29, Dogecoin's 50-day moving average has been below its 200-day line. Our analysis shows why the signal comes late, which levels at $0.0760 and $0.0690 matter, and what November 2025 buyers in Germany should know before their holding period ends.
November 6, 2026 9:19 PM

Bitcoin price prediction: $430 million outflow pushes the 2026 ETF balance below zero
Analysis: US bitcoin ETFs lost $869.8 million in four trading days, and the balance for 2026 is back below zero. What the outflows reveal about the price at $75,800, which levels count until the end of November and what investors in Germany can make of it.

November 6, 2026 7:17 PM

Ethereum price prediction: 986,847 ETH queue to stake while only 4,320 ETH wait to exit
Close to one million ether is waiting to enter staking, while only 4,320 ETH want out. What that ratio says about ether at $2,229, which levels matter until the end of November and what stakers in Germany need to know about tax.
November 6, 2026 3:25 PM

Solana Price Prediction: Only $1.2 Million in ETF Outflows, Even Though Holders Are Under Water
Analysis: Solana fell 6.5 percent on Thursday, yet only $1.18 million left the US spot ETFs. Investors have paid in $1.467 billion since launch, while the funds' holdings are now worth $1.333 billion.
November 6, 2026 9:14 AM

Bitcoin Cash price drops 7.4 percent to $264, its lowest level since September 21
Bitcoin Cash has fallen to around $264, its lowest level since September 21, and is now holding only the 100-day line at $261. The decline follows a sell-off across the entire crypto market, amplified by liquidations of more than $1 billion.
November 6, 2026 7:19 AM

XRP Price Drops to $1.20 and Below Its 200-Day Line: What Is Going On With XRP?
XRP loses 8.3 percent and trades at its lowest level since August. The Wall Street sell-off meets ETFs without inflows and a surplus of long accounts in the futures market.
November 6, 2026 5:22 AM

Bitcoin price at $75,700: BTC trades below its 100-day line ahead of the US jobs report
Context: Bitcoin starts Friday at $75,692, a good $5,000 below Thursday's high and under its 100-day line. The US jobs report for October follows at 2:30 p.m. German time, and it will decide whether the 200-day line at $73,200 becomes the next target.
November 6, 2026 1:27 AM

Is Aerodrome Finance a Good Buy at Current Prices?
Aerodrome Finance has lost about a third since mid-October and is now testing its 200-day average. Whether AERO is a good buy at current prices comes down to a few key levels.
November 6, 2026 1:17 AM

Chainlink Price Falls 7.6 Percent as Long Bets Grow: Will $10.26 Support Hold?
Chainlink lost 7.6 percent on November 5, falling to $10.69 as the Nasdaq sell-off dragged crypto lower. Yet on OKX the number of long accounts rose to as many as 2.59 per short account, and the 200-day line at $10.06 is moving closer.
November 5, 2026 9:12 PM

Solana Price Slides to $89, First Test of the 200-Day Line Since August
The Solana price fell 6.4 percent to around $89 on November 5 and touched its 200-day line for the first time since August. A chip sell-off on the Nasdaq set it off, amplified by more than $1 billion in liquidations and ongoing ETF outflows.
November 5, 2026 7:14 PM

Solana Price Prediction: SOL Sits on Its 200-Day Line as DEX Volume Hits $2.39 Billion
Solana trades at $89.19 on Thursday evening, right on its 200-day moving average at $88.93. Volume on decentralised exchanges on the Solana blockchain rose 26.8 percent on the same day, while network fees are 40 percent below the previous month.
November 5, 2026 1:09 PM

Cardano Price Prediction: Down 26.5 Percent in 30 Days, the Levels ADA Must Hold Now
Cardano lost 26.5 percent in 30 days, four times as much as Bitcoin. Now the 20-day and 200-day averages sit almost at the same price right above the market. Why this zone decides and which scenarios follow for ADA.
November 5, 2026 12:07 PM

Ethereum Price Prediction: 77,441 Puts for November 13, Then the Options Market Flips
Ether just gained 5.5 percent, yet the options market is split: for November 13 there are three times as many puts as calls, for November 27 twice as many calls as puts. What that means and which levels count now.
November 4, 2026 3:15 PM

Solana price prediction: SOL tests the 200-day line at $88.88 ahead of Breakpoint London
Analysis: eleven days before the Breakpoint conference in London, Solana fell to $89.77, almost touching its 200-day moving average. Our review of the last three conferences shows how strongly the price moved before and after.
November 2, 2026 9:36 PM

Bitcoin price prediction: $295 above the 100-day line, the level that decides
Analysis: the daily low was $295 above the 100-day line at $76,035. Four trading days before the US midterm elections and with an 82.6 percent rate expectation for December, this gap will decide the coming weeks.
November 2, 2026 7:30 PM

Chainlink slips below its 100-day line as long bets shrink by a third
Analysis: Chainlink trades at $11.11 and falls below its 100-day line at $11.36. At OKX the long-short ratio has dropped from 3.18 to 2.10 since October 24, and the 200-day line sits at $10.03.
November 2, 2026 7:13 PM

Solana price prediction: 1,000 days without an outage, will the 200-day line at $89 hold?
Analysis: the Solana blockchain has run without a halt since February 6, 2024, and on November 2 the streak reaches exactly 1,000 days. The price still falls to $92.78, its lowest since August; we show which levels matter now and why technology alone does not carry the price.
October 30, 2026 11:28 PM

Is Polygon a Good Buy at Current Prices?
Polygon sits roughly half below its twelve-month high and keeps running into both moving averages. What the chart structure, the RSI and the trading volume say about buying POL at the current price.
October 26, 2026 9:32 PM

Ethereum price prediction: the 200-day line is the level that decides
Analysis: Ethereum trades at $2,308 on Monday evening and falls for the fourth day in a row, below the 200-day average of $2,329 for the first time since August 20. Price, averages and the Fed date on Wednesday are documented; the editorial team's assessment stands separately in the text.
October 23, 2026 10:23 AM

XRP price prediction: the 100-day average crosses the 200-day average, 6.05 billion XRP move onto exchanges: what matters now
Our reading: on October 21 XRP's 100-day moving average rose above its 200-day average, the first time in our measurable series since May 11. Over the same stretch exchanges took in 6.05 billion XRP, and the two numbers point in different directions.
October 5, 2026 4:33 PM

Cardano at a three-month high, the golden cross fell on October 1: the last one ended 42.4 percent lower
ADA stands at $0.27, its highest in three months, and the trade press traces the jump to a golden cross. Our own analysis of 721 daily candles shows two things the reports miss: the signal is four days old, and the last one ended 42.4 percent lower.

More from CryptoTicker