
XRP price prediction: the 100-day average crosses the 200-day average, 6.05 billion XRP move onto exchanges: what matters now
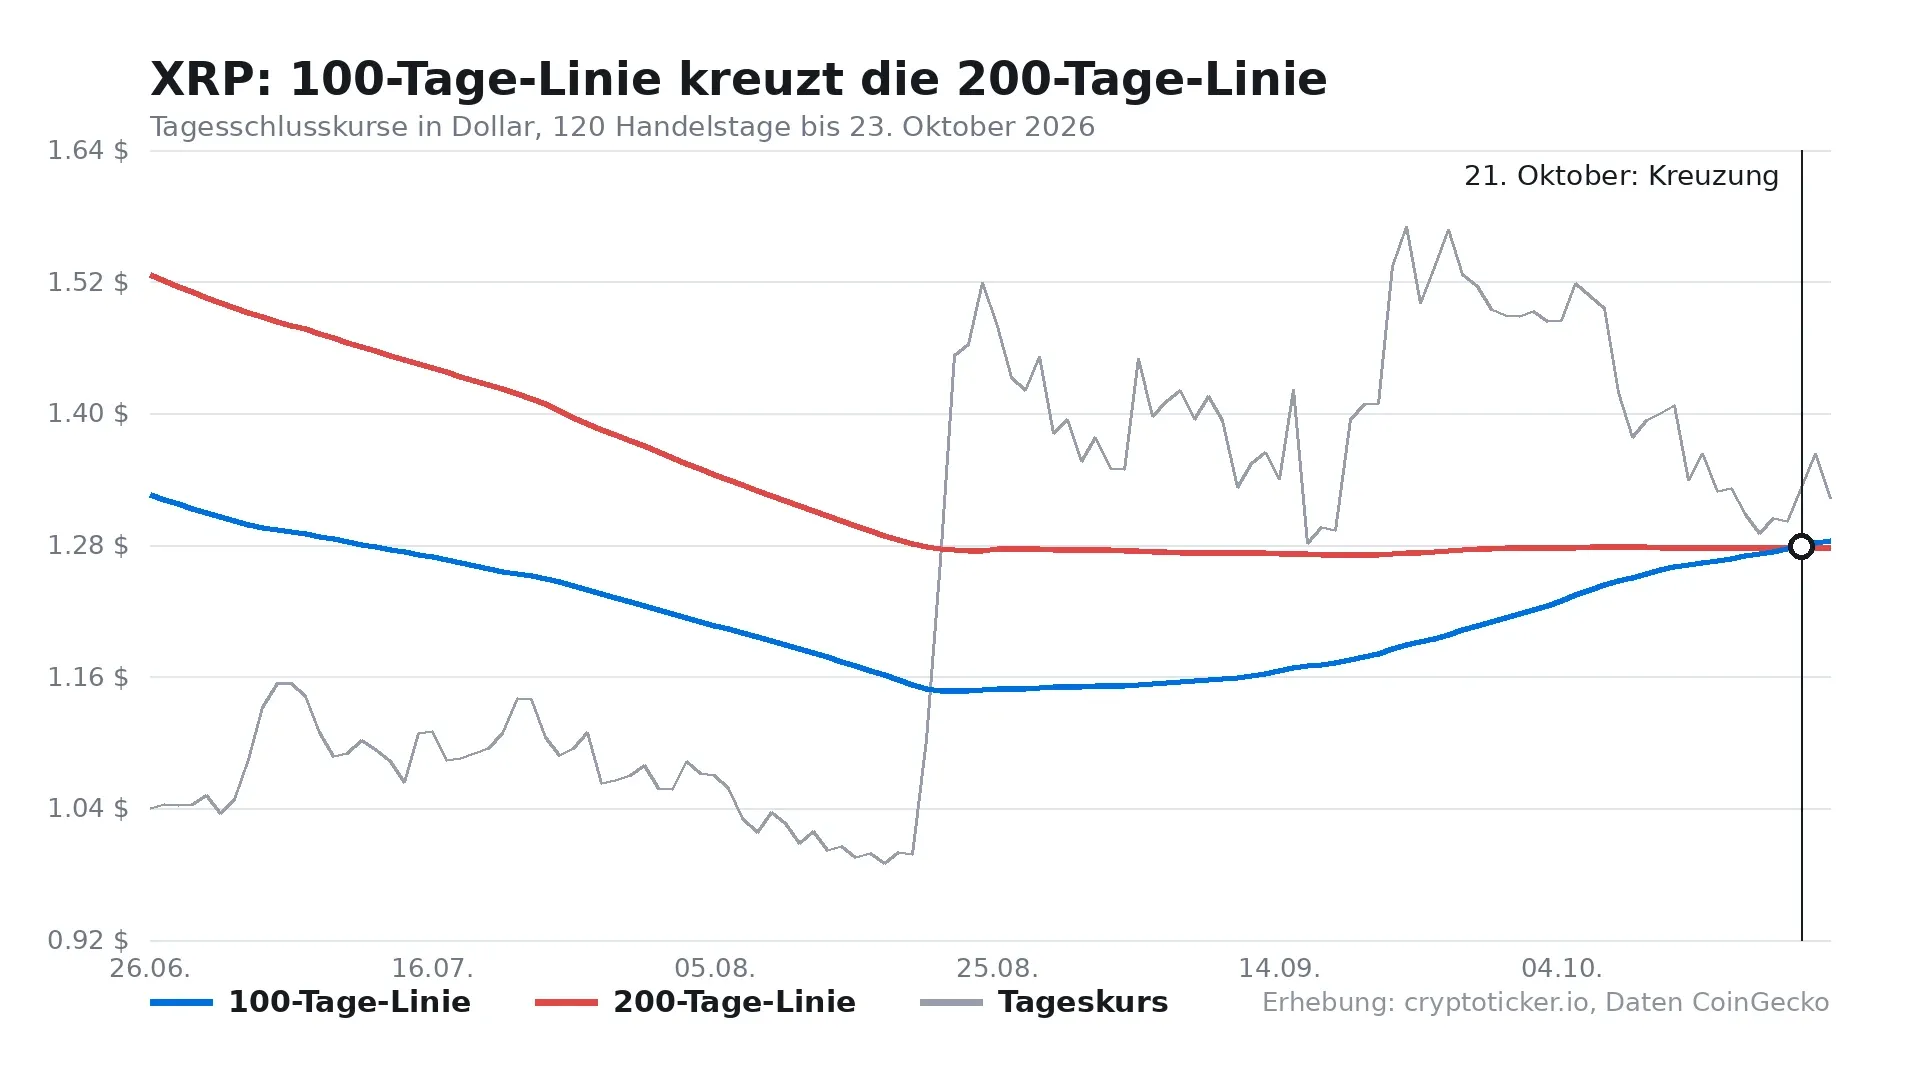
Our reading: on October 21 XRP's 100-day moving average rose above its 200-day average, the first time in our measurable series since May 11. Over the same stretch exchanges took in 6.05 billion XRP, and the two numbers point in different directions.


Which topics should we dive deeper into?
Select what genuinely interests you. Your picks feed directly into our editorial planning.
Crypto news that's actually worth your time.
Weekly. 60 seconds. Carefully curated by our editors: no hype, no promo flood, no spam.
Here is what is documented: XRP's 100-day moving average sat 0.09 percent below the 200-day average on October 20 and 0.10 percent above it on October 21. On Friday morning the gap is 0.49 percent and the price stands at around $1.32. Our own reading follows further down: the crossover comes out of the calendar, not out of fresh demand, and reading it as a buy signal mistakes an arithmetic mechanism for a market. This piece shows both sides with numbers, names the levels that follow from them, and says what an investor in Germany can do with it today.
The 100-day average crossed the 200-day average on October 21
A moving average is the mean of the daily closing prices over a fixed number of days. The 100-day average therefore averages the last 100 closes, the 200-day average the last 200. Because every new day pushes the oldest one out of the window, a line like this moves even when nothing at all happens in the market.
We pulled XRP's daily closes for the past twelve months from CoinGecko, cleaned the series down to one value per calendar day, and calculated both averages ourselves. The result for October 23: the 100-day average stands at $1.286, the 200-day average at $1.280. The crossover falls on October 21. Before that the shorter line ran below the longer one throughout, with the widest gap in the series of 19.94 percent on May 11.
How to place the price over a horizon of months is set out in our XRP price prediction, which we keep updating with the current levels.
One limitation belongs here because it caps what we can say: our series goes back to October 24, 2025. The 200-day average can only be calculated from it from May 11, 2026 onwards. Whether the two lines had already crossed in this direction before that, our measurement does not say, so we do not claim it either.
The base effect lifts the 100-day average while the price loses 6.78 percent
This is where it gets interesting, because the two moves do not fit together. Since October 8 the 100-day average has risen 2.93 percent, from $1.2494 to $1.286. The price itself fell 6.78 percent over the same stretch, from $1.4208 to $1.3245. One line rises, the price falls, and both figures are correct.
The explanation sits in the window. Today's 100-day window runs from July 16 to October 23. Over the past 15 days, days have dropped out of that window whose closes averaged $1.1017, the first half of July. What came in were 15 days averaging $1.3460. Between old and new there are 24.4 cents per day. That swap lifts the mean without a single extra buyer.
In technical language this is called the base effect: a metric changes because the comparison period moves, not because the thing itself has changed. Even now, 29 of the 100 days in the window sit below $1.10, leftovers from the summer. Those days will drop out one by one over the coming weeks. As long as that continues, the 100-day average keeps rising even if XRP marks time.
The reason for the jump lies in August. From August 19 to 22, XRP climbed from $1.0011 to $1.4543, a gain of 45.3 percent in three trading days. Precisely those days now sit in the middle of the 100-day window and pull the mean up, while in the 200-day window they are diluted by much weaker months.
 Find an EU-licensed exchange for your XRP
6.05 billion XRP flowed onto exchanges in 30 days
Alongside the crossover runs a move that points the other way. According to data from the analytics firm CryptoQuant, which Cointelegraph analysed on October 20, around 6.05 billion XRP flowed onto the observed trading venues in the 30 days to October 19. That is the highest reading since March. Binance alone accounted for roughly 2.46 billion tokens, or 40.7 percent.
What does that mean? Tokens that move onto an exchange sit there ready to sell. Nothing is necessarily sold as a result, and CryptoQuant itself names simply higher trading activity and reshuffling between wallets as possible reasons. But the supply that can hit the market at any moment is growing. For price formation it is exactly that supply that counts, not the balance in cold wallets.
Where things stand since October 21: whales out, exchanges full
On Tuesday we measured the other side of this: the outflows of large addresses from Binance stood at $49.7 million on a 90-day average, the lowest level in five years. Little has changed in the picture since then, and the combination is the genuinely notable part: large holders are taking less off the exchange than at any time in five years, while others are pushing more onto it than at any time since March.
The price has barely moved over those two days. XRP stood at $1.33 on October 21 and at around $1.32 on Friday morning, with a daily range between $1.30 and $1.33. Two strong opposing forces that cancel each other out produce exactly this picture: plenty of movement below the surface, little in the price.

The narrow support band sits at $1.286 and $1.280
Two levels follow from the crossover, and they lie close together, which makes them usable for the coming weeks. The 100-day average stands at $1.286, the 200-day average at $1.280. Between them there are 0.6 cents, or 0.49 percent. From the current price it is 2.99 percent down to the upper edge of that band.
A band like this matters because many automated trading systems align their orders with exactly these two lines. If the price holds above it, the picture of recent weeks stays intact. If it falls below and closes there, the crossover is effectively void again at once, because the new low then pulls the 100-day average down faster than the more sluggish 200-day average.
The last daily close below the 100-day average was on August 20 at $1.1051. XRP has been above it without interruption since then. That run is the real piece of information, not the crossover itself.
The 50-day average at $1.41 is the next resistance
On the upside, the shortest of the three lines stands in the way. The 50-day average sits at $1.4127, which is 6.24 percent above the current price. That line has been falling since the start of October because the strong September days are running out of its window one by one. If the price and the 50-day average keep converging, they meet arithmetically somewhere around $1.36 to $1.38.
For the range, some context: the series high is $2.6455 from October 27, 2025, the series low $0.9927 from August 17, 2026. XRP sits almost exactly in the middle of those two extremes today, and that explains why the long averages are meeting right now.
Compare MiCA-regulated crypto exchangesHow to work out the gap to the 100-day average yourself
The calculation needs no tool and no subscription. Take the daily closes of the last 100 days, work out the mean, and divide the current price by that mean. A value above 1 means the price sits above the line. For October 23 that gives 1.3245 divided by 1.286, or 1.0299, a gap of 2.99 percent.
Two things matter here. First, take daily closes in one currency and from one source, otherwise you are mixing time zones and quotations. Second, check whether your series has gaps. Many free data sources deliver two values on some days and none at all on others, and the window shifts straight away. We cleaned our series down to exactly one value per calendar day before the calculation, otherwise the crossover would have slipped by a day.
Ripple backs the SEC rules, XRP's status stays open
Alongside the chart picture, the regulatory thread runs on. Ripple filed a 20-page comment on the draft rule Regulation Crypto Assets with the US Securities and Exchange Commission on October 20, the end of the comment period, Crypto Briefing reports. The core of the argument: an investment contract over a token does not automatically make the token itself a security. Ripple's chief legal officer Stuart Alderoty puts the cost of the legal clarification so far at more than $150 million.
For the price that changes nothing for now, and that is exactly the point where many reports go too far. The SEC has not adopted the rules; it is evaluating the submissions. A company's comment letter is not an administrative act. Deriving a change of status for XRP from it reads more into the document than is there.
For investors in Germany the US rule is not the governing framework anyway. MiCA applies here, and the practical consequence is a different one: the venue you buy through needs a licence in the EU. Which providers hold that licence and what they charge is in our comparison of crypto exchanges.
Holding period, custody and tax: what counts in Germany
Three points count concretely now. The first concerns the holding period. Investors who keep XRP in their own holdings for more than a year can so far take the gain tax-free in Germany. If tokens are shifted back and forth these days, the clock starts again for the quantity sold. Where the reform currently stands is summarised in our overview of the holding period.
The second point is custody, and it hangs directly on the 6.05 billion tokens on exchanges. What sits on a trading venue does not belong to you legally in the same way as a balance in your own wallet. If you do not intend to trade, there is nothing to gain on the exchange and a counterparty risk to carry. Which devices are suitable and what they cost is shown by our hardware wallet comparison.
The third point is documentation. Every transfer between exchange and wallet creates an entry that the tax office will later want to follow. If you reshuffled in October, it is better to pull the records together now than in the spring.
Our reading of the crossover
From the newsroom's point of view, the crossover of October 21 is a calendar effect and not a demand signal. Our own numbers support that: the 100-day average rose 2.93 percent since October 8 while the price gave up 6.78 percent, and the swap inside the window, with a difference of 24.4 cents per day, explains the entire move. Against it stands the fact that crossovers like this are traded by automated systems and can therefore have an effect of their own, short-lived though it may be. Add to that the band at $1.286 and $1.280, which does exist as a support line, however it came about.
What would tip that reading can be named: a daily close above $1.41, meaning above the 50-day average, or a clear drop in exchange inflows below the level of mid-August. Both are measurable, and both are outstanding for now. On October 28 the US Federal Reserve also decides on the policy rate, and experience says that date moves the whole market more than any moving average.
XRP at $1.32: the crossover alone brings no demand
- Write down the two levels of $1.286 and $1.280 and check at the end of the month whether XRP has stayed above them. If the price falls below and closes there, the crossover is done. If you are looking for an EU-licensed exchange for that, you will find one in our exchange comparison.
- Go through your holdings and separate what you want to trade from what is meant to sit still. The part that sits still belongs in your own custody, and the hardware wallet comparison names the devices along with their prices.
- Pull your October transactions together now, while the records are at hand. The tools for that are in our comparison of tax software.
(As of October 23, 2026. This article is not investment advice. Prices and fee structures change; check the terms with the provider before you buy.)
Frequently asked questions about XRP
Partner links: some links on this page are partner links. If you become a customer through one of them, we may earn a commission at no extra cost to you. Selection, ratings and ranking are decided independently by our editorial team. Ethics and Independence · Ownership and Funding
Transparency note: This article was produced with the assistance of artificial intelligence and reviewed by our editorial team before publication. All figures and claims were checked against the primary sources linked in the text. The feature image was generated with AI.
More on XRP: All XRP news at a glance
Related articles
- Bitcoin price at $73,700: outflows from BlackRock's IBIT show no sign of stopping
- Bitcoin price prediction: lowest level since August, will the $72,000 zone hold?
- Solana price prediction: OKX open interest up 24 percent as SOL breaks below its 200-day average
- Bitcoin slips below Strategy's $75,451 cost basis as Saylor's 849,327 BTC go underwater
- XRP price prediction: Korea drives 17 percent of Upbit trading, and $1.08 is the level that decides
Which topics should we dive deeper into?
Select what genuinely interests you. Your picks feed directly into our editorial planning.
Crypto news that's actually worth your time.
Weekly. 60 seconds. Carefully curated by our editors: no hype, no promo flood, no spam.

November 9, 2026 5:13 AM

Bitcoin price holds $74,800 as the 200-day average at $73,170 faces US inflation data
Analysis: Bitcoin starts the week at around $74,800 after briefly dropping to $73,477 on Sunday evening, its lowest level since August 21. The 200-day moving average sits just below, and US inflation data is due on Tuesday.
November 8, 2026 3:12 PM

Solana staking yields 5.2 percent while SOL has lost 19 percent in 30 days
Analysis: Staking SOL currently earns around 5.2 percent a year, but the price has lost 19.2 percent in 30 days. Since October 9, holders have also pulled 4.8 million SOL out of staking, while the price is clinging to the 200-day line at $89 on Sunday.

November 7, 2026 11:39 PM
Can XRP reach $100? The maths as of November 2026
At $100 per XRP, the coin would need to be worth around $6.34 trillion, more than the entire crypto market today. We run the numbers with price, circulating supply and the all-time high, and show which price targets are closer.
November 7, 2026 3:15 PM

Solana Price Prediction: China's Central Bank Targets the Shanghai Campaign. What Now for SOL?
Analysis: China's central bank has classified the Solana promotion in Shanghai as illegal financial activity and is investigating the firms that helped run the tour. SOL holds its 200-day line at $89.98 on Saturday, but the Solana blockchain now carries $1.6 billion less in stablecoins than 30 days ago.
November 7, 2026 9:13 AM

Dogecoin Price at $0.072 in a Death Cross: When Will DOGE Rise Again?
Since October 29, Dogecoin's 50-day moving average has been below its 200-day line. Our analysis shows why the signal comes late, which levels at $0.0760 and $0.0690 matter, and what November 2025 buyers in Germany should know before their holding period ends.
November 6, 2026 9:19 PM

Bitcoin price prediction: $430 million outflow pushes the 2026 ETF balance below zero
Analysis: US bitcoin ETFs lost $869.8 million in four trading days, and the balance for 2026 is back below zero. What the outflows reveal about the price at $75,800, which levels count until the end of November and what investors in Germany can make of it.

November 6, 2026 7:17 PM

Ethereum price prediction: 986,847 ETH queue to stake while only 4,320 ETH wait to exit
Close to one million ether is waiting to enter staking, while only 4,320 ETH want out. What that ratio says about ether at $2,229, which levels matter until the end of November and what stakers in Germany need to know about tax.
November 6, 2026 3:25 PM

Solana Price Prediction: Only $1.2 Million in ETF Outflows, Even Though Holders Are Under Water
Analysis: Solana fell 6.5 percent on Thursday, yet only $1.18 million left the US spot ETFs. Investors have paid in $1.467 billion since launch, while the funds' holdings are now worth $1.333 billion.
November 6, 2026 9:14 AM

Bitcoin Cash price drops 7.4 percent to $264, its lowest level since September 21
Bitcoin Cash has fallen to around $264, its lowest level since September 21, and is now holding only the 100-day line at $261. The decline follows a sell-off across the entire crypto market, amplified by liquidations of more than $1 billion.
November 6, 2026 7:19 AM

XRP Price Drops to $1.20 and Below Its 200-Day Line: What Is Going On With XRP?
XRP loses 8.3 percent and trades at its lowest level since August. The Wall Street sell-off meets ETFs without inflows and a surplus of long accounts in the futures market.
November 6, 2026 5:22 AM

Bitcoin price at $75,700: BTC trades below its 100-day line ahead of the US jobs report
Context: Bitcoin starts Friday at $75,692, a good $5,000 below Thursday's high and under its 100-day line. The US jobs report for October follows at 2:30 p.m. German time, and it will decide whether the 200-day line at $73,200 becomes the next target.
November 6, 2026 1:27 AM

Is Aerodrome Finance a Good Buy at Current Prices?
Aerodrome Finance has lost about a third since mid-October and is now testing its 200-day average. Whether AERO is a good buy at current prices comes down to a few key levels.
November 6, 2026 1:17 AM

Chainlink Price Falls 7.6 Percent as Long Bets Grow: Will $10.26 Support Hold?
Chainlink lost 7.6 percent on November 5, falling to $10.69 as the Nasdaq sell-off dragged crypto lower. Yet on OKX the number of long accounts rose to as many as 2.59 per short account, and the 200-day line at $10.06 is moving closer.
November 5, 2026 7:14 PM

Solana Price Prediction: SOL Sits on Its 200-Day Line as DEX Volume Hits $2.39 Billion
Solana trades at $89.19 on Thursday evening, right on its 200-day moving average at $88.93. Volume on decentralised exchanges on the Solana blockchain rose 26.8 percent on the same day, while network fees are 40 percent below the previous month.
November 5, 2026 2:09 PM

XRP Price Prediction: Down 7 Percent Against Bitcoin, Why the Ratio Says More Than the Price
XRP sits exactly on its 20-day average, but against Bitcoin the coin has lost more than 7 percent in 30 days. Why the ratio to Bitcoin says more than the dollar price right now and which levels count for the XRP price prediction.
November 5, 2026 1:09 PM

Cardano Price Prediction: Down 26.5 Percent in 30 Days, the Levels ADA Must Hold Now
Cardano lost 26.5 percent in 30 days, four times as much as Bitcoin. Now the 20-day and 200-day averages sit almost at the same price right above the market. Why this zone decides and which scenarios follow for ADA.
November 4, 2026 3:15 PM

Solana price prediction: SOL tests the 200-day line at $88.88 ahead of Breakpoint London
Analysis: eleven days before the Breakpoint conference in London, Solana fell to $89.77, almost touching its 200-day moving average. Our review of the last three conferences shows how strongly the price moved before and after.
November 4, 2026 11:18 AM

Bitcoin price prediction: DVOL drops to 37 after the election, will the 100-day line hold?
Analysis: after the US election night, the DVOL volatility index has fallen from 40.89 to 37.03 points. What the options market expects for the 100-day line at $76,663 ahead of Friday's $2.46 billion expiry.
November 2, 2026 9:36 PM

Bitcoin price prediction: $295 above the 100-day line, the level that decides
Analysis: the daily low was $295 above the 100-day line at $76,035. Four trading days before the US midterm elections and with an 82.6 percent rate expectation for December, this gap will decide the coming weeks.
November 2, 2026 7:30 PM

Chainlink slips below its 100-day line as long bets shrink by a third
Analysis: Chainlink trades at $11.11 and falls below its 100-day line at $11.36. At OKX the long-short ratio has dropped from 3.18 to 2.10 since October 24, and the 200-day line sits at $10.03.
November 2, 2026 7:13 PM

Solana price prediction: 1,000 days without an outage, will the 200-day line at $89 hold?
Analysis: the Solana blockchain has run without a halt since February 6, 2024, and on November 2 the streak reaches exactly 1,000 days. The price still falls to $92.78, its lowest since August; we show which levels matter now and why technology alone does not carry the price.
October 30, 2026 6:37 PM

XRP price prediction: will the price rise after $8.4 million of inflows?
Analysis: the US XRP funds took in a net $8.43 million on Thursday, the strongest daily figure of October. Why that sum still barely moves the price and which two levels count now.
October 29, 2026 9:33 AM
Bitcoin Cash falls below $286: the 200-day line that decides the trend
Bitcoin Cash loses almost 6 percent to $279.87 and slips below its 200-day line at $286.19. The trigger is the Fed rate pause of October 28, at which two members even voted for an increase.
October 28, 2026 1:00 PM

XRP price prediction: the $1.29 zone decides, not the escrow release
Analysis: another Ripple escrow contract expires on November 1, and every time the question is whether the fresh supply weighs on the price. We laid the twelve releases of the past year against the price, and the result is more sober than the expectation.
October 26, 2026 9:32 PM

Ethereum price prediction: the 200-day line is the level that decides
Analysis: Ethereum trades at $2,308 on Monday evening and falls for the fourth day in a row, below the 200-day average of $2,329 for the first time since August 20. Price, averages and the Fed date on Wednesday are documented; the editorial team's assessment stands separately in the text.

October 7, 2026 8:42 PM
Can XRP Price Reach $10? Here Is What the Math Says
XRP trades near $1.42 after losing $1.50. We check the $10 forecasts, the charts and the market cap math to see if XRP can really reach $10.
October 5, 2026 4:33 PM

Cardano at a three-month high, the golden cross fell on October 1: the last one ended 42.4 percent lower
ADA stands at $0.27, its highest in three months, and the trade press traces the jump to a golden cross. Our own analysis of 721 daily candles shows two things the reports miss: the signal is four days old, and the last one ended 42.4 percent lower.
More from CryptoTicker