
Bitcoin Chart Analysis: Price, Key Levels and the Week Ahead
This week's Bitcoin chart analysis: where the price stands against its 50- and 200-day averages, which levels act as support and resistance and what will decide the week. Updated every Monday with our own charts built from CoinGecko data.


Which topics should we dive deeper into?
Select what genuinely interests you. Your picks feed directly into our editorial planning.
Crypto news that's actually worth your time.
Weekly. 60 seconds. Carefully curated by our editors: no hype, no promo flood, no spam.
Bitcoin Chart Analysis Week 47/2026: Price drops below both averages and tests its 90-day low
Updated November 16, 2026. According to CoinGecko, Bitcoin traded at $64,389 on Monday afternoon, 13.8 percent below its level a week earlier.
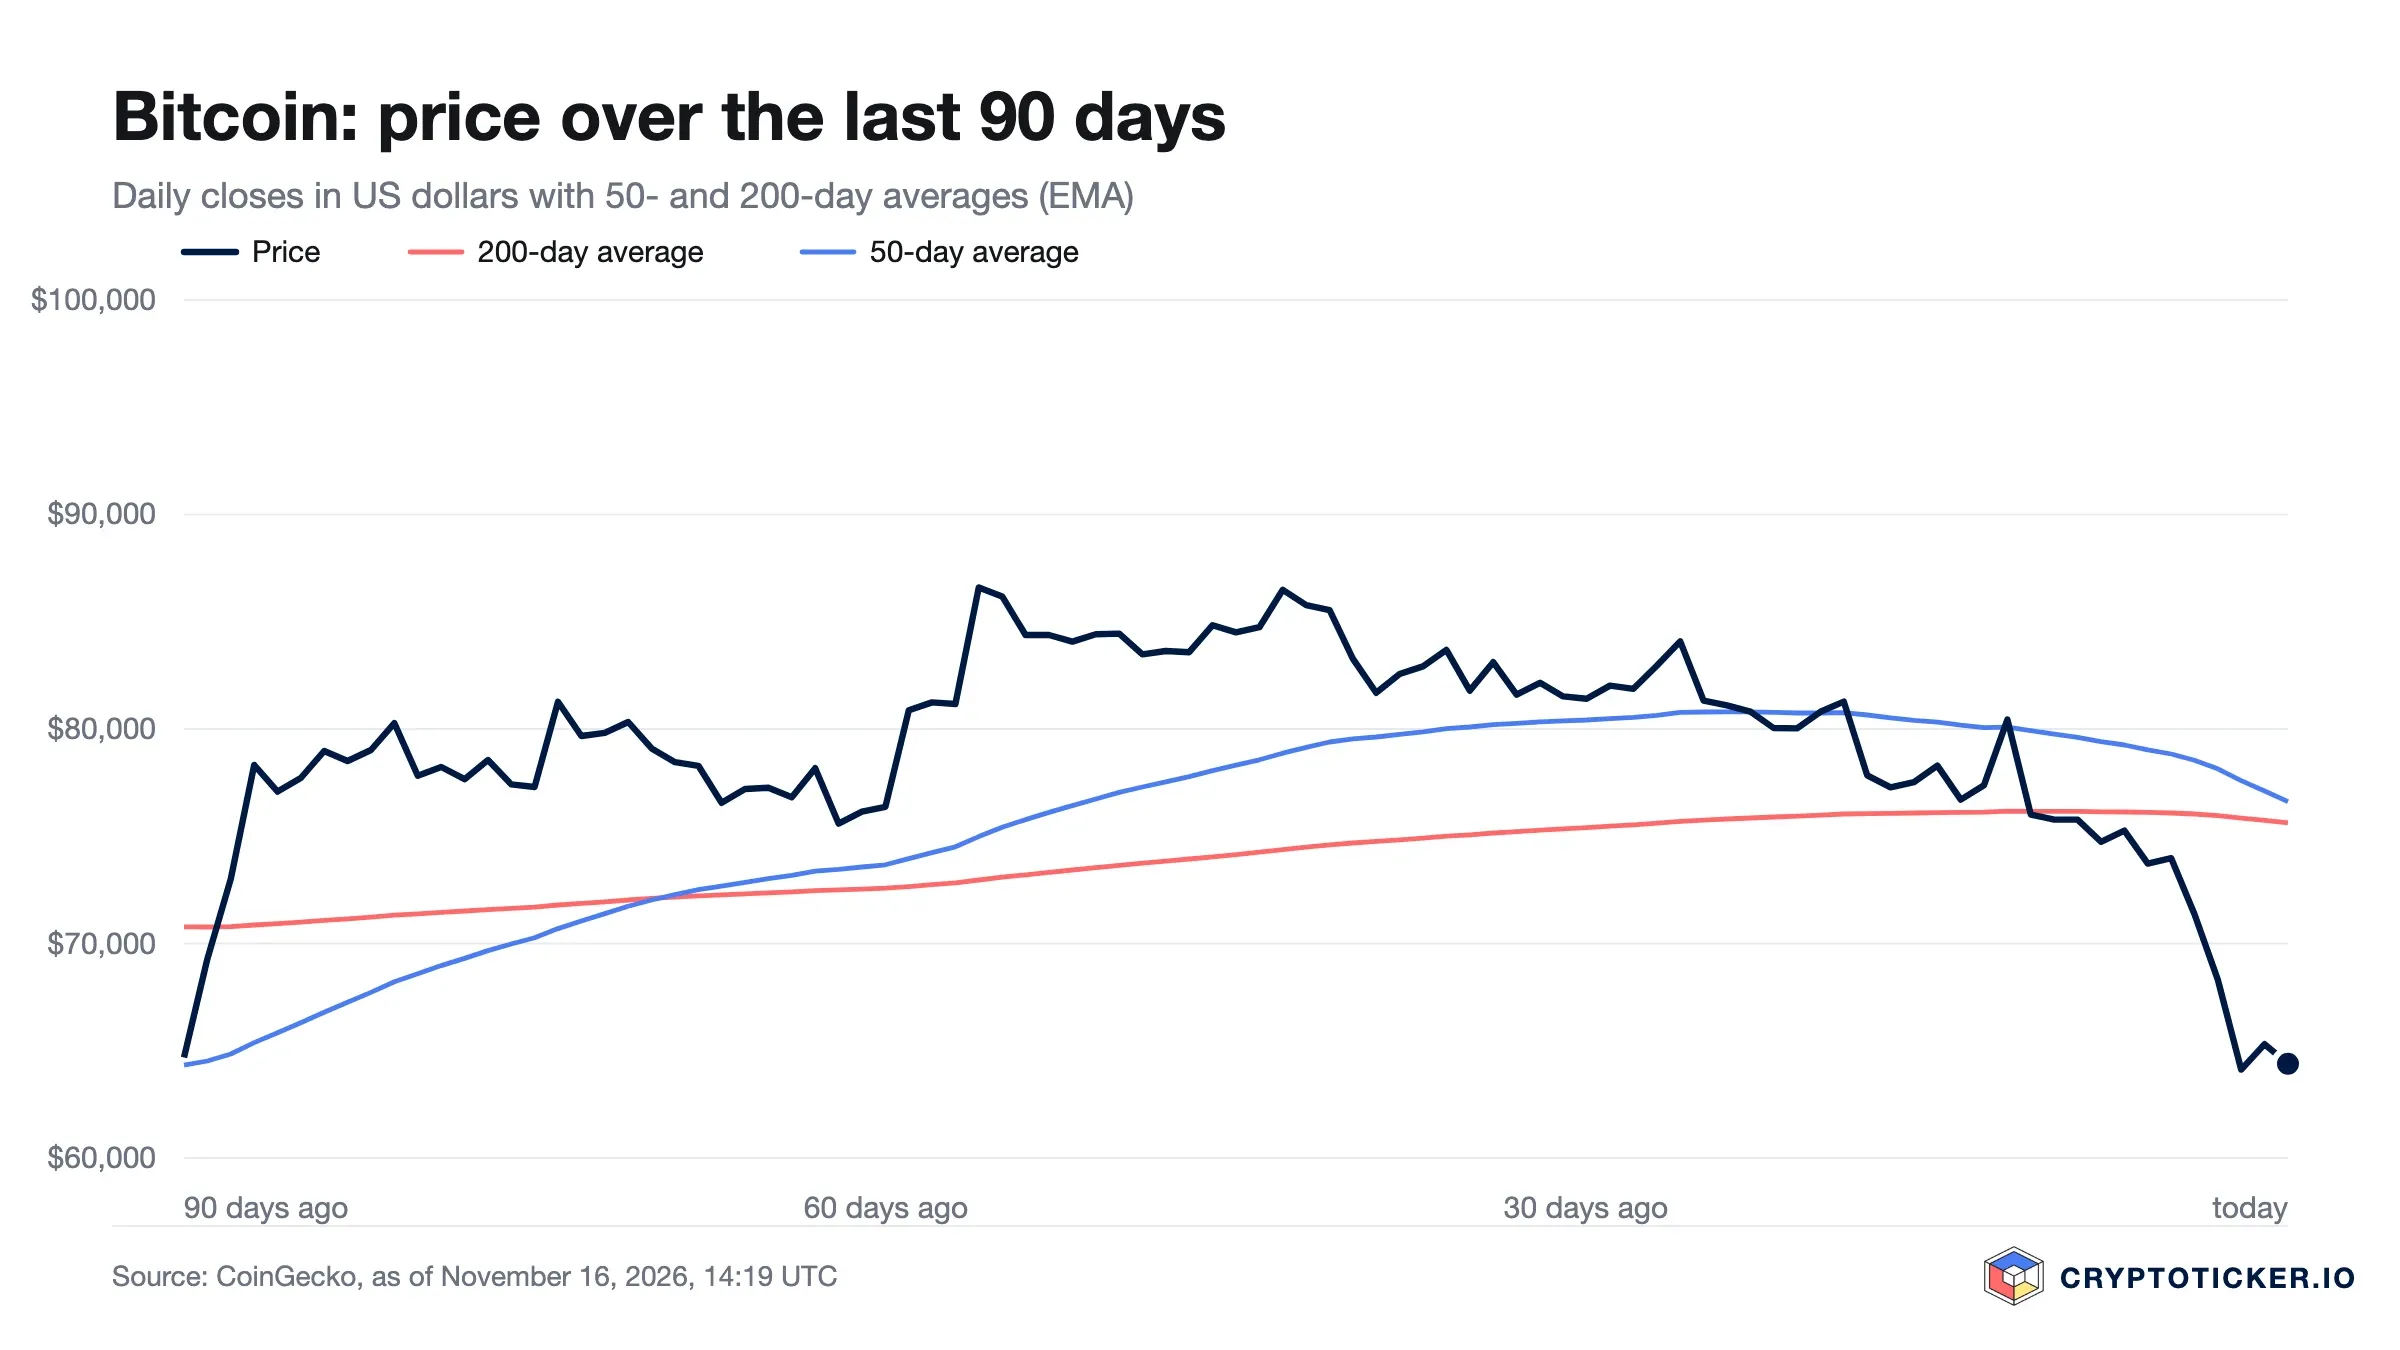
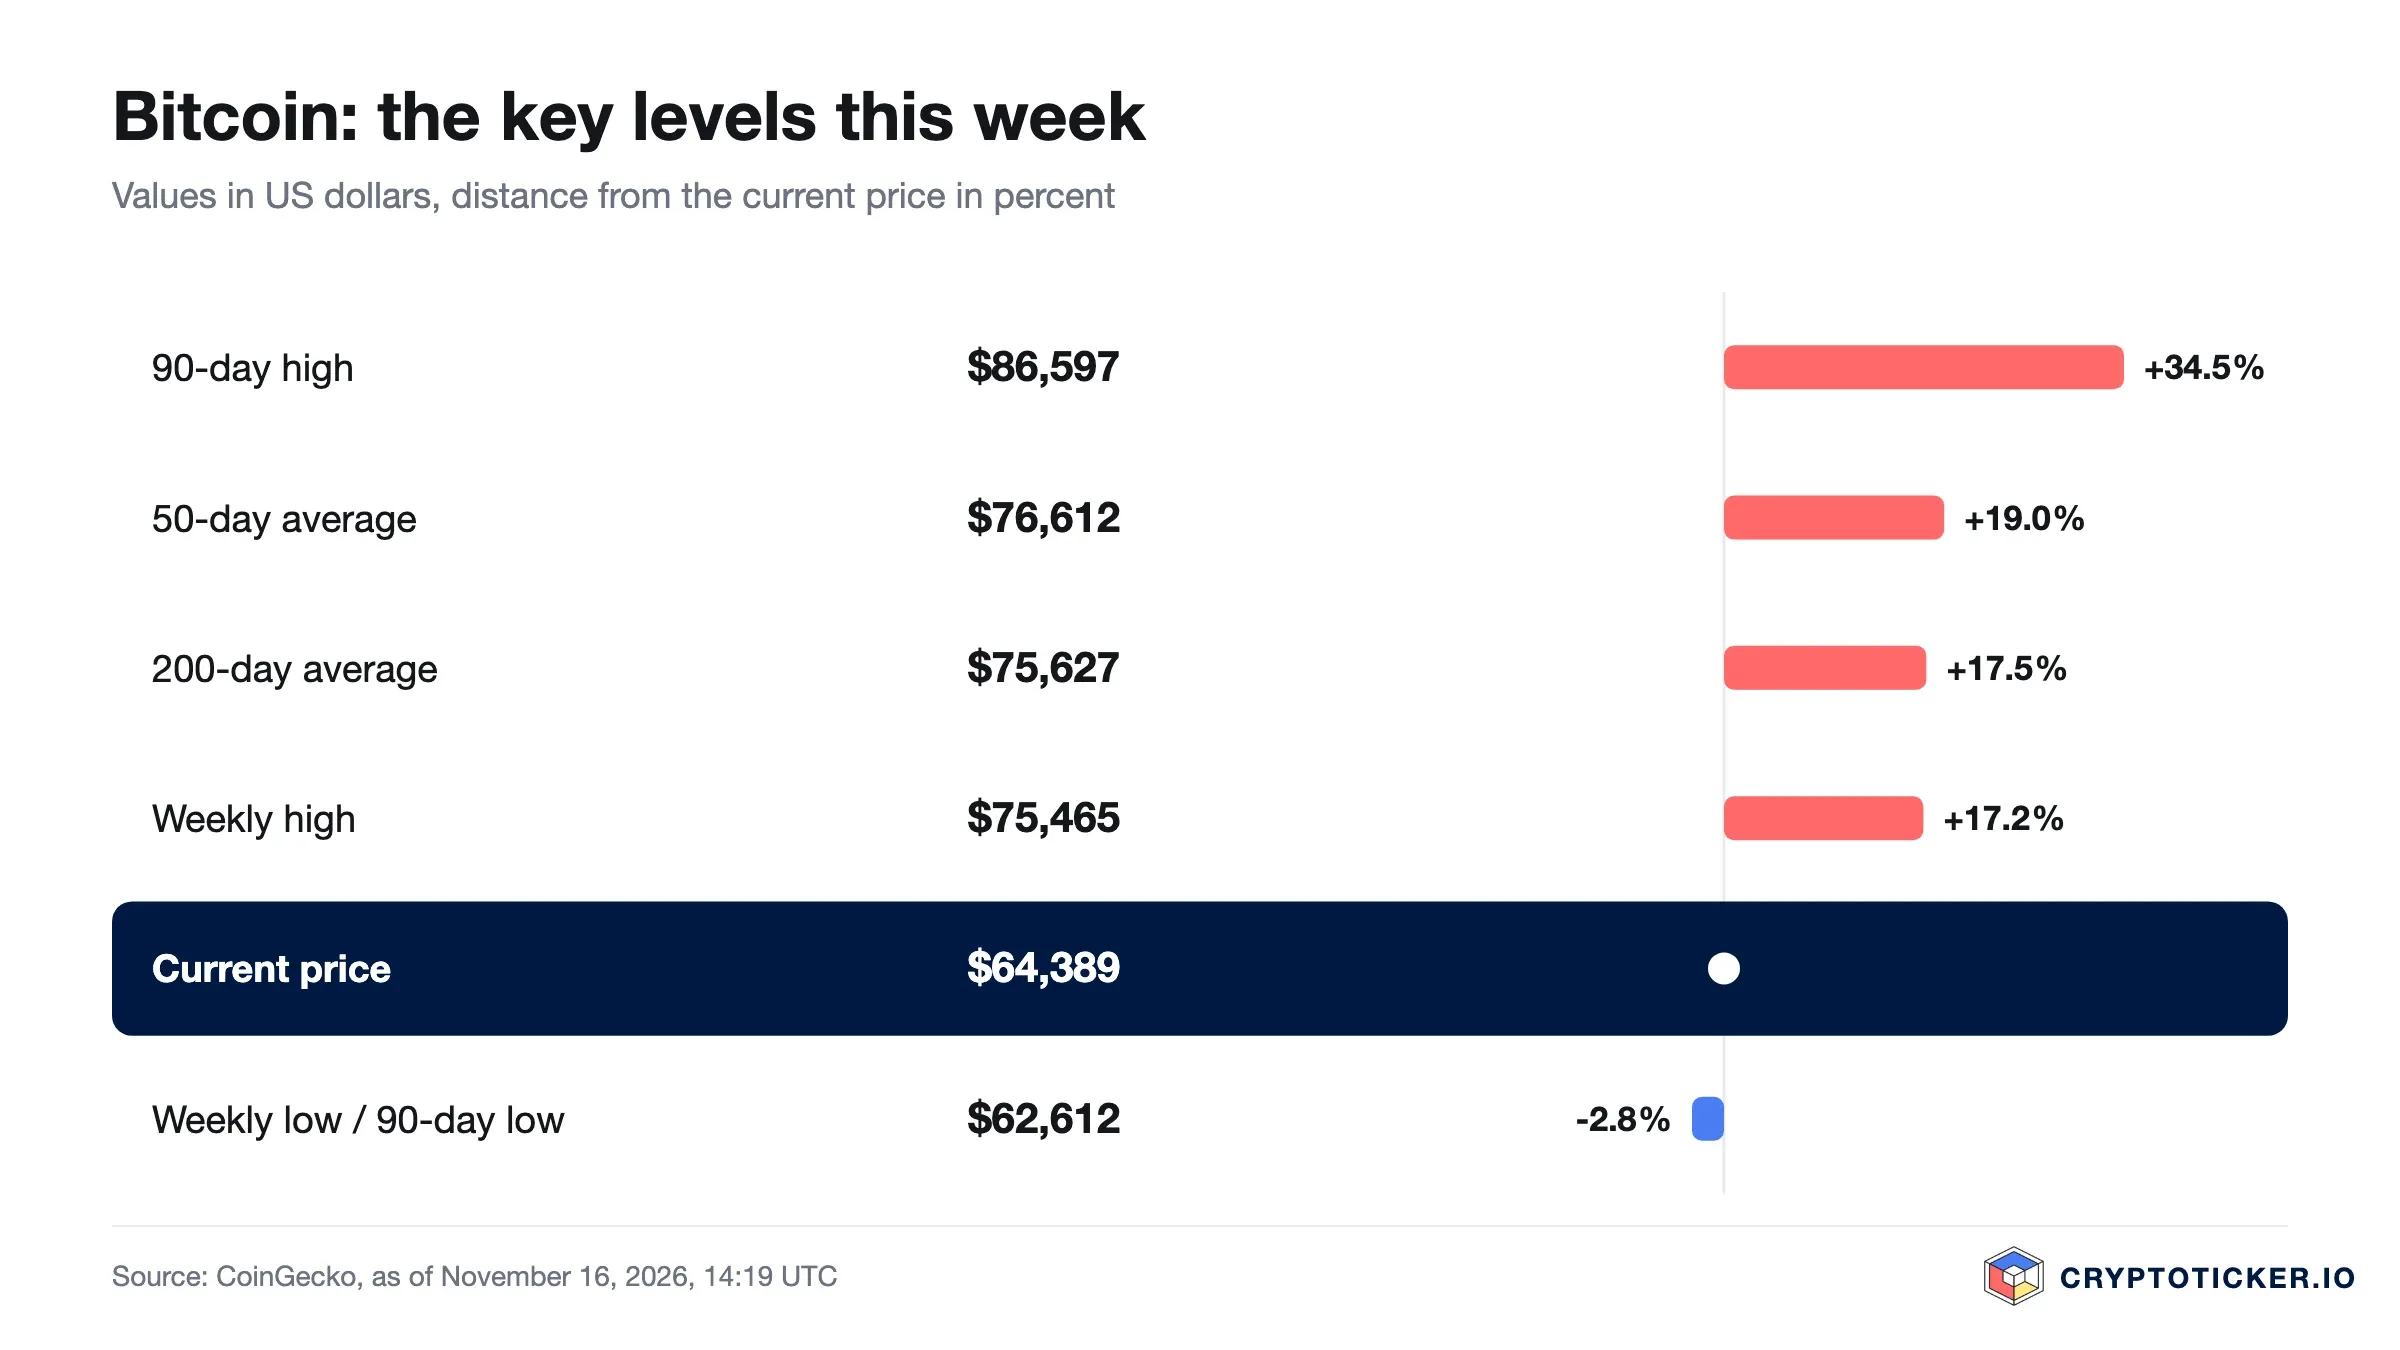
One week has turned the chart around. Last Monday Bitcoin still cost $74,659, just below the 200-day exponential moving average (EMA) that now stands at $75,627. Since then the price has fallen through both moving averages: the 50-day average at $76,612 now sits 19.0 percent above the price, the 200-day average 17.5 percent. The weekly low of $62,612 is also the lowest level of the past 90 days. The daily value last sat above the 200-day average on November 5.
The 50-day average is still slightly above the 200-day line, a golden cross that has held since September 9. Both lines are turning lower, however, and the gap between them has narrowed to about $1,000. If prices stay at this level, the shorter line could slip below the longer one within days. Chart analysts call that pattern a death cross.
Two levels matter this week. To the downside, the weekly low at $62,612 is the first support, about 2.8 percent below the current price; below it lies the lowest daily value of the past twelve months, $58,566 on July 1. To the upside, the weekly high at $75,465 is the first major hurdle, with the 200- and 50-day averages just above it between $75,600 and $76,600. Only a daily close above that band would break the downtrend.
The calendar adds weight: Nvidia reports quarterly results after the US close on Tuesday (Nvidia announcement), the Federal Reserve publishes the minutes of its October meeting on Wednesday at 2 p.m. ET, and Bitcoin options expire on Deribit on Friday morning. Our longer-term scenarios are in the Bitcoin price prediction.
 Crypto exchanges compared: fees, coins and licences
How to read this Bitcoin chart analysis: trend, averages and key levels
This Bitcoin chart analysis follows the same rules every week, so the weeks can be compared with each other. It is based on daily closing prices from CoinGecko in US dollars over one year and on hourly prices for the past seven days. From these we calculate two moving averages and read off the levels where the price has recently turned.
- 200-day average: the long-term trend. Above it the market is considered intact, below it damaged.
- 50-day average: the medium-term trend. It reacts faster and shows whether a move has staying power.
- Weekly high and low: the range of the past seven days from hourly prices, often the first resistance and the first support.
- 90-day high and low: the range of a quarter, which larger buyers and sellers watch.
We use the exponential moving average (EMA), which gives more weight to recent prices than a simple average. When the 50-day average crosses above the 200-day average, chart analysts speak of a golden cross; when it crosses below, of a death cross. Both signals come late because averages follow the price. To trade Bitcoin, compare providers, fees and licences in our crypto exchange comparison.
Weekly Bitcoin chart analysis: what it can do and where it stops
Technical analysis describes where buyers and sellers last met. It does not predict what happens next. A level holds as long as enough market participants trade there. News such as a Federal Reserve decision, large flows into or out of the Bitcoin ETFs or a hack at a major exchange can override it within minutes. That is why this page shows levels and their distance from the price, but no price targets.
Every Monday a new section with the week's numbers is added at the top, and the key findings of earlier weeks stay listed below it. This shows at a glance how trend and levels have shifted from week to week. Charts and figures carry their timestamp.
If you trade on the back of this analysis, choose an exchange licensed under the EU's MiCA regulation. Which providers hold a licence and what they charge is shown in our comparison of regulated crypto exchanges. Cryptocurrencies are highly volatile, and this page is not investment advice.
Partner links: some links on this page are partner links. If you become a customer through one of them, we may earn a commission at no extra cost to you. Selection, ratings and ranking are decided independently by our editorial team. Ethics and Independence · Ownership and Funding
Created with AI assistance. Editor: Dennis Weidner. The feature image was generated with AI. How we use AI
For later? Save this article and find it again in your profile.
Related articles
Which topics should we dive deeper into?
Select what genuinely interests you. Your picks feed directly into our editorial planning.
Crypto news that's actually worth your time.
Weekly. 60 seconds. Carefully curated by our editors: no hype, no promo flood, no spam.

November 13, 2026 5:19 PM

Bitcoin price slides to the 200-week moving average after US producer prices
After the US producer prices for October, bitcoin falls to around $68,100 and now sits barely above the 200-week moving average. Which figures explain the slide, how often the line gave way in 2026 and which levels matter now.
November 12, 2026 5:42 PM

Bitcoin price falls below $72,000: the reasons behind the drop
Bitcoin fell below $72,000 and its 200-day moving average on Thursday, its lowest level since August 20. The Nvidia CEO's resignation, MSCI's removal of Strategy, ETF outflows and rate worries all hit on the same day.
November 11, 2026 5:13 AM

Bitcoin price at $73,700: outflows from BlackRock's IBIT show no sign of stopping
Analysis: Bitcoin trades at around $73,700 on Wednesday morning, just above its 200-day moving average. BlackRock's bitcoin fund IBIT has lost money for seven trading days in a row, $1.66 billion in total, while equities rallied.
November 10, 2026 9:24 PM

Bitcoin price prediction: lowest level since August, will the $72,000 zone hold?
Analysis: bitcoin falls to its lowest level since August 20 after the US inflation data and tests the 200-day average at $73,150. What ETF outflows, the options market and the Fed mean for the zone between $72,000 and $75,000.

November 10, 2026 3:16 PM

US inflation runs hot: Bitcoin at $73,600 with stops in focus before December 9
Analysis: US consumer prices rose 0.4 percent in October, more than expected, and a Fed rate hike on December 9 now looks certain. Bitcoin slips to around $73,600 and trades just above its 200-day moving average.
November 9, 2026 11:17 AM

Bitcoin slips below Strategy's $75,451 cost basis as Saylor's 849,327 BTC go underwater
Analysis: Bitcoin trades at around $74,030 on Monday, below the $75,451 average price at which Strategy bought its 849,327 BTC. What the SEC filing reveals about the purchases, which levels matter now and how Bitcoin and Strategy shares are taxed in Germany.
November 9, 2026 5:13 AM

Bitcoin price holds $74,800 as the 200-day average at $73,170 faces US inflation data
Analysis: Bitcoin starts the week at around $74,800 after briefly dropping to $73,477 on Sunday evening, its lowest level since August 21. The 200-day moving average sits just below, and US inflation data is due on Tuesday.

November 7, 2026 9:13 AM

Dogecoin Price at $0.072 in a Death Cross: When Will DOGE Rise Again?
Since October 29, Dogecoin's 50-day moving average has been below its 200-day line. Our analysis shows why the signal comes late, which levels at $0.0760 and $0.0690 matter, and what November 2025 buyers in Germany should know before their holding period ends.
November 6, 2026 9:19 PM

Bitcoin price prediction: $430 million outflow pushes the 2026 ETF balance below zero
Analysis: US bitcoin ETFs lost $869.8 million in four trading days, and the balance for 2026 is back below zero. What the outflows reveal about the price at $75,800, which levels count until the end of November and what investors in Germany can make of it.
November 6, 2026 9:14 AM

Bitcoin Cash price drops 7.4 percent to $264, its lowest level since September 21
Bitcoin Cash has fallen to around $264, its lowest level since September 21, and is now holding only the 100-day line at $261. The decline follows a sell-off across the entire crypto market, amplified by liquidations of more than $1 billion.
November 6, 2026 5:22 AM

Bitcoin price at $75,700: BTC trades below its 100-day line ahead of the US jobs report
Context: Bitcoin starts Friday at $75,692, a good $5,000 below Thursday's high and under its 100-day line. The US jobs report for October follows at 2:30 p.m. German time, and it will decide whether the 200-day line at $73,200 becomes the next target.

November 6, 2026 1:27 AM

Is Aerodrome Finance a Good Buy at Current Prices?
Aerodrome Finance has lost about a third since mid-October and is now testing its 200-day average. Whether AERO is a good buy at current prices comes down to a few key levels.
November 6, 2026 1:17 AM

Chainlink Price Falls 7.6 Percent as Long Bets Grow: Will $10.26 Support Hold?
Chainlink lost 7.6 percent on November 5, falling to $10.69 as the Nasdaq sell-off dragged crypto lower. Yet on OKX the number of long accounts rose to as many as 2.59 per short account, and the 200-day line at $10.06 is moving closer.
November 5, 2026 9:12 PM

Solana Price Slides to $89, First Test of the 200-Day Line Since August
The Solana price fell 6.4 percent to around $89 on November 5 and touched its 200-day line for the first time since August. A chip sell-off on the Nasdaq set it off, amplified by more than $1 billion in liquidations and ongoing ETF outflows.
November 4, 2026 11:18 AM

Bitcoin price prediction: DVOL drops to 37 after the election, will the 100-day line hold?
Analysis: after the US election night, the DVOL volatility index has fallen from 40.89 to 37.03 points. What the options market expects for the 100-day line at $76,663 ahead of Friday's $2.46 billion expiry.
November 4, 2026 5:23 AM

Bitcoin price at $76,947: after election night, the $75,740 low is the line to watch
By Wednesday morning, Bitcoin (BTC) had recovered half of its US election-night slide and stood at $76,947. Which levels matter now, and why purchases from November 2025 become tricky for German taxpayers this week.
November 3, 2026 5:15 AM

Bitcoin price at $76,887: BTC slips to its 100-day line on US election day
Bitcoin falls to its 100-day average of around $76,540 on the morning of the US election and briefly trades below it for the first time since August. For German buyers from November 2025, the one-year holding period ends at the same time, with consequences for offsetting losses.
November 2, 2026 9:36 PM

Bitcoin price prediction: $295 above the 100-day line, the level that decides
Analysis: the daily low was $295 above the 100-day line at $76,035. Four trading days before the US midterm elections and with an 82.6 percent rate expectation for December, this gap will decide the coming weeks.
November 2, 2026 7:30 PM

Chainlink slips below its 100-day line as long bets shrink by a third
Analysis: Chainlink trades at $11.11 and falls below its 100-day line at $11.36. At OKX the long-short ratio has dropped from 3.18 to 2.10 since October 24, and the 200-day line sits at $10.03.
October 31, 2026 9:46 AM

Bitcoin Price Crash Continues: BTC Slips Below $78,000, Here Is the Next Target
Bitcoin price crashes below the key $78,000 area as selling pressure builds. We analyze the chart and reveal the next short-term target for BTC.
October 29, 2026 9:33 AM

Bitcoin Cash falls below $286: the 200-day line that decides the trend
Bitcoin Cash loses almost 6 percent to $279.87 and slips below its 200-day line at $286.19. The trigger is the Fed rate pause of October 28, at which two members even voted for an increase.
October 25, 2026 6:19 AM

Bitcoin Price $80,853: The Fed Statement Comes at 7 p.m. German Time This Week
Germany moved its clocks to winter time last night, the United States does not follow until November 1. For one week every US date shifts forward by an hour, and this is the week that carries the rate decision on Wednesday and the options expiry on Friday.
October 24, 2026 7:25 AM

Why bitcoin at $80,806 slipped below its 50-day line after 66 days: what matters now
Analysis: the bitcoin price stands at $80,806 on Saturday morning, 1.23 percent below its 50-day moving average of $81,807, which it had held for 66 days. What the four moving averages, the ETF outflows and the mining difficulty adjustment on October 29 mean for the coming trading days.
October 20, 2026 7:29 AM

Bitcoin price at $81,993 and a third narrow daily range in a row: will the $81,481 level hold?
Bitcoin stands at $81,993 on Tuesday morning, wedged between the 50-day line at $81,481 and the 20-day line at $83,242. Three daily ranges in a row came in below the 90-day median, and 3,624 Bitcoin in options expire at 8am UTC.
September 18, 2026 11:39 AM

Ethereum Price Prediction: Why ETH Is Closing In on $3,000
Ethereum is coiling between $2,400 and $2,600 with a rising 200 EMA underneath. Here is what the ETH chart says about $3,000.

More from CryptoTicker