
Bitcoin Price Prediction: BTC Is Sitting On The Line That Decides The Next Big Move
Bitcoin is knocking on the door of a key resistance zone. A clean break opens the path much higher, while losing a nearby floor risks a fast slide down.


Which topics should we dive deeper into?
Select what genuinely interests you. Your picks feed directly into our editorial planning.
Crypto news that's actually worth your time.
Weekly. 60 seconds. Carefully curated by our editors: no hype, no promo flood, no spam.
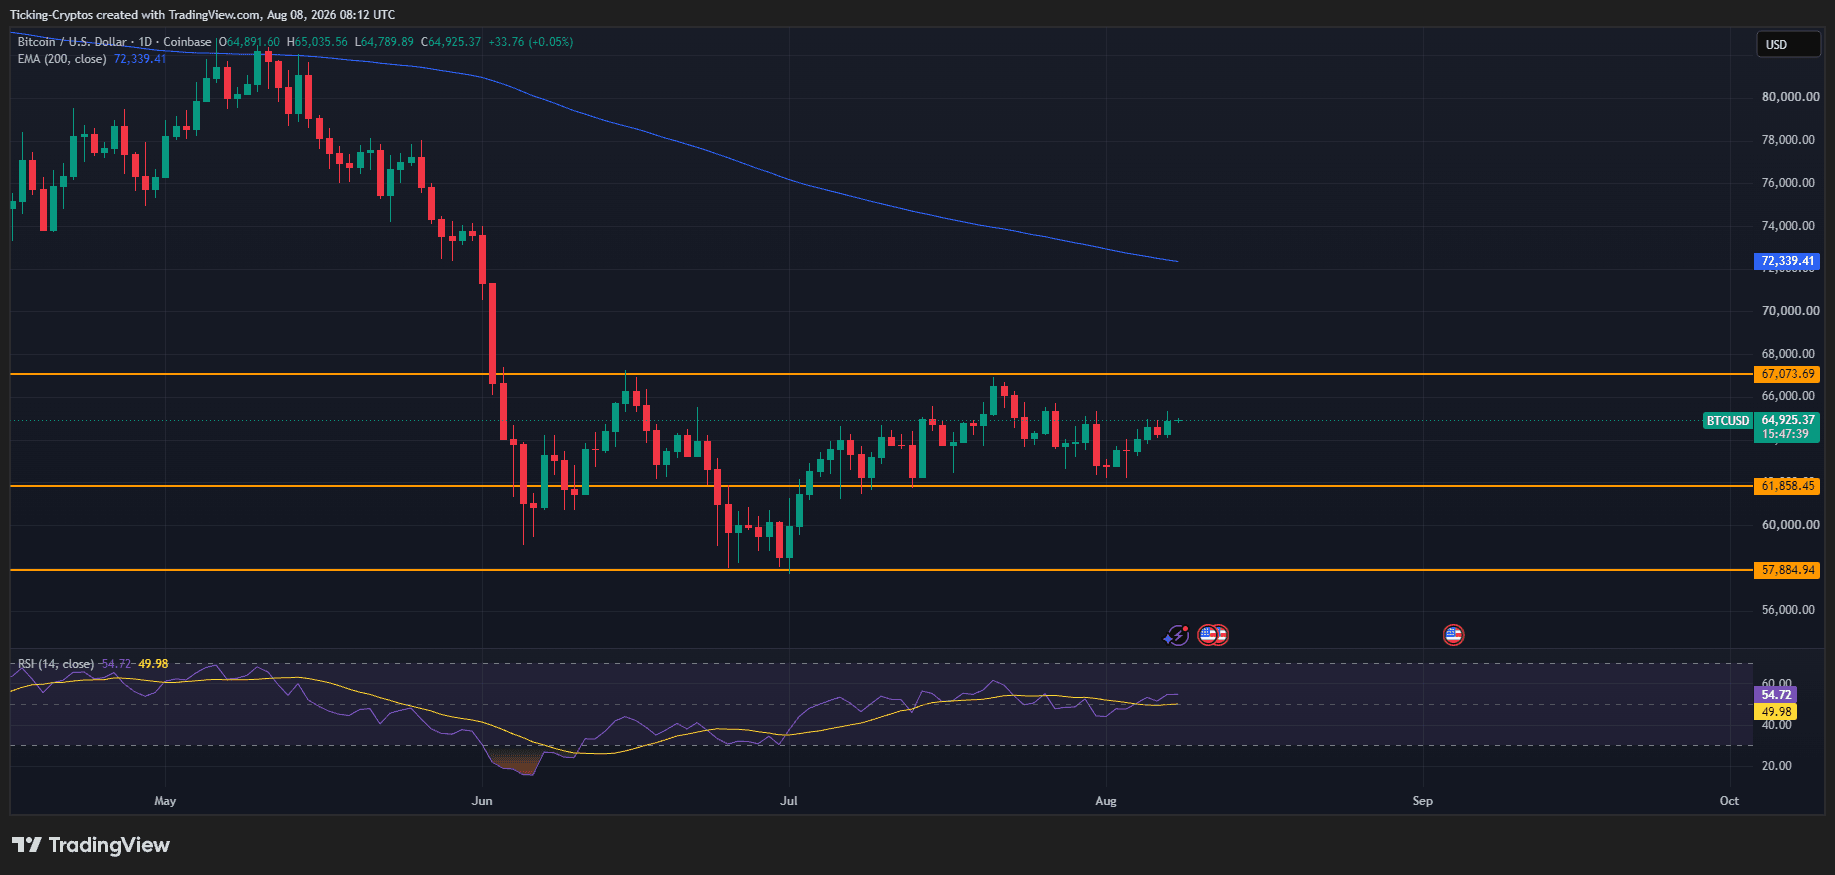
Bitcoin is trading around $64,925 on the daily chart, barely moved on the session at +0.05%. That flat close hides how tight the setup has become. Price is pressed up against the upper half of a two month range, and the levels above and below are close enough that the next daily candle could set the direction for weeks.
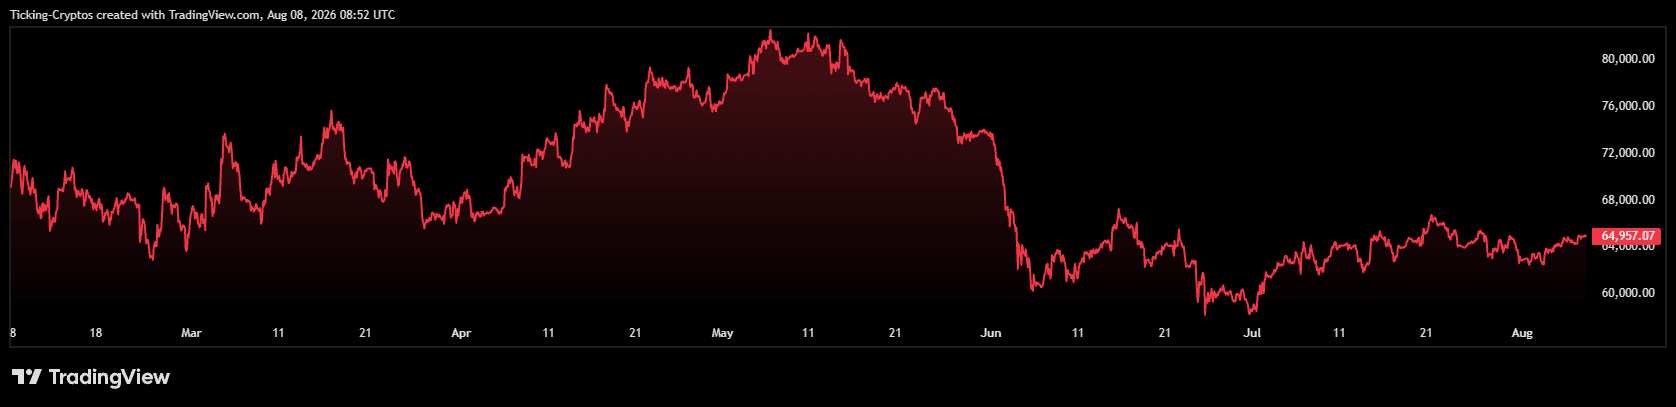
The chart has been range bound since the June breakdown. Bitcoin lost the low $70,000s in early June, dropped hard toward the high $50,000s in July, and has been grinding back up ever since. Now it is back at the top of that range with the same question in front of it: does resistance break, or does the range hold again?
Why Is $67,000 The Level Bitcoin Has To Break?
The $67,073 area is the single most important line on the daily chart right now.
- It capped the bounce in mid June after the crash.
- It capped the rally again in early August, where Bitcoin pushed toward it and got rejected.
- It sits directly above the current price, which means every bid from here is buying into known supply.
Two rejections from the same zone turn it into a reference point that both sides of the market are watching. $BTC coin is targeting it, and a daily close above it changes the structure of this chart.
Until that happens, the move off the July low is a range recovery, not a trend reversal.
What Happens If Bitcoin Breaks Above The Resistance?
A clean break and hold above $67,073 opens the door to $74,000.
That is not an arbitrary number. The $74,000 area is where the June sell off began, the origin of the large breakdown candle that took Bitcoin out of the low $70,000s. There is very little structure between $67,000 and $74,000 because the drop through that zone was fast and vertical. Price tends to move quickly back through areas it fell through quickly.
So the bull path is simple:
- Daily close above $67,073 confirms the breakout.
- $74,000 becomes the next meaningful target and the next major resistance.
- A retest of the broken $67,000 zone as support would strengthen the case.
One caveat worth keeping in mind: the 200 EMA sits at $72,339 and is still sloping down. Bitcoin would run into it on the way to $74,000. That makes the $72,000 to $74,000 band the real test of whether this is a genuine trend change or another lower high.
Where Does Bitcoin Go If $64,000 Fails To Hold?
The downside map is more detailed, and that is exactly why the $64,000 area matters.
If $Bitcoin cannot stay above $64,000, the sequence of supports below is:
- $61,858 first, the range floor that has been defended repeatedly since June.
- $60,000 next, the round number where the July basing action took place.
- $57,884 last, the July low and the deepest level on this leg.
Losing $61,858 would be the more serious signal. That line has held every meaningful test for two months. A daily close below it would turn the entire July recovery into a failed bounce and put the July low back in play.
What Do The Indicators Say About Bitcoin Right Now?
The momentum picture is neutral, and that is worth saying plainly instead of forcing a bias.
- RSI is at 49.98, sitting right on the midline. There is no overbought stretch to unwind and no oversold spring to load.
- RSI is below its own moving average at 54.72. Momentum has cooled since the early August push, even though price has held up.
- The 200 EMA at $72,339 is above price and declining. On a higher timeframe, Bitcoin is still in a downtrend.
That combination describes a market that has stopped falling but has not started trending. It is the classic profile of a range that resolves with a breakout, not a slow drift.

What Is Driving Bitcoin Right Now?
The macro backdrop is doing the heavy lifting this week. The July US jobs report came in far weaker than expected, with the economy shedding jobs against forecasts for solid growth and the unemployment rate ticking higher. Weak labour data pushes rate cut expectations forward, and futures markets moved to price in a meaningful chance that the Fed pauses at its September meeting.
Lower rates are generally supportive for risk assets, and Bitcoin caught a bid on the news. That is what carried price back toward the top of the range. Whether it is enough to break $67,073 is the open question, because the last time Bitcoin reached this zone it was rejected.
What Should Traders Watch Next?
The setup reduces to two lines and a bit of patience.
- Above $67,073 on a daily close: structure flips, $74,000 becomes the target, with the 200 EMA around $72,339 as the checkpoint on the way.
- Below $64,000: momentum shifts down, with $61,858, $60,000 and $57,884 as the levels in order.
- Between the two: the range is still the range. Chasing moves inside it has been punished repeatedly since June.
Volume on the breakout attempt matters more than the first candle that pokes through. A high volume daily close above resistance is a signal. A thin wick above it that closes back inside is the same rejection Bitcoin has already produced twice.
Frequently asked questions about the Bitcoin trading range in summer
Partner links: some links on this page are partner links. If you become a customer through one of them, we may earn a commission at no extra cost to you. Selection, ratings and ranking are decided independently by our editorial team. Ethics and Independence · Ownership and Funding
Transparency note: This article was produced with the assistance of artificial intelligence. Figures and claims are based on the primary sources linked in the text.
For later? Save this article and find it again in your profile.
More on Bitcoin: All Bitcoin news at a glance
Related articles
- Bitcoin Chart Analysis: Price, Key Levels and the Week Ahead
- Bitcoin price prediction: Mayer Multiple drops to 0.88, 11 percent below the 200-day line
- Bitcoin price prediction: lowest level since August, will the $72,000 zone hold?
- Bitcoin Price Prediction: BTC Sits on the $75,700 Cost Basis of Recent Buyers
- XRP Price Prediction: Down 7 Percent Against Bitcoin, Why the Ratio Says More Than the Price
Which topics should we dive deeper into?
Select what genuinely interests you. Your picks feed directly into our editorial planning.
Crypto news that's actually worth your time.
Weekly. 60 seconds. Carefully curated by our editors: no hype, no promo flood, no spam.

November 5, 2026 8:07 AM

Bitcoin Price Prediction: 24,912 Calls Against 8,223 Puts, What Friday's Expiry Decides
On Friday, Bitcoin options worth about $2.65 billion expire at Deribit, with three times as many calls as puts. The price sits just above max pain. Which levels count now and what range the options market is pricing in.

October 31, 2026 9:46 AM

Bitcoin Price Crash Continues: BTC Slips Below $78,000, Here Is the Next Target
Bitcoin price crashes below the key $78,000 area as selling pressure builds. We analyze the chart and reveal the next short-term target for BTC.
October 26, 2026 7:36 AM

Bitcoin Price Crash: Top 3 Reasons Why BTC Price Dropped Below $80,000
Bitcoin price crashed below $80,000 over the weekend. Oil, ETF outflows and a wave of liquidations explain the move, and the Fed decides this week.

October 9, 2026 4:16 PM

Bitcoin Price Prediction: Standard Chartered Sticks to $100,000 as ETFs Shed $729 Million in Two Days
Standard Chartered is holding to $100,000 by year-end, yet US spot ETFs lost $729 million on Wednesday and Thursday. Bitcoin stands at around $83,100. What would have to happen by December, and which levels count now.
October 4, 2026 1:40 PM

Uptober put to the numbers: Bitcoin rose in six of eight Octobers, but not the last one
October has a reputation among crypto investors as a strong month, and for Bitcoin that is mostly true: six of eight Octobers since 2018 ended in the black. October 2025, however, brought the largest liquidation day in history. What the record shows and which levels count now.
October 3, 2026 11:01 AM

XRP Price Prediction: Can XRP Hit $3 Soon If the Bull Market Returns?
XRP is stuck near $1.50 in a falling wedge. Our XRP price prediction maps the path to $2, $2.75 and $3 if the crypto bull market comes back.
September 29, 2026 10:38 AM

Bitcoin Falls Toward $83,000 as Trump Rejects Iran Ceasefire Deal
Bitcoin slipped toward $83,000 after Trump rejected Iran's Hormuz proposal, sending oil above $100 and wiping out $478 million in crypto liquidations.
September 28, 2026 9:47 AM
XRP Price Drops Below $1.50: Where Is Ripple Heading This Week?
XRP price slips under $1.50 after a red weekend. Here is the XRP price analysis with the higher and lower targets that matter this week.
September 26, 2026 1:02 PM

Ethereum Price Prediction: ETH Defends Key Support, Is $3,000 Next?
Ethereum is consolidating near $2,700 after a rejection at $2,800. Our Ethereum price prediction looks at what ETH needs for a run at $3,000.
September 26, 2026 12:20 PM

Cardano Price Prediction: ADA Breaks Key Resistance, Is $0.30 the Next Stop?
Cardano is up 16% in a week and back above its 200-day EMA. Our Cardano price prediction looks at whether ADA can push to $0.30.
September 22, 2026 5:54 PM

XRP Price Prediction: Breakout Puts $1.80 Back In Play
XRP just snapped its descending trendline and reclaimed $1.50 with RSI at 67. Here is what the daily chart says about the road to $1.80 and above.
September 21, 2026 10:40 AM

Bitcoin Price Explodes Past $84,000: Here Is What Is Driving BTC
Bitcoin just ripped through months of resistance in a single session. Here are the real reasons behind the BTC rally and the level that matters next.
September 18, 2026 4:41 PM

Solana Price Prediction: Why SOL Is Setting Up for $120
Solana just tagged $110 and the 200 EMA is rising. Here is what the SOL chart says about $120 and what has to hold first.

September 18, 2026 11:39 AM

Ethereum Price Prediction: Why ETH Is Closing In on $3,000
Ethereum is coiling between $2,400 and $2,600 with a rising 200 EMA underneath. Here is what the ETH chart says about $3,000.
September 11, 2026 9:50 AM

XRP Price Crashes 6% in a Week: Buying Opportunity?
XRP price fell 6.45% this week to $1.35 and is now sitting on its 200 EMA. Here is what the chart says before the Senate vote on September 15.
September 11, 2026 8:32 AM
Bitcoin Price Drops 4% in a Week, and the Chart Just Got Interesting
Bitcoin price fell 4% this week and lost the $78,000 shelf. Here is what the chart says about the next support, resistance and price targets.
September 6, 2026 11:19 AM

Bitcoin Price Today: BTC Holds Firm Before The Biggest Week Of The Month
Bitcoin sits near $80,000 after a jobs report killed a four-month high. CPI, the Fed and a Senate vote all land in the next ten days.
September 3, 2026 4:04 PM
Bitcoin Price Smashes Back Through $80,000: Here Is What Just Set It Off
Bitcoin price surged to $80,477 in a matter of hours after a dovish Fed signal crushed rate hike bets. Here is the chart and the real driver.
August 30, 2026 1:32 PM
Bitcoin Price Correction: Why BTC Stalled Dead at $78,000 Again
Bitcoin corrected from $81,455 after a hawkish Fed. The chart shows the exact same rejection level as May. Here are the upside and downside targets.
August 30, 2026 10:56 AM

Ethereum Price Prediction: Can ETH Blast Toward $2,750 Next?
Ethereum price prediction after a 30% August rally: ETH sits at $2,453 with RSI cooling. Here are the bullish and bearish ETH price targets.
August 25, 2026 3:56 PM

Bitcoin Price Cracks $80,000 Then Cools While Altcoins Push Higher
Bitcoin cleared 80,000 dollars for the first time since May, then slipped to 79,100. Chart analysis, upside targets and key support levels.
August 21, 2026 7:43 AM
Bitcoin Price Above $75,000: 3 Reasons Why BTC Is Exploding
Bitcoin cleared $75,000 for the first time since May and is up almost 20% this week. Here are the 3 reasons and the next target.
August 19, 2026 5:42 PM

Bitcoin Price Rips to $69,749: Here Is the Next Target
Bitcoin just posted its biggest daily candle since June and stopped 251 dollars short of $70,000. The measured move points somewhere very specific.
August 16, 2026 3:33 PM

XRP Price on the Edge of $1: Why the Next Bitcoin Drop Could Crash XRP to $0.80
XRP price is stuck at $1 after breaking it several times. Weekly RSI at 31 and a weak Bitcoin put the next supports at $0.90 and $0.80.
August 7, 2026 2:16 PM

Bitcoin Price Analysis: Why BTC Rose Despite The Crypto Bill Delay
The Senate punted the CLARITY Act to September and Bitcoin rose anyway. The chart explains why, and it is not the story most people are telling.


More from CryptoTicker