
Solana (SOL) Price Prediction: Can SOL Reclaim $76 and Target $90 — or Is $60 Back in Play?
Solana trades near $71 after bouncing off $60. We analyze the SOL/USD chart, key support and resistance, and the targets that matter next.


Which topics should we dive deeper into?
Select what genuinely interests you. Your picks feed directly into our editorial planning.
Crypto news that's actually worth your time.
Weekly. 60 seconds. Carefully curated by our editors: no hype, no promo flood, no spam.
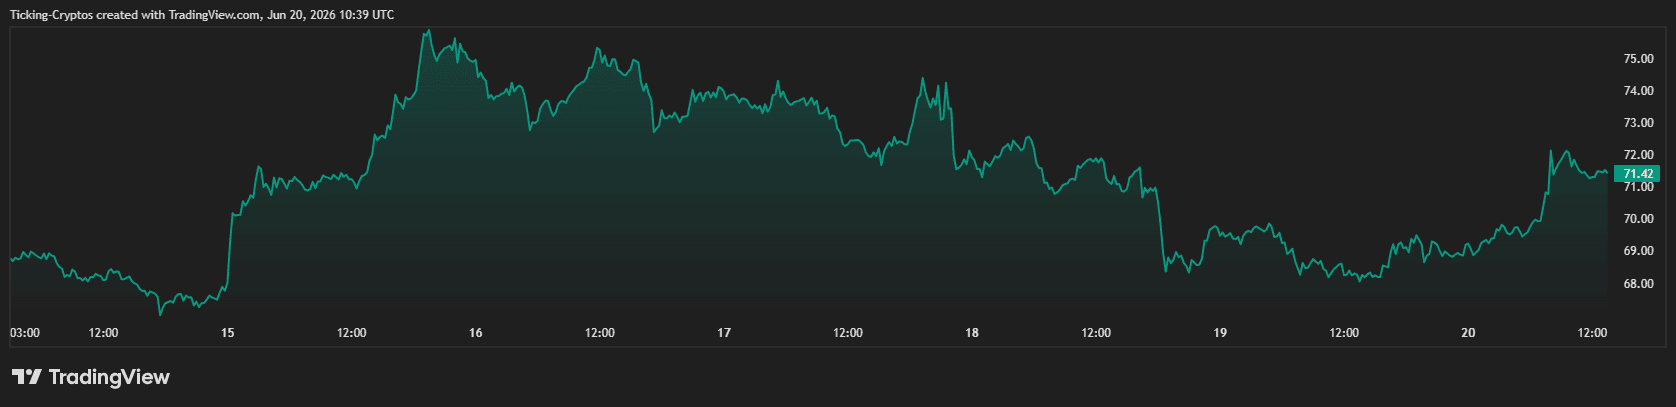
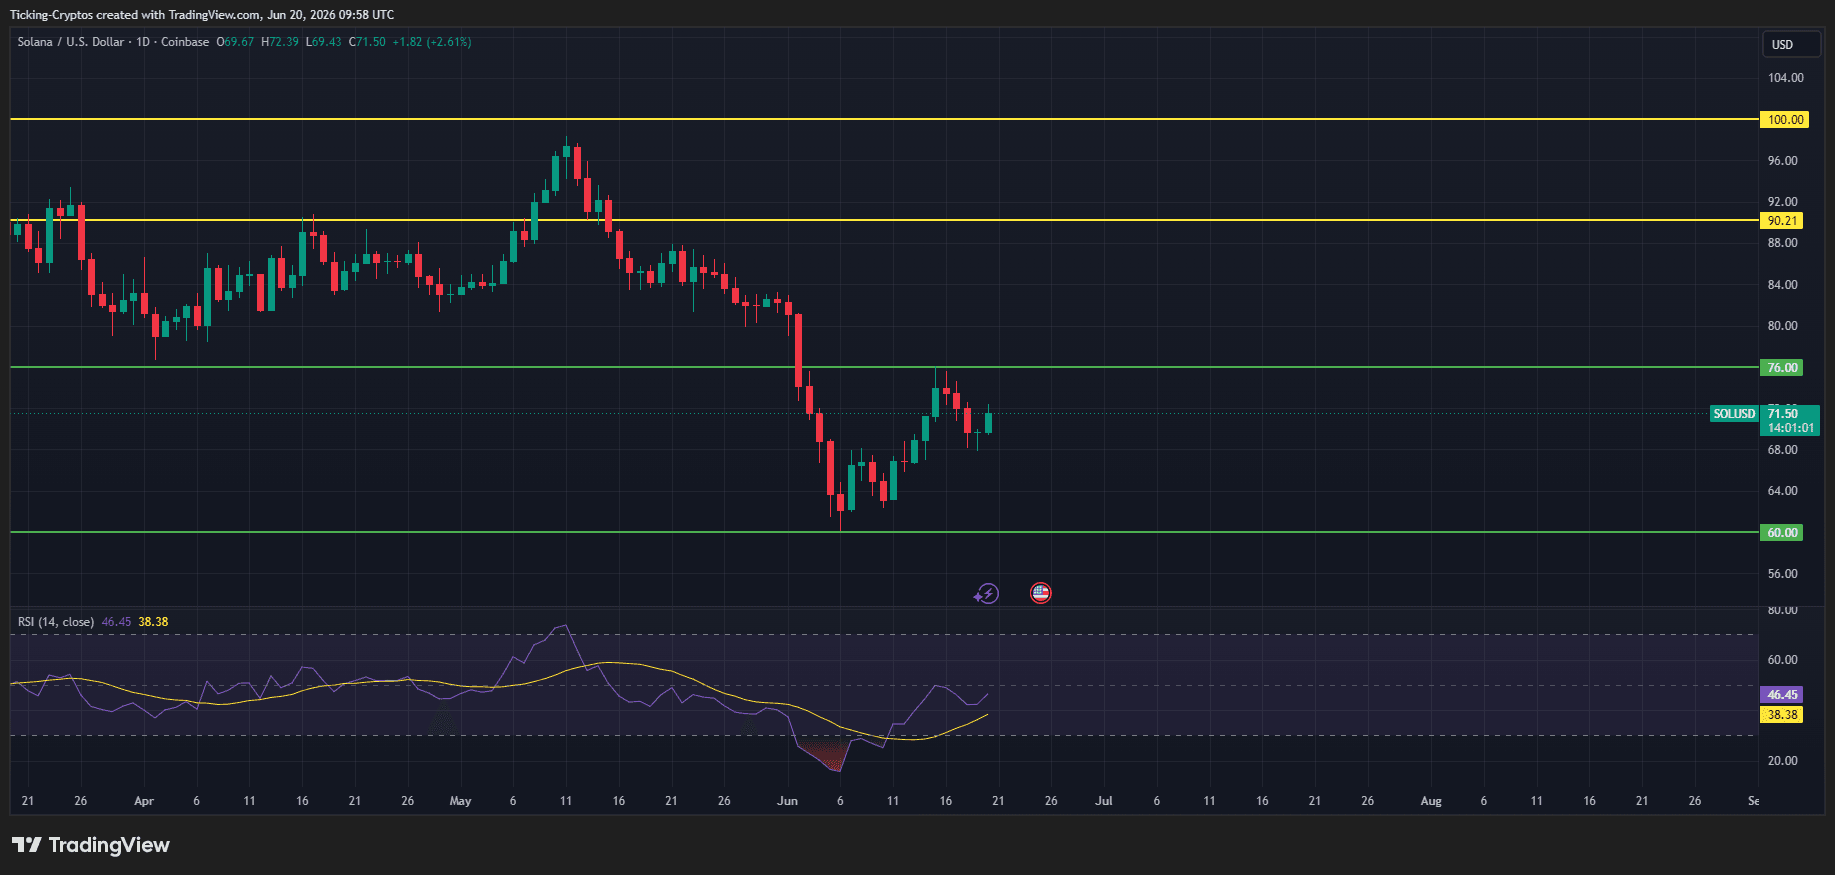
Solana ($SOL) is changing hands around $71.50, up about 2.6% on the day, as it tries to build on a recovery off its early-June lows. The daily chart tells a clear story: SOL peaked near $98 in mid-May, then sold off sharply through late May and early June, bottoming around the $62–63 zone before buyers stepped in and pushed the price back toward the low-$70s.
That makes the current setup a classic post-crash recovery attempt — price has bounced off a major support, but still sits well below the levels that defined its previous range. The question now is whether this bounce has the strength to reclaim lost ground, or whether it's a relief rally inside a broader downtrend.
Solana Analysis: What Do Key Support and Resistance Levels Show?
The chart maps out a clean structure of levels that traders are watching closely. These are the lines that will likely define SOL's next move:
- $60.00 — major support (green). This is the floor that held during the early-June capitulation. As long as SOL stays above it, the recovery thesis remains intact.
- $76.00 — immediate resistance (green). Once a support level, this has flipped to overhead resistance. It's the first real test for buyers and the gateway to higher targets.
- $90.21 — key resistance (orange). The upper boundary of SOL's prior trading range. Reclaiming this would signal a genuine shift back to strength.
- $100.00 — psychological resistance (orange). The round number that capped the May rally. A move here would mark a full recovery of the recent decline.
Right now, SOL sits in the no-man's-land between $60 support and $76 resistance — a zone where the next decisive break tends to set the tone.
What Is the RSI Telling Us About Momentum?
Momentum is where the picture gets interesting. The RSI (14) reads 46.45, with its moving average down at 38.38. Two takeaways stand out:
- The RSI is recovering from oversold. During the early-June plunge, RSI dipped sharply (the shaded zone on the chart), reflecting heavy selling. It has since climbed back toward the midline — a sign the worst of the selling pressure has eased.
- It hasn't reclaimed 50 yet. Staying below the neutral 50 line means momentum is improving but not yet bullish. The RSI crossing back above its moving average is an early positive signal, but bulls need a clean break above 50 to confirm a shift.
In short: the momentum reading supports a recovery attempt, but doesn't yet confirm a trend reversal.
What Are the Bullish Targets if SOL Breaks Out?
If buyers maintain control and SOL pushes higher, the path is mapped by the resistance levels above. A realistic bullish sequence looks like this:
- Reclaim $76.00. The first hurdle. A daily close above this flipped level would confirm the bounce has legs and open the door higher.
- Target $90.21. With $76 cleared, the next logical objective is the prior range high near $90 — a roughly 26% move from current levels.
- Challenge $100.00. A break and hold above $90 would put the psychological $100 mark back in play, completing a full recovery of the May–June decline.
For this scenario to unfold, SOL likely needs supportive conditions from the broader crypto market — particularly $Bitcoin — alongside the RSI reclaiming the 50 level to confirm momentum.
 Find a crypto exchange with an EU licence
What Happens if Solana Support Fails?
Balance requires looking at the downside too. The recovery is real but fragile, and a failure to hold current levels would shift the bias back to the bears:
- Losing the low-$70s would suggest the bounce is fading and bring the recent lows back into focus.
- A break below $60.00 would be the more serious signal. It would invalidate the recovery structure and expose SOL to deeper downside, with the $50–55 region emerging as the next major demand zone.
This is why $60 is the line that matters most on the downside — it's the difference between "healthy pullback within a recovery" and "resumption of the downtrend."
Solana Future: What Is the Overall Solana Price Outlook?
Pulling it together, SOL sits at a genuine decision point. The bullish case is that price has defended a major support at $60, momentum is recovering off oversold, and a reclaim of $76 would open a path toward $90 and potentially $100. The bearish case is that SOL remains below its key moving averages, RSI is still under 50, and a loss of $60 would reopen significant downside.
For traders, the roadmap is clean:
- Bullish trigger: a daily close above $76, targeting $90 then $100.
- Bearish trigger: a daily close below $60, targeting $50–55.
- Neutral zone: between $60 and $76, expect choppy, range-bound action until one side breaks.
As always with Solana, the broader market backdrop — Bitcoin's direction, risk appetite, and ETF flows — will likely be the deciding factor in which way this resolves.
More on Solana: All Solana news at a glance
Related articles
- Solana staking yields 5.2 percent while SOL has lost 19 percent in 30 days
- Solana Price Prediction: China's Central Bank Targets the Shanghai Campaign. What Now for SOL?
- Solana Price Slides to $89, First Test of the 200-Day Line Since August
- Solana price prediction: SOL tests the 200-day line at $88.88 ahead of Breakpoint London
- Solana Price Below $95: Record ETF Outflows and Whale Selling Push SOL to a 7-Month Low
Which topics should we dive deeper into?
Select what genuinely interests you. Your picks feed directly into our editorial planning.
Crypto news that's actually worth your time.
Weekly. 60 seconds. Carefully curated by our editors: no hype, no promo flood, no spam.

November 3, 2026 8:59 AM

Ethereum Price Below $2,300: Is $2,000 Next or Is This the Bottom?
Ethereum price slips toward $2,250 as $3 billion leaves DeFi. Whales are buying the dip. Does ETH hold $2,200 or test $2,000 next?

November 3, 2026 1:26 AM
Solana price prediction: the network creates 62,415 new SOL every day
Analysis: the Solana network issues 62,415 new SOL a day, regardless of where the price goes. We pulled the figure from the blockchain ourselves on Saturday and set it against trading volume, the staking ratio and the day's key levels.
November 2, 2026 7:13 PM

Solana price prediction: 1,000 days without an outage, will the 200-day line at $89 hold?
Analysis: the Solana blockchain has run without a halt since February 6, 2024, and on November 2 the streak reaches exactly 1,000 days. The price still falls to $92.78, its lowest since August; we show which levels matter now and why technology alone does not carry the price.
November 1, 2026 6:27 PM

Solana price prediction: two wallets shift $111 million in SOL
Analysis: two unknown wallets moved 1,159,856 SOL worth $111 million to Coinbase Institutional on October 31, more than the US fund wrappers gave up in the five trading days before. We measured both capital channels against trading volume, market capitalisation and daily issuance.

October 29, 2026 9:55 PM

Solana Crash: SOL Falls Below $100. Is $80 Next?
Solana lost 3.3% within an hour after the Binance hack and slid to $95.64, although not a single SOL was stolen. Why Solana falls anyway, why it was already weak before and which price levels matter now.
October 27, 2026 12:31 PM

XRP Price Crashes Below $1.30: What Caused It and What Comes Next
XRP price has dropped below $1.30 after weeks of selling. Here are the factors behind the XRP crash and the next high and low price targets.
October 23, 2026 1:18 PM

JPMorgan Brings Tokenized Funds to Solana: Why Solana Price Still Fell 3%
JPMorgan just launched two tokenized money market funds on Solana. Big news for SOL, yet Solana price slipped 3%. Here is what the market is really saying.
October 22, 2026 10:13 PM

Solana price prediction: 2.57 long accounts per short as $12.9 million leaves the futures market
Solana's futures market lost $12.9 million in open interest within a day, yet the long ratio holds at 2.57 accounts per short. What that means for the $100 level, and how to work out your own liquidation distance.

October 17, 2026 7:22 PM

Solana sheds $1.49 billion in stablecoins: what the price prediction hinges on at $100
The Solana blockchain holds $1.49 billion less in stablecoins than on September 25, a drop of 8.6 percent. At the same time the ETF outflows have been running for ten trading days. What that means for the $100 level, the staking yield and your tax return.
October 12, 2026 10:50 AM

Solana price prediction: network fees down 35 percent in seven days, next target is $117
The applications on Solana took in $99.6 million in fees over seven days, 35.3 percent less than in the week before. The price lost only 7.3 percent over the same period, and the direction is decided between the 50-day line at $109.21 and the 20-day line at $117.05.
October 4, 2026 1:31 PM

90 US banks now settle over Solana in 400 milliseconds: what it means for the SOL price
Since October 1, more than 90 banks and credit unions in North Dakota have been settling transfers with a stablecoin over Solana, provided by Fiserv, and a record in tokenised equity trading comes on top. What that means for the SOL price and which levels count.
October 3, 2026 4:17 PM

Solana Price Prediction for October: The Range Ran From Minus 46 to Plus 80 Percent
Three Octobers ended in the green for Solana, three in the red, with the range running from minus 46 to plus 80 percent. SOL enters this October just under $120. What the previous years show, what they do not show and which levels matter now.
October 3, 2026 11:01 AM

XRP Price Prediction: Can XRP Hit $3 Soon If the Bull Market Returns?
XRP is stuck near $1.50 in a falling wedge. Our XRP price prediction maps the path to $2, $2.75 and $3 if the crypto bull market comes back.
September 28, 2026 9:47 AM
XRP Price Drops Below $1.50: Where Is Ripple Heading This Week?
XRP price slips under $1.50 after a red weekend. Here is the XRP price analysis with the higher and lower targets that matter this week.
September 26, 2026 1:02 PM
Ethereum Price Prediction: ETH Defends Key Support, Is $3,000 Next?
Ethereum is consolidating near $2,700 after a rejection at $2,800. Our Ethereum price prediction looks at what ETH needs for a run at $3,000.
September 26, 2026 12:20 PM

Cardano Price Prediction: ADA Breaks Key Resistance, Is $0.30 the Next Stop?
Cardano is up 16% in a week and back above its 200-day EMA. Our Cardano price prediction looks at whether ADA can push to $0.30.
September 23, 2026 7:36 AM

Cardano Price Prediction: ADA Rockets 30% as Bulls Eye the Next Big Target
Cardano price jumped over 30% in a week, reclaiming the 200 EMA. Here's what's driving ADA and the price targets traders are watching next.
September 22, 2026 5:54 PM
XRP Price Prediction: Breakout Puts $1.80 Back In Play
XRP just snapped its descending trendline and reclaimed $1.50 with RSI at 67. Here is what the daily chart says about the road to $1.80 and above.
September 21, 2026 11:44 AM
XRP Price Breaks Its Downtrend: Is $2 Finally In Sight?
XRP just snapped the trendline that capped it all September. Here is what the chart says about $1.50, $1.80 and the road to $2.
September 18, 2026 4:41 PM

Solana Price Prediction: Why SOL Is Setting Up for $120
Solana just tagged $110 and the 200 EMA is rising. Here is what the SOL chart says about $120 and what has to hold first.
September 18, 2026 11:39 AM
Ethereum Price Prediction: Why ETH Is Closing In on $3,000
Ethereum is coiling between $2,400 and $2,600 with a rising 200 EMA underneath. Here is what the ETH chart says about $3,000.
September 11, 2026 9:50 AM

XRP Price Crashes 6% in a Week: Buying Opportunity?
XRP price fell 6.45% this week to $1.35 and is now sitting on its 200 EMA. Here is what the chart says before the Senate vote on September 15.
September 11, 2026 8:32 AM

Bitcoin Price Drops 4% in a Week, and the Chart Just Got Interesting
Bitcoin price fell 4% this week and lost the $78,000 shelf. Here is what the chart says about the next support, resistance and price targets.
August 30, 2026 10:56 AM
Ethereum Price Prediction: Can ETH Blast Toward $2,750 Next?
Ethereum price prediction after a 30% August rally: ETH sits at $2,453 with RSI cooling. Here are the bullish and bearish ETH price targets.
August 29, 2026 10:30 AM
XRP Price Prediction: XRP Ripped From $1 To $1.66 In Three Days, Here Is Where It Goes Next
XRP exploded 66% off the $1 floor, then gave back a third of it. Here is the full chart breakdown and the XRP price targets that matter now.

More from CryptoTicker