
XRP Price Crashes 6% in a Week: Buying Opportunity?
XRP price fell 6.45% this week to $1.35 and is now sitting on its 200 EMA. Here is what the chart says before the Senate vote on September 15.





Which topics should we dive deeper into?
Select what genuinely interests you. Your picks feed directly into our editorial planning.
Crypto news that's actually worth your time.
Weekly. 60 seconds. Carefully curated by our editors: no hype, no promo flood, no spam.
XRP trades at $1.3525 on September 11, up a token 0.27% on the session but down 6.45% over seven days. That makes it the worst performer in the top five this week, worse than Bitcoin's 4.40% decline. Market cap sits at $85.31 billion with $2.54 billion in daily volume, and the year to date loss is a painful 26.26%.

Zoom out further and the number that matters is this: $XRP is still down roughly 63% from its $3.65 cycle high set in July 2025. August gave holders their best week in a year. September has been giving it back.
Why Is the XRP Price Falling This Week?
Two reasons, one shared and one specific to XRP.
The shared reason is the Federal Reserve. Markets are pricing roughly a 60% chance of a 25 basis point rate hike on September 16, a complete flip from the hold expectations of late August. Strong August payrolls at 162,000, core PCE at record highs and rising oil prices tied to the US and Iran conflict have all pushed yields up, and August CPI lands today. High beta assets get sold first in that environment, and XRP is high beta.
The XRP specific reason is the Senate. On September 15 at 2:15 p.m. Eastern the Senate holds a cloture vote on the motion to proceed to the CLARITY Act. This is not a vote to pass the bill, it is a procedural vote to allow debate, and it needs 60 votes. Republicans hold 53 seats, which means at least seven Democrats have to cross over.
The market does not believe it happens. Polymarket has put 2026 passage at around 20%, while Galaxy Digital and the Solana Policy Institute have both assigned roughly 10% odds before the midterms. Senator Cynthia Lummis has warned that failing now could push market structure legislation out to 2030. Former federal prosecutor Renato Mariotti has been blunter, calling the bill dead.
XRP rallied in August partly on CLARITY optimism. The last three weeks look a lot like that optimism being priced back out.
 Compare the best crypto exchanges
What Does the XRP Chart Show Technically?
The 3 hour chart splits into three clean phases.

- The vertical move. XRP bottomed at $0.9877 on August 17 and then ran roughly 70% in three days, spiking to the $1.66 area on August 22. The green arrow on the chart marks the launch point at the $1.00 line. That candle on August 22 left a long upper wick, which is the signature of a move that ran out of buyers rather than one that found value. A leverage flush then dragged price back to $1.44 within days.
- The grind down. Since August 23 the chart has printed a textbook sequence of lower highs: $1.55, then $1.50, then $1.47, then $1.46 on September 4, then $1.44 on September 9. Each bounce has been sold slightly earlier than the one before. That is distribution, not accumulation.
- The test. The blue line is the 200 EMA at $1.34052. XRP is currently 0.9% above it and this is the first real test of that average since the August breakout. The current 3 hour candle has a range of barely one cent, opening at $1.34866 with a high of $1.35933 and a low of $1.34772. Compression that tight, directly on a major moving average, does not last.
- Momentum. The 14 period RSI reads 34.90 with its signal line at 35.39. RSI dropped to around 25 overnight, which is deeply oversold, and has bounced from there. But it is still below its signal line, so the crossover has not confirmed yet. Oversold in a downtrend is not a buy signal on its own, it is just a reason the fall paused.
Which XRP Support Levels Matter Now?
This is where the chart gets genuinely interesting, because three different things land in almost the same place.
Take the August move from $0.9877 to $1.66. The 50% retracement of that rally sits at $1.324. The $1.30 line drawn on the chart sits just below it. The 200 EMA at $1.34052 sits just above it. So the zone from $1.30 to $1.34 is a triple confluence of a moving average, a round number and a Fibonacci retracement. Analysts tracking the coin have flagged the same $1.31 to $1.35 band as the support cluster.
Below that, the ladder is:
- $1.2445 is the 61.8% retracement, the so-called golden pocket
- $1.20 is the horizontal level drawn on the chart
- $1.00 is the breakout base and the psychological floor
- $0.9049 sits below the August cycle low and would only come into play in a full market breakdown
What Are the XRP Price Targets From Here?
- Bearish scenario. A 3 hour close below $1.34052 puts the $1.30 to $1.324 confluence in play immediately. Losing that zone on a daily close would mean the August rally has retraced more than half of itself, and the next real target becomes $1.2445, then $1.20. The trigger for this path is a hot CPI today plus a failed cloture vote on Monday. In that combination, $1.20 by the end of September is realistic.
- Base case. XRP defends $1.34, chops between $1.34 and $1.44 into the vote and the Fed, and the lower high sequence stays intact without breaking down. Given that two binary events sit four and five days out, this is the highest probability path for the near term.
- Bullish scenario. Reclaiming $1.40 on a 3 hour close is the first requirement. That opens $1.4650, the September 4 high, and then the $1.50 to $1.55 band that has capped every attempt since late August. Only a close above the $1.66 August spike high would genuinely flip the structure from lower highs to higher highs, and that would put the $1.80 area next.
XRP needs two things to go right to break up, a soft CPI and a surprise cloture pass, and only one thing to go wrong to break down. The chart is neutral. The event calendar is not.
So is this a buying opportunity? On the chart alone, not yet. Buying here means buying into an intact sequence of lower highs with two binary events unresolved, and the level that would actually confirm the trend has turned is $1.66, not $1.35. The setup becomes far more attractive in two specific cases: a reclaim of $1.40 that holds on a daily close, or a flush into the $1.24 to $1.30 zone that produces a clear rejection candle. Neither has happened yet.

 CryptoTicker trading game: try it free
Why Are XRP ETF Inflows Not Lifting the Price?
This is the most interesting divergence in the market right now.
US spot XRP ETFs took in $110.49 million in the week ending August 28, their strongest week of 2026. Cumulative inflows stand at roughly $1.66 billion. Yet the price has fallen through that entire period.
Two explanations. First, flows slowed sharply: $18.96 million for the week ending September 4, then just $1.55 million on September 8. The institutional bid is still there but it has thinned out dramatically.
Second, and more structural, there is the escrow. Ripple releases 1 billion XRP from escrow each month and re-escrows 600 to 800 million of it, meaning 200 to 400 million XRP enters circulation monthly. At current prices that is roughly $270 million to $540 million of new supply every month, against an ETF complex that absorbed $18.96 million in its most recent measured week. The demand side has to run several times faster than it currently is just to offset issuance.
That gap is the honest answer to why good ETF headlines keep failing to move the price.
What Should XRP Traders Watch Next?
Three dates, in order of importance for XRP specifically:
- August CPI, September 11. Decides whether XRP tests $1.34 from above or below going into the weekend.
- CLARITY Act cloture vote, September 15 at 2:15 p.m. Eastern. The single largest XRP specific catalyst of the quarter. Failure is the base case, so a pass would be the upside surprise rather than the reverse.
- Fed decision, September 16. A hike is priced. A hold would be a genuine shock and the strongest broad market catalyst of the month.
Until those clear, $1.34 and $1.40 are the only two numbers that need watching.
More on XRP: All XRP news at a glance
Related articles
- XRP Price Prediction: XRP Ripped From $1 To $1.66 In Three Days, Here Is Where It Goes Next
- XRP Price Prediction: Is XRP Ready to Hit $2 in 2026?
- XRP Price Prediction: Can XRP Price Rally Continue Following Its Legal Victory?
- XRP Price Prediction: Can XRP Price Reach $10 after FOMC Meeting?
- XRP Price Prediction: Will an XRP ETF Push Prices Back Over 1$?
Which topics should we dive deeper into?
Select what genuinely interests you. Your picks feed directly into our editorial planning.
Crypto news that's actually worth your time.
Weekly. 60 seconds. Carefully curated by our editors: no hype, no promo flood, no spam.

January 6, 2026 9:50 AM
XRP Price Prediction: XRP Jumps Above $2.30 as Bullish Momentum Builds
XRP is rallying strongly at the start of 2026, breaking above $2.30 as bullish momentum returns across the crypto market.
September 22, 2026 5:54 PM
XRP Price Prediction: Breakout Puts $1.80 Back In Play
XRP just snapped its descending trendline and reclaimed $1.50 with RSI at 67. Here is what the daily chart says about the road to $1.80 and above.
June 28, 2024 12:25 PM

Solana News Today: Why is Solana Price up 10%?
Why is Solana's price up by 10%, despite the downtrend in the market? And what's behind the current optimism breaking key resistance levels?
March 11, 2026 2:11 PM
XRP Price Eyes $2: Top 3 Reasons Why a Ripple Breakout is Imminent
XRP price is gaining momentum as analysts eye the $2 psychological level. Here are the top 3 catalysts driving the Ripple token higher in 2026.
February 1, 2026 10:28 PM

XRP Price Prediction: Ripple Finds Strong Support Near $1.60 Level
XRP stabilizes at the $1.60 support level after a volatile market crash. Technical analysis suggests a potential relief rally for Ripple in early February 2026.
December 16, 2025 10:25 AM
XRP Price Crash: Why XRP Fell Below $2 and Where is it Heading Next
XRP lost the $2 level after a sharp rejection and is now sliding toward a critical $1.80 support zone. Here’s what the chart is signaling next.
June 2, 2026 9:15 AM
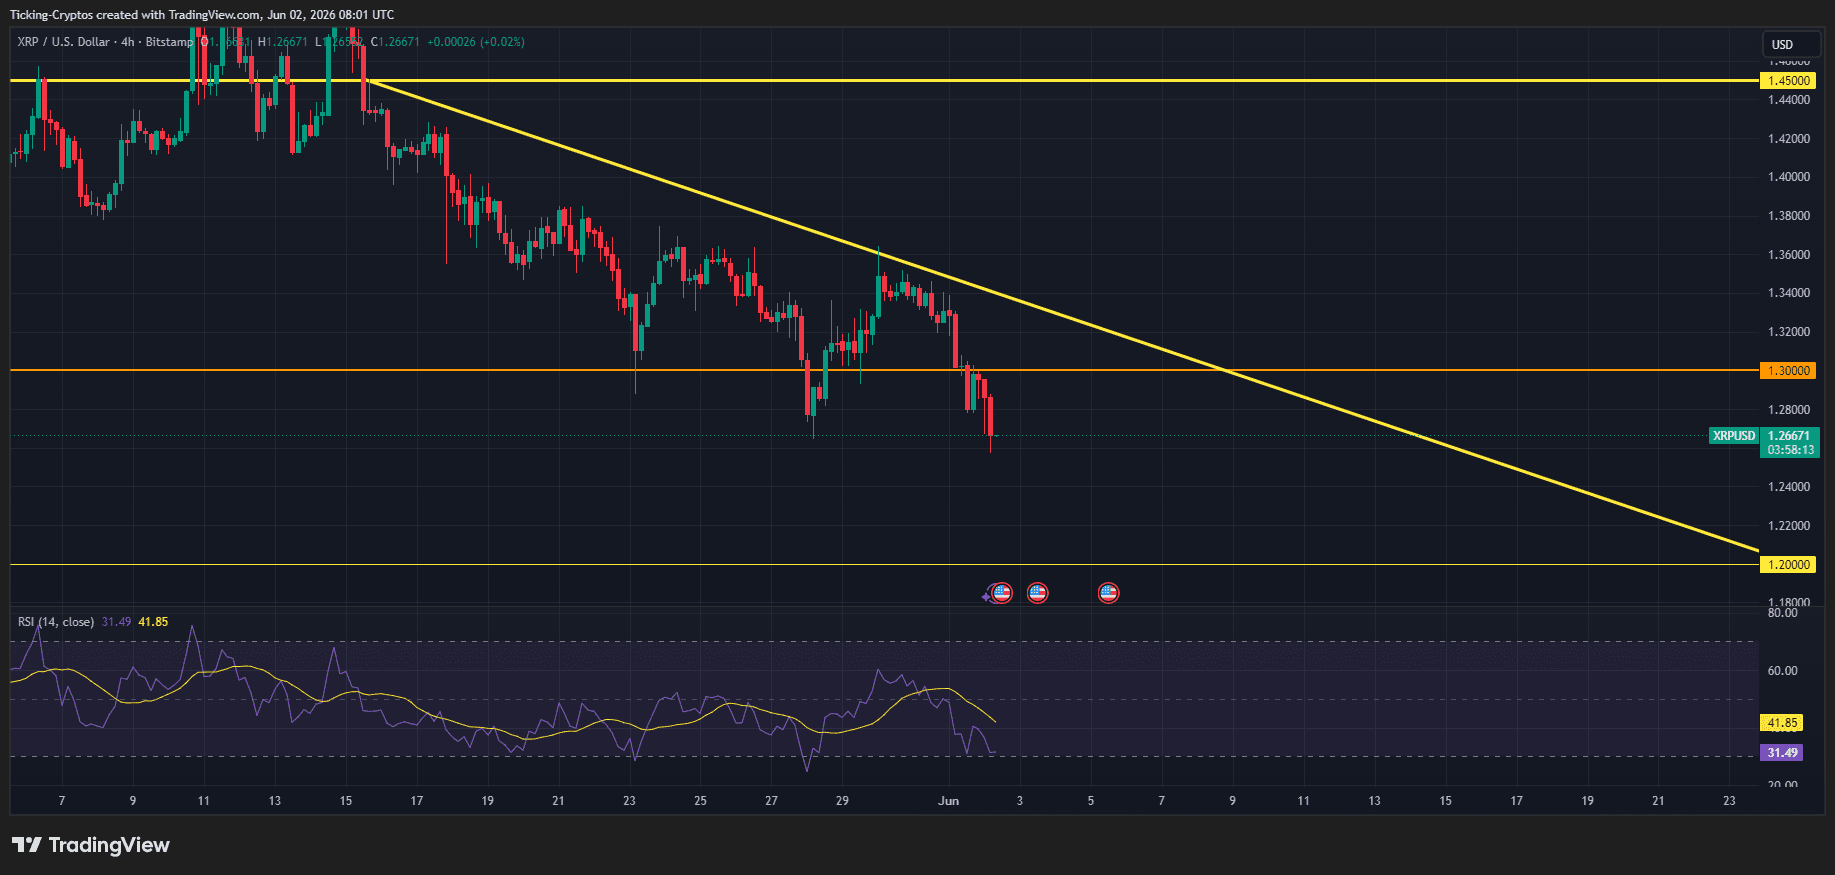
XRP Price Breaks Under $1.30: Key Targets as Sellers Push the Pivot
XRP price has dropped below the critical $1.30 support level. Here are the key technical targets and macro developments driving the market.
July 6, 2024 11:45 AM

XRP Price Prediction: Can XRP Reach $1 in July Amid Ripple's SEC Battle?
Many factors could drive XRP to $1 this July amid Ripple's ongoing legal battle with the SEC, and significant whale activity in the market. What is there to know?
August 3, 2026 10:41 AM
Is XRP Coin a Good Buy At Current Prices?
XRP trades at $1.29 and has lost both moving averages, with the 50-day EMA dropping back below the 200-day on 17 October. Why the $1.20 shelf now decides where the recovery finds its floor.
March 23, 2026 6:00 AM
XRP Price Holds Key Support — Is a Breakout Coming Next?
XRP price holds above key support near $1.38 despite market volatility. Is XRP preparing for its next breakout move?

September 1, 2026 11:14 AM
XRP Price Falls 8% in a Week: Is This Dip Actually Worth Buying?
XRP gave back 8% this week after a violent August melt-up. Here is what really drove that rally, what the chart says now, and what buying here depends on.
July 17, 2026 7:55 PM
Is XRP a Good Investment in 2026? Price Analysis and Prediction
XRP has broken out of its summer range and is holding above its 200-day average — without the catalyst the market waited a year for. What the chart, the CLARITY Act and 2026 forecasts really say.
January 27, 2026 6:00 AM
XRP Price Prediction: Bulls Eye $2.40 After January Volatility
XRP targets a recovery to $2.40 as institutional ETF demand creates a strong floor at $1.90 despite recent market-wide corrections.
July 29, 2024 10:29 AM
XRP Price Prediction: Will XRP Break Its Next Resistance Level Today?
With the current market uptrend, all cryptos are showing bullish signals. With XRP struggling to surpass the $0.60 resistance level, could this market surge help do it?
August 30, 2026 10:56 AM
Ethereum Price Prediction: Can ETH Blast Toward $2,750 Next?
Ethereum price prediction after a 30% August rally: ETH sits at $2,453 with RSI cooling. Here are the bullish and bearish ETH price targets.
August 28, 2024 6:12 PM

Breaking News: Will This Volatile Summer End With Bullish Signs For Bitcoin Price?
Bitcoin price summer volatility continues! Will it break out or fall further? Get expert analysis, key levels to watch, and industry leader predictions.
September 18, 2026 11:39 AM
Ethereum Price Prediction: Why ETH Is Closing In on $3,000
Ethereum is coiling between $2,400 and $2,600 with a rising 200 EMA underneath. Here is what the ETH chart says about $3,000.
February 24, 2026 10:30 AM

4 Altcoins Flashing Major Sell Signals: What Happens if Key Supports Break?
The crypto market is on edge as Bitcoin and major altcoins like ETH, SOL, and XRP approach "make-or-break" support levels. Is a deeper crash imminent?
March 7, 2026 12:59 PM
XRP Price Prediction: Can Ripple Reclaim $1.50 Amid Record Low Liquidity?
XRP faces a critical 60% valuation reset. As exchange liquidity hits record lows, will Ripple's native token bounce back to $1.50 or sink further?
June 14, 2024 7:05 PM

XRP Price Prediction: Will XRP Crash in June 2024?
With the current Ripple-SEC lawsuit ending soon, XRP price prediction is highly anticipated. Will it reach new highs this June or could it reach new lows?
July 7, 2024 3:21 PM
XRP, DOGE, and ADA Price Prediction: A Fast Recovery BUT How Long Lasting?
The potential turnaround for XRP, Dogecoin, and Cardano as key metrics indicates a buying opportunity amidst the current market downturn. Here is the latest XRP, DOGE, and ADA price prediction and analysis for a better understanding.
February 14, 2026 6:43 PM
XRP Price Prediction: Ripple Eyes $1.50 Breakthrough After 4% Daily Jump
XRP price surged 4% today, testing the critical $1.50 resistance. Our prediction explores if Ripple can hit $2.00 or if a dip to $1.15 is more likely.
January 9, 2025 3:30 PM

2025 Bitcoin Price Prediction: What if BTC Price breaks below $90K Support?
The 2025 Bitcoin price prediction hinges on its critical $90,000 support level. Will it hold, or could we see declines to lower levels? Explore key insights shaping the short-term Bitcoin trajectory.
December 19, 2024 2:31 PM
XRP Crash: What Happened and What's Next for the Last Days of 2024?
XRP recent crash has left investors on edge as the crypto faces significant market turbulence. But what are the reasons behind the drop?
August 16, 2026 3:33 PM
XRP Price on the Edge of $1: Why the Next Bitcoin Drop Could Crash XRP to $0.80
XRP price is stuck at $1 after breaking it several times. Weekly RSI at 31 and a weak Bitcoin put the next supports at $0.90 and $0.80.
More from CryptoTicker