
XRP Price Falls 8% in a Week: Is This Dip Actually Worth Buying?
XRP gave back 8% this week after a violent August melt-up. Here is what really drove that rally, what the chart says now, and what buying here depends on.


Which topics should we dive deeper into?
Select what genuinely interests you. Your picks feed directly into our editorial planning.
Crypto news that's actually worth your time.
Weekly. 60 seconds. Carefully curated by our editors: no hype, no promo flood, no spam.
XRP is down 8.48 percent over the past seven days, trading around $1.3672 after a daily candle that opened at $1.3793, tapped $1.3963 and closed 0.91 percent lower. On a screener full of red numbers that looks like just another altcoin bleeding out.
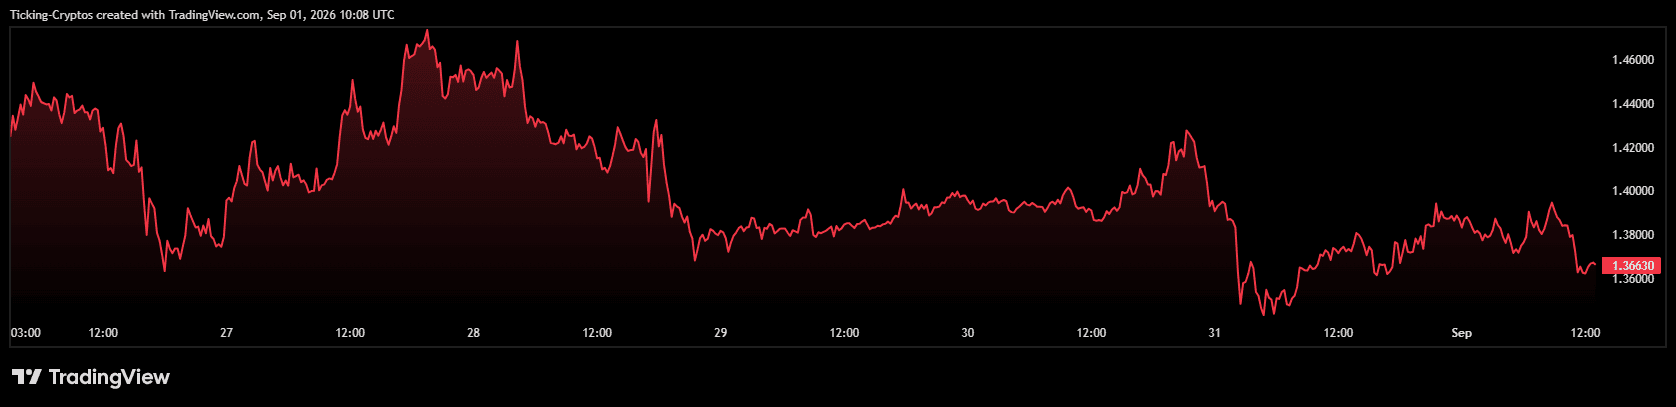
It is not. $XRP was the single best performing large cap in crypto ten days ago. It went from roughly $1.00 to an intraday high of $1.6963 in five sessions, its strongest week in 21 months, and finished August up around 28.5 percent, its best August since 2021.
So the accurate framing of this week is not "XRP crashed". It is "XRP gave back part of a violent, leveraged, macro-driven spike". Those are very different setups for anyone thinking about buying, and the difference is the whole article.
Why Did XRP Fall 8% This Week?
Because the thing that pushed it up was never really about XRP.
On August 19 the US Treasury announced it would expand its buybacks of long-dated government debt, raising the cap on individual operations from $2 billion to at least $4 billion for 10 to 30 year maturities, running from September 9 through November 4. Long-term yields fell hard. The 30-year had been sitting at a 19-year high above 5.33 percent and dropped toward 5.19 percent.
Traders immediately relabelled this as "QE Lite" or curve control, and risk assets ripped. XRP ripped hardest, up around 51 percent while Bitcoin managed 22 percent, Ethereum 30 percent and Solana 28 percent over the same stretch.
Two things are worth being precise about here, because a lot of coverage was not.
First, this was not yield curve control. The Treasury described the operations as liquidity support for parts of the bond market receiving heavy volumes of eligible offers. Actual curve control means a central bank setting a yield ceiling and buying unlimited quantities to defend it. Scheduled, capped operations by the Treasury are not that. The YCC read was a market interpretation, not announced policy.
Second, a large chunk of the move was shorts getting run over. CoinGlass data circulated showing roughly $2 billion in shorts liquidated during the week, but that figure covered the entire crypto market rather than XRP alone, and about $1.2 billion of it came in a single 24 hour window. The available data does not support the claim of nearly $2 billion in XRP-specific short liquidations that got repeated widely.
Strip it down and the August spike was a macro liquidity headline, amplified by a short squeeze, on an asset that had underperformed so badly it was crowded with bearish positioning. Whale accumulation of around 380 million tokens in one week and a White House crypto summit added fuel. None of that is nothing. But none of it is a durable, XRP-specific demand story either.
When the squeeze fuel ran out, the price came back down. That is this week.
 Leverage and derivatives: crypto brokers compared

Are XRP ETF Inflows Strong Enough to Hold the Line?
This is the strongest part of the bull case, and it is genuinely strong.
US spot XRP ETFs pulled in $110.49 million in the week ending August 28, their best weekly haul of 2026 by a wide margin. Cumulative net inflows across the products have reached $1.66 billion, with total net assets around $1.44 billion.
The timing detail matters more than the headline. Of the roughly $153.55 million that flowed in during all of August, only about $3.27 million arrived between August 3 and 14. The remaining $150 million or so landed in the final two weeks, and the buying has continued through nine consecutive positive sessions.
So ETF demand did not lead this rally. It chased it. That is a meaningful distinction: chasing flows tend to be more sensitive to price than anticipatory ones, and they can reverse quickly if the tape turns. The seven US spot XRP funds together hold around 977.92 million XRP, which is real structural demand, but it is a fraction of what circulates.
What Does the XRP Chart Actually Say?
The daily chart is unusually informative right now, because the spike left a very specific footprint.
XRP is sitting at $1.3672, directly on top of the 200-day EMA at $1.3508. That moving average had been falling all year and capped every rally attempt since spring. The August surge blew straight through it, and the current pullback is the retest. That is the single most important thing on this chart.
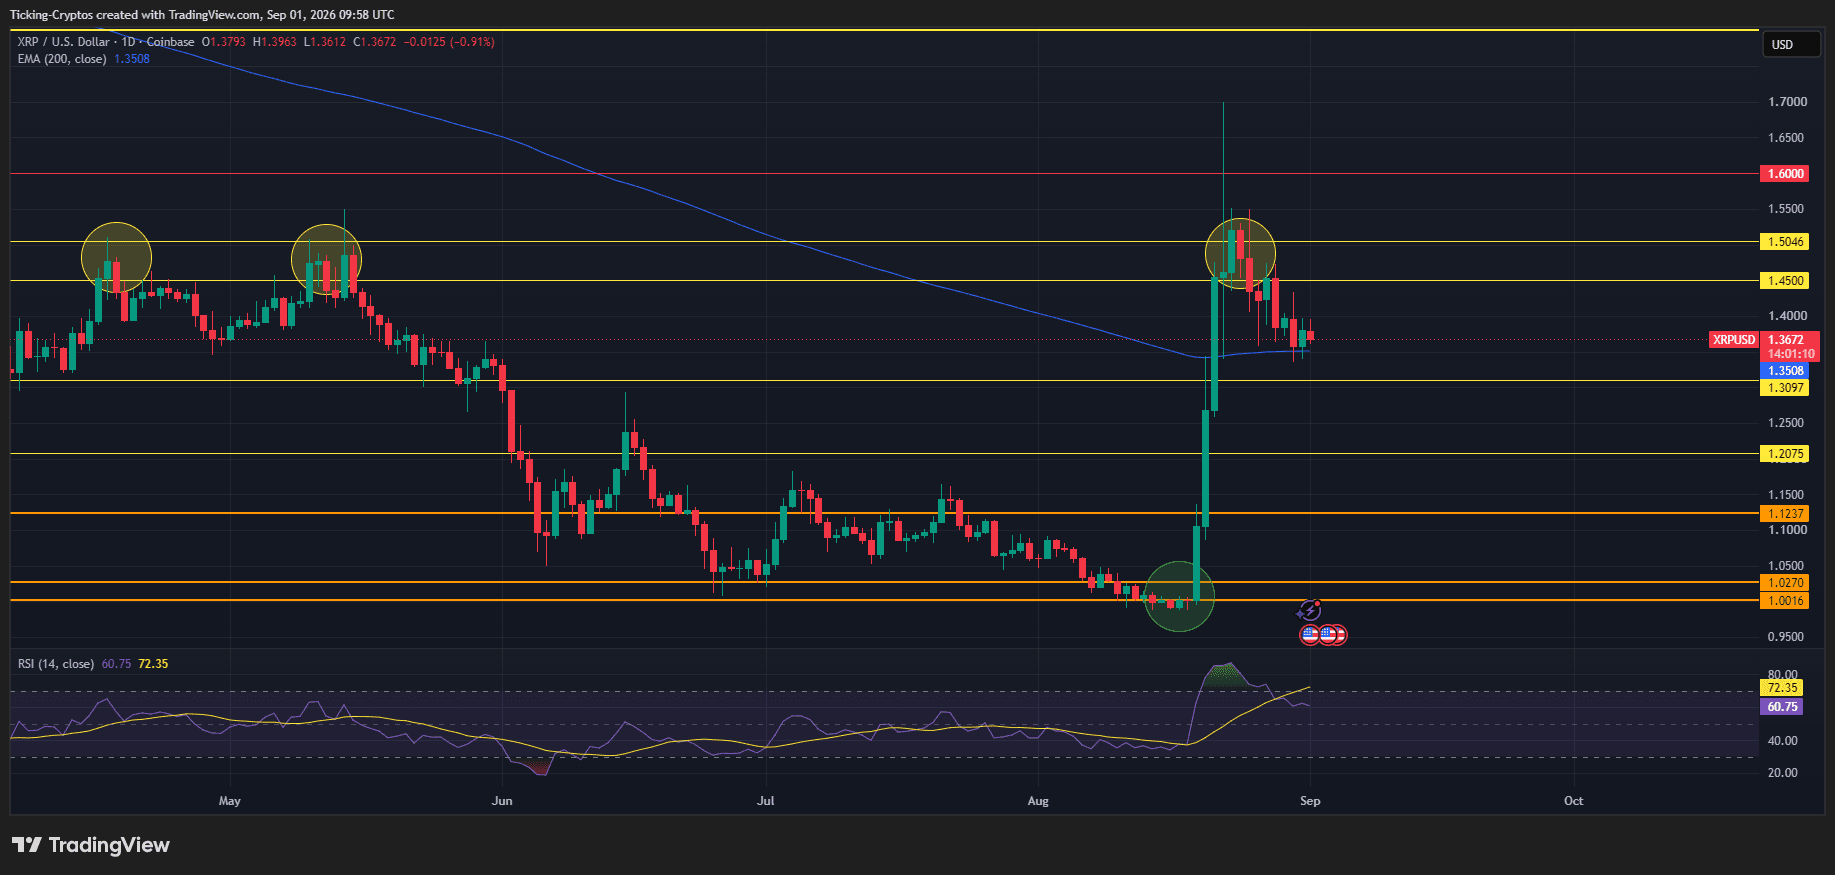
- Resistance overhead: $1.4500 is the first real barrier, and it is where sellers already stepped in on the way down. Above that sits $1.5046, the zone where the late-August candle got rejected, which also lines up with the highs from early May. The wick to $1.6963 above it is exactly that, a wick, with almost no time spent up there. $1.6000 is the next marked level.
- Support below: the 200-day EMA at $1.3508 first, then $1.3097. Below that the chart thins out badly toward $1.2075, then $1.1237, and finally the base of the whole move at $1.0270 and $1.0016, which is where the August low was set.
- Momentum: the daily RSI reads 60.75 and has already rolled over from a reading near 80, with the signal line at 72.35 above it. Momentum is cooling from an overbought extreme rather than breaking down. That is normal after a parabolic leg, but the cross below the signal is a warning that the impulse phase is over.
One structural point that traders keep missing: the move from $1.00 to $1.70 happened in days. There is almost no traded volume in the entire $1.05 to $1.35 zone. If $1.3508 fails and $1.3097 goes with it, there is very little underneath to slow price down. That cuts both ways, but it is why the risk here is not symmetrical with the reward.
What About the 1 Billion XRP That Unlocks Every Month?
Worth knowing, especially since today is the first of the month.
Ripple holds most non-circulating XRP in escrow contracts, and 1 billion tokens unlock on the first of every month. Historically Ripple re-escrows the bulk of it, typically 600 to 800 million, which leaves roughly 200 to 400 million actually entering circulation. Around 37.5 billion XRP remains locked, against circulating supply of about 62.53 billion out of a 99.99 billion total.
At today's price of roughly $1.37, that net monthly release is worth somewhere between $270 million and $550 million of new supply arriving whether the market wants it or not.
Put that next to the ETF numbers and the picture sharpens. The best ETF week of 2026 was $110 million. The monthly structural release is several times that. ETF demand is real, but it is currently not large enough to absorb the supply schedule on its own. That is not a scandal, it is arithmetic, and it is a headwind that Bitcoin simply does not have.
Is Buying XRP at Current Prices a Good Strategy?
Nobody can answer that for you, and anyone who says otherwise is selling something. What can be done is to lay out what the position actually is, because most people buying XRP here do not realise what they are betting on.
- Buying XRP at $1.37 is primarily a macro liquidity bet, not a Ripple bet. The rally was triggered by Treasury buyback expansion and lower long-end yields. If yields keep falling and the liquidity story holds, XRP has already shown it responds harder than Bitcoin or Ethereum. If the 30-year yield climbs back above 5.50 percent, the exact tailwind that created this move disappears. Analysts have flagged that level explicitly as the invalidation point for the macro thesis.
- The bull case: XRP reclaimed a 200-day EMA it had not touched since spring and is holding above it. ETF inflows just hit a 2026 record and are running nine sessions positive. Ripple is building a real business around the token's ecosystem, including a $1.25 billion Hidden Road acquisition, a $1 billion GTreasury deal and a new desk brokering equities exposure for institutions. The actual Treasury buybacks start on September 9, which is a scheduled catalyst rather than a hope. And the token is still only about 20 percent recovered from the slide that took it from $3.65 in July 2025 to below $1.
- The bear case: the move was leveraged and squeeze-driven, and Binance's estimated leverage ratio for XRP derivatives hit its highest level since early 2026, meaning more of the exposure is borrowed. Some analysts note XRP has now failed to reclaim its 50-week EMA for two consecutive weeks after a 22 percent retracement. Monthly escrow supply outweighs current ETF demand. XRP is still down about 26 percent year to date despite the best August in five years, which tells you how much damage there is to repair. And September historically has not been kind to this asset.
- The uncomfortable middle: both cases are credible, which is precisely why position sizing matters more than direction here. An asset that moves 56 percent in five days can move 30 percent against you just as fast.
If you are weighing this, the questions worth answering first are: are you actually taking a view on long-end Treasury yields, do you have a level at which you accept you were wrong, and would you be comfortable holding through a retest of the $1.20 area, because the chart structure makes that entirely possible without the bull case being dead.

What to Watch in September
Three dated events will settle most of this.
- September 9: the expanded Treasury buybacks actually begin. The announcement moved the market. The execution is when we find out whether the effect was priced or persistent.
- September 15: the Senate's procedural vote on the CLARITY Act. Sixty votes are needed to clear the filibuster. Market structure legislation is the regulatory catalyst XRP holders have been waiting on longest.
- September 16 and 17: the Fed decision. With Kevin Warsh sounding hawkish at Jackson Hole and rate hike odds back on the table, this is the one that can override everything else.
Add the ongoing ETF flow prints and the 30-year yield, and you have a fairly complete dashboard. Watch those rather than the price alone.
Frequently asked questions about the XRP price drop
Partner links: some links on this page are partner links. If you become a customer through one of them, we may earn a commission at no extra cost to you. Selection, ratings and ranking are decided independently by our editorial team. Ethics and Independence · Ownership and Funding
For later? Save this article and find it again in your profile.
More on XRP: All XRP news at a glance
Related articles
- XRP price prediction: 240 million XRP move at a two-year low, but not to an exchange
- XRP drops out of the top 5 and keeps lagging bitcoin
- XRP price prediction: can record whale wallets offset $18 million in ETF outflows?
- XRP price prediction: funding rate at a 13-month high, what it means for your coins
- Binance XRP scarcity index at a four-year high: XRP price prediction ahead of the weakest weekly close since August
Which topics should we dive deeper into?
Select what genuinely interests you. Your picks feed directly into our editorial planning.
Crypto news that's actually worth your time.
Weekly. 60 seconds. Carefully curated by our editors: no hype, no promo flood, no spam.

November 7, 2026 9:46 AM

Crypto Crash: Why Bitcoin, Ethereum, XRP and Solana Fell This Week and What Comes Next
Bitcoin lost its post-election gains, ETH hit a 10-week low and XRP led the losses. The four drivers behind this week's crypto crash and the levels to watch.

November 3, 2026 7:38 AM

XRP price prediction: Ripple locks 700 million tokens back up until 2029
Ripple relocked 700 million of the XRP released on November 1 the same evening, with terms running until 2029. That left 300 million tokens free, and this figure determines supply pressure in November.
November 1, 2026 12:16 PM

XRP price prediction: 133 million tokens leave the exchanges, and what is behind it
Analysis: the exchange wallets attributed to Ripple shrank by 133 million XRP in the week to October 31, while the monthly release window opens on November 1 for more than a billion tokens. Both figures are documented; how this counter-movement should be read follows further down as the editorial team's assessment.
October 31, 2026 10:52 AM
XRP Price Crash Continues: XRP Loses $1.30 Support, Here Is the Next Target
XRP price crashes below $1.30 after weeks of defending the level. We analyze the chart and reveal the next short-term target for XRP as selling continues.
October 30, 2026 6:37 PM

XRP price prediction: will the price rise after $8.4 million of inflows?
Analysis: the US XRP funds took in a net $8.43 million on Thursday, the strongest daily figure of October. Why that sum still barely moves the price and which two levels count now.
October 29, 2026 9:16 AM
XRP price prediction: Ripple targets $900 million, the token does not follow
Ripple expects an annualised product revenue run rate of around $900 million by the end of the year, while XRP trades at $1.29 on Thursday morning and sits 28.8 percent below the start of the year. This piece separates what Ripple has documented from what follows for the price.
October 28, 2026 1:00 PM

XRP price prediction: the $1.29 zone decides, not the escrow release
Analysis: another Ripple escrow contract expires on November 1, and every time the question is whether the fresh supply weighs on the price. We laid the twelve releases of the past year against the price, and the result is more sober than the expectation.
October 23, 2026 10:23 AM

XRP price prediction: the 100-day average crosses the 200-day average, 6.05 billion XRP move onto exchanges: what matters now
Our reading: on October 21 XRP's 100-day moving average rose above its 200-day average, the first time in our measurable series since May 11. Over the same stretch exchanges took in 6.05 billion XRP, and the two numbers point in different directions.
October 20, 2026 10:28 AM

XRP price prediction: a 13-week inflow streak breaks as $2.47 million leaves a single fund: what you can do now
The US spot ETFs on XRP gave up more money than they took in last Friday, for the first time in 13 weeks. The amount is small, the signal is not, and for investors in Germany a decision between an ETN and a direct purchase hangs on it.
October 17, 2026 10:17 AM

XRP Price Prediction: 1 billion XRP leaves escrow on November 1, how to check the net amount
Ripple's next escrow contract for up to 1 billion XRP expires on November 1. Twelve releases in twelve months show that only around 300 million tokens stay in circulation on average, and that is the number that counts for the price.
October 16, 2026 4:32 PM
XRP forecast: Evernorth lists 473 million XRP on the Nasdaq, the price has not moved since Monday
Since Monday, Evernorth has been the largest listed XRP treasury on the Nasdaq, holding 473 million tokens. The price stands at $1.34 all the same. Why that is, and what investors in Germany need to watch on tax.
October 12, 2026 4:28 PM

XRP price prediction: $160 million behind Solana, 13 weeks of inflows against a 9 percent weekly loss
The XRP funds are only $160 million behind the Solana funds and have been taking in fresh money for 13 weeks. Why the price is falling anyway at $1.38, and what that means for the $2.80 year-end target.
October 7, 2026 8:42 PM
Can XRP Price Reach $10? Here Is What the Math Says
XRP trades near $1.42 after losing $1.50. We check the $10 forecasts, the charts and the market cap math to see if XRP can really reach $10.
October 3, 2026 11:01 AM

XRP Price Prediction: Can XRP Hit $3 Soon If the Bull Market Returns?
XRP is stuck near $1.50 in a falling wedge. Our XRP price prediction maps the path to $2, $2.75 and $3 if the crypto bull market comes back.
September 29, 2026 7:20 PM

One Billion XRP Unlocks on October 1: The Level That Decides
XRP's next monthly escrow deadline expires on October 1, and up to one billion tokens can come free. What that means for the price at $1.52 and which levels to note down beforehand.
September 28, 2026 9:47 AM
XRP Price Drops Below $1.50: Where Is Ripple Heading This Week?
XRP price slips under $1.50 after a red weekend. Here is the XRP price analysis with the higher and lower targets that matter this week.
September 26, 2026 7:36 PM

XRP Price Prediction: Which Scenarios and Which Costs to Check Before the Quarter Ends
XRP trades at $1.55 on September 26, 2026, and on October 1 a release window opens covering up to 1 billion XRP. What the ETF inflows set against it, which levels count, and which costs really make an order more expensive.
September 25, 2026 1:12 PM

XRP Jumps to $1.56: What Holders Should Check on Buying Route, Holding Period and Leverage
XRP trades at $1.56 on September 25, 2026, up 6.85 percent on the day and 16.64 percent on the week. What the on-chain data and the US ETF inflows actually show, and what investors in Germany should check now on buying route, holding period, leverage and custody.
September 22, 2026 5:54 PM
XRP Price Prediction: Breakout Puts $1.80 Back In Play
XRP just snapped its descending trendline and reclaimed $1.50 with RSI at 67. Here is what the daily chart says about the road to $1.80 and above.
September 21, 2026 7:25 PM

Litecoin Has an ETF, and Almost Nobody Uses It
Litecoin gains 11.5 percent. A spot ETF has traded on the Nasdaq since October 2025; at the end of June it held around $5.49 million. What that gap says about ETF expectations.
September 21, 2026 11:44 AM
XRP Price Breaks Its Downtrend: Is $2 Finally In Sight?
XRP just snapped the trendline that capped it all September. Here is what the chart says about $1.50, $1.80 and the road to $2.

September 18, 2026 9:03 PM

XRP Price Recovers After the CLARITY Act Failure: What the CFTC Filing Changes for XRP Investors
XRP climbs a good 7 percent within 24 hours to $1.39, three days after the US Senate stopped the CLARITY Act. What the new CFTC rule filing means, what it does not deliver, and what you should check before your next purchase or sale.
September 18, 2026 11:39 AM
Ethereum Price Prediction: Why ETH Is Closing In on $3,000
Ethereum is coiling between $2,400 and $2,600 with a rising 200 EMA underneath. Here is what the ETH chart says about $3,000.
September 16, 2026 2:03 PM
XRP Price Crashes 9% as CLARITY Act Dies: How Low Can XRP Go?
XRP price crashed almost 9% after the Senate killed the CLARITY Act. Here is why XRP fell harder than Bitcoin, and the XRP price targets that matter now.
September 11, 2026 9:50 AM

XRP Price Crashes 6% in a Week: Buying Opportunity?
XRP price fell 6.45% this week to $1.35 and is now sitting on its 200 EMA. Here is what the chart says before the Senate vote on September 15.
More from CryptoTicker