
Is XRP Coin a Good Buy At Current Prices?
XRP trades at $1.19 and has lost both moving averages, with the 50-day EMA dropping back below the 200-day on 18 October. Why the $1.20 shelf now decides where the recovery finds its floor.

Which topics should we dive deeper into?
Select what genuinely interests you. Your picks feed directly into our editorial planning.
Crypto news that's actually worth your time.
Weekly. 60 seconds. Carefully curated by our editors: no hype, no promo flood, no spam.
Update (October 10, 2026): The US Senate rejected the procedural vote on the CLARITY Act (H.R. 3633) on September 15, 2026, by 49 to 50; 60 votes were needed (Senate roll call). The bill is on hold for now. The Federal Reserve raised its policy rate by 0.25 percentage points to a target range of 3.75 to 4.00 percent on September 16, 2026 (Federal Reserve statement). The sections below reflect the situation as of November 6, 2026.
$XRP is trading at $1.19 as of 6 November, down roughly 17% over 30 days, about 46% lower on the year and some 53% below the twelve-month high of $2.5258 set on 11 November 2025. Every conversation about buying XRP at these levels started from the same place: the chart was cheap relative to 2025, and cheap relative to 2025 was a losing argument for months — until the twelve-month low of $0.9927 on 17 August. The recovery that followed carried into early October and has since given back most of its ground.

So the question is not whether XRP looks discounted. It is whether the technical structure and the macro calendar give a buyer anything to work with. Here is what both are saying.
Advertisement: Crypto futures trading: Bitget offers leverage of up to 100x. Leverage can lead to high losses. Our exchange comparison shows more platforms.
XRP Price Analysis: Good Technicals Shaping up
The single most important line on the chart is the 200-day EMA at $1.3609. Price now sits 12.6% below it, against 31% below at the start of August and 9% above at the start of October. The 50-day EMA at $1.3245 has been undercut by 10.2%. Both lines have gone from support to resistance, and price has not closed above the 200-day EMA since 13 October. The bullish crossover of 4 October has unwound: on 18 October 2026 the 50-day EMA dropped back below the 200-day EMA and now sits 2.7% under it. The test of the long-term average as support has failed.
Below that, the levels stack up cleanly:
- Resistance: first the two averages, the 50-day EMA at $1.3245 roughly 11.3% and the 200-day EMA at $1.3609 roughly 14.4% above spot; above them the round $1.50 level, briefly taken in early October, roughly 26.1% away, and the next round number at $1.60, roughly 34.5% above spot
- Support: the $1.20 shelf, where price is sitting right now, beneath it the dollar level some 16.0% lower and the twelve-month low of $0.9927 from 17 August, some 16.6% lower
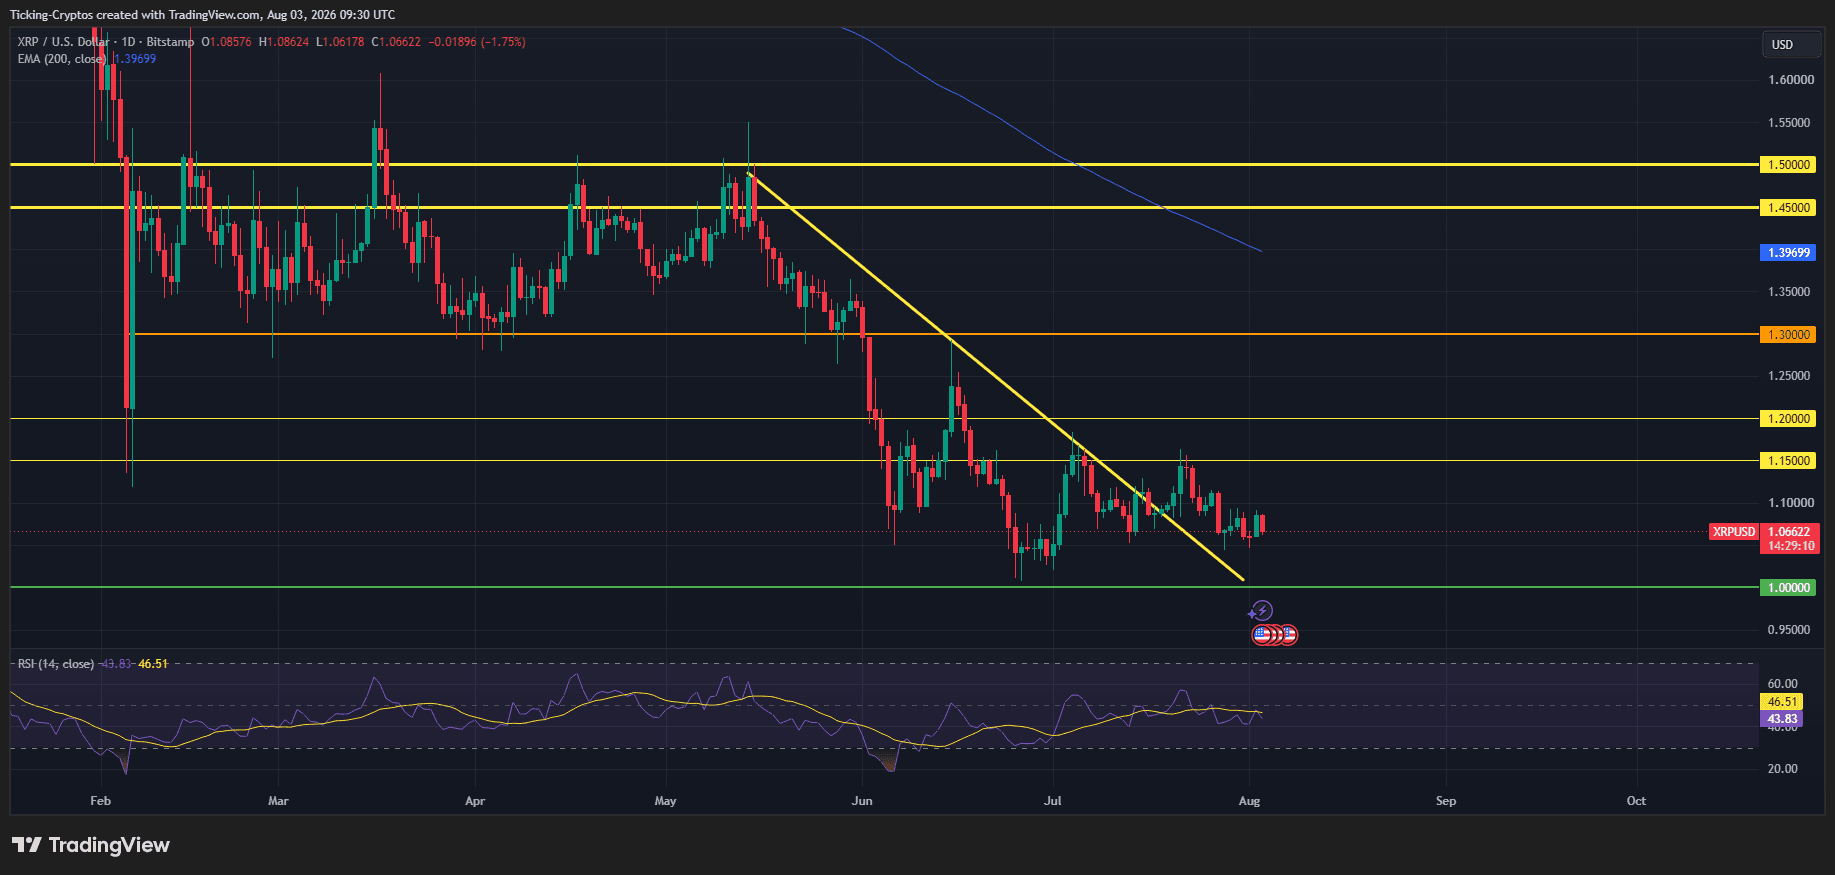
The $1.00 to $1.19 band where XRP spent the whole summer was broken to the upside; price is now back at its upper edge. From the twelve-month low of $0.9927 on 17 August the token has added roughly 20%, clearing the old resistance shelves at $1.15, $1.20 and $1.30 in turn, then the 200-day EMA and, in early October, the round $1.50 level as well. The upper four steps have since been given back: the recovery cleared its most important obstacle and has fallen back behind it.
RSI (14) reads 33.6, still below the 50 midline, against 36.7 at our last reading and 45.0 before that. Nothing is overbought — that would take a reading above 70 — and the indicator was last oversold at the twelve-month low in August, which is where the bounce began. At 33.6 it is heading back toward that threshold without having reached it: the indicator does not support the recovery, and it is now leaning against it.
Has XRP Coin Broken Its Downtrend or Just Paused?
This is the one mildly constructive detail on the chart. The descending trendline drawn from the May high near $1.50 has been sloping down through every bounce since, capping rallies in June and again in mid July. As of the start of August, price has moved above it.
Through August that break led nowhere. It then delivered: XRP took the $1.15 shelf, reclaimed $1.20 and now trades back at that level at $1.19. What was then a lapsed constraint became a breakout from the summer range, complete with a reclaim of the 200-day EMA — except that price has since slipped back below the old May high and then below both averages. What is left is the breakout from the summer range.
The threshold analysts set for that was met but no longer holds. BeInCrypto's analysis put the bullish trigger at a three-day close above $1.22 and argued it was the level that would pull ETF desks back into the market; XRP now trades roughly 2% below it. The May breakdown zone at $1.45 and the round $1.50 level were cleared in early October but sit well above spot again — $1.50 by roughly 26.1%, $1.60 by roughly 34.5%.
The more honest read of the chart is still a cautious one: a recovery with a proven floor that has just pushed through its decisive ceiling and has yet to confirm the break.
Why the 200-Day EMA Is Now the Whole Story
Because it is the line that defines the broader trend — and XRP has lost it again. From 19 September to 12 October price traded above it, for the first time since spring; not since. While price stays below it, the advance is formally a counter-move rather than a trend. The 50-day EMA at $1.3245 and the 200-day EMA at $1.3609 now sit 11.3% and 14.4% above price and form a single resistance zone; the next independent line of support beneath is the $1.20 shelf, where price now sits.
The reward-to-risk reads differently from a week ago. Upside to the two averages is about 11 to 14%, to $1.50 about 26.1% and to the round $1.60 level about 34.5%. On the downside the $1.20 shelf is already level with price, the dollar is about 16.0% away and the twelve-month low about 16.6%. Anyone who accumulated between $1.00 and $1.02 in August is still up roughly 18%; anyone buying today pays a smaller premium than at our last reading and still buys below both averages.

What Macro Events Are Driving XRP Now?
Three things, and only one of them is helping right now.
- The Fed has taken itself off the table. The FOMC raised rates by 0.25 percentage points to a target range of 3.75% to 4.00% on 16 September, after five consecutive holds. Chair Kevin Warsh again declined to offer forward guidance, leaving the path from here unclear. A restrictive Fed with no cut priced in means liquidity stays tight and leverage stays expensive, which is a structural headwind for altcoins specifically.
- Bitcoin is no longer providing a bid. BTC trades around $75,378, down roughly 10% over 30 days, and sits 1.2% below its 200-day EMA at $76,292 and 5.5% below its 50-day EMA. That removes once more the precondition XRP lacked all summer: XRP has never sustained a rally while Bitcoin trades below its own long-term averages, and the market leader has now slipped just below its long-term line, while XRP sits well below its own averages.
- The worst of the seasonality is behind the market. August is the flattest month in XRP's history at a 0.43% average return, and the token has closed the month red four years running, the longest active losing streak of any month. Analyst ChartNerd notes that in US midterm election years the picture is worse: August 2014 fell 5.7%, 2018 dropped 23%, and 2022 lost 13.7%, averaging around a 14% decline. 2026 is a midterm year — and this year's August did in fact end on the twelve-month low of $0.9927. That is precisely where the current recovery began. Seasonality is not a trading signal on its own, but this particular headwind has passed.
Confirmation from the fund wrapper is still outstanding. Per BeInCrypto, US spot XRP ETF flows registered exactly zero on 10 of July's 17 trading days, with net monthly demand of roughly $12.4 million against a fund complex holding about $997 million. Daily value traded fell about 37% across the month. Institutional desks are not selling XRP, they have simply stopped showing up.
Does the CLARITY Act Still Matter For XRP?
It matters more to XRP than to any other major token, and its odds are getting worse.
The Digital Asset Market Clarity Act would write XRP's commodity classification into federal statute and move oversight from the SEC to the CFTC. The SEC and CFTC already named XRP a digital commodity in a joint action on 17 March 2026, but that was interpretive guidance, not law, and a future set of regulators could withdraw it. Pension funds, bank trust desks and asset managers have been waiting on permanence, not interpretation.
The bill passed the House 294-134 in July 2025 and cleared the Senate Banking Committee 15-9 on 14 May 2026. It has sat on the Senate floor calendar since 1 June without a scheduled vote. In late July the Senate formally shelved it to prioritise a Russia sanctions bill and nominations. The chamber's recess ran until 14 September. Polymarket odds for 2026 passage had most recently slid to around 30%.
This is the crux of the bull case and the bear case at the same time. Standard Chartered's conditional $8 target requires full Senate passage plus $4 billion to $8 billion in fresh ETF inflows. Without a floor vote, that number is theoretical and the primary institutional catalyst for XRP disappears until at least late 2026, plausibly 2027 given the midterm calendar.
There is real progress on the technology side. The XRP Ledger's v3.3.0 release targets institutional onboarding, a validator vote is pending on an amendment package covering batch transactions, confidential transfers, sponsored fees and permission delegation, and Ripple Swell runs 27 to 29 October in New York. None of that moved price for months, which tells you what the market is actually waiting for.
So Is XRP Coin a Good Buy At Current Prices?
At $1.19, XRP is a buy below both averages and at the last support of the recovery: price has fallen back to the $1.20 shelf, and Bitcoin has lost its 200-day EMA.
The case for buying is that the summer range was broken to the upside and price now sits at its upper edge, the dollar floor held through its hardest test at the twelve-month low of $0.9927 on 17 August, price is still roughly 20% above that low, RSI at 33.6 is close to the oversold zone where the August bounce began, and the CLARITY Act remains a live catalyst that would re-rate the asset quickly if it passes.
The case against buying now is the lost trend structure. The break above the 200-day EMA held from 19 September to 12 October and has since been given back: the setback that was supposed to confirm the line as support broke it instead. On 18 October the 50-day EMA also fell back below the 200-day EMA, unwinding the crossover of 4 October. The $1.22 level analysts named as the turning point has been lost, and Bitcoin trades just below its 200-day EMA, without the condition XRP already lacked over the summer. You are still paying roughly 20% more than at the twelve-month low on 17 August, and now below both averages. And the single institutional catalyst that matters, the CLARITY Act, is still stalled.
The practical read: the zone formed by the 50-day EMA at $1.3245 and the 200-day EMA at $1.3609 has turned from support into resistance and sits about 11 to 14% above price. The caveat our last reading attached, that a line under test can also break, is what happened. The move is a counter-rally again, and the test is inverted: only a weekly close back above that zone restores the reversal. If XRP closes below the $1.20 shelf where it now sits, the path leads to the dollar level and the twelve-month low of $0.9927, some 17% lower. Between those two markers is the range in which XRP will be decided over the coming weeks.
Frequently asked questions about XRP after the recovery
Partner links: some links on this page are partner links. If you become a customer through one of them, we may earn a commission at no extra cost to you. Selection, ratings and ranking are decided independently by our editorial team. Ethics and Independence · Ownership and Funding
Transparency note: This article was produced with the assistance of artificial intelligence and reviewed by our editorial team before publication. All figures and claims were checked against the primary sources linked in the text.
More on XRP: All XRP news at a glance
Related articles
- Will Bitcoin Go Back Up? Three Scenarios to Year-End: $70,000, $80,000 or $100,000
- Crypto Crash: Why Bitcoin, Ethereum, XRP and Solana Fell This Week and What Comes Next
- XRP price prediction: options market prices an 8.7 percent swing to November 8
- Solana Price Below $95: Record ETF Outflows and Whale Selling Push SOL to a 7-Month Low
- Ethereum Price Below $2,300: Is $2,000 Next or Is This the Bottom?
Which topics should we dive deeper into?
Select what genuinely interests you. Your picks feed directly into our editorial planning.
Crypto news that's actually worth your time.
Weekly. 60 seconds. Carefully curated by our editors: no hype, no promo flood, no spam.

November 2, 2026 7:33 PM

US Midterms Tomorrow: 5 Scenarios for Bitcoin, XRP and Solana
America votes on Tuesday and crypto has over 170 million dollars riding on it. Five election outcomes and what each one would mean for Bitcoin (BTC), XRP and Solana (SOL) prices.
October 31, 2026 10:52 AM

XRP Price Crash Continues: XRP Loses $1.30 Support, Here Is the Next Target
XRP price crashes below $1.30 after weeks of defending the level. We analyze the chart and reveal the next short-term target for XRP as selling continues.

October 27, 2026 11:25 PM

Is Arbitrum a Good Buy at Current Prices?
Arbitrum sits well below its twelve-month high and above its long-term average. We check what argues for and against buying ARB at this level, and which condition would prove the recovery wrong.

October 27, 2026 9:27 PM

XRP below $1.30: what matters before Wednesday's Fed decision
XRP fell to $1.28 overnight into October 27 and was back at $1.32 by the afternoon. Three dates now sit in the calendar: Wednesday's rate decision, the escrow release on November 1 and the delayed XRPL upgrade.
October 27, 2026 12:31 PM
XRP Price Crashes Below $1.30: What Caused It and What Comes Next
XRP price has dropped below $1.30 after weeks of selling. Here are the factors behind the XRP crash and the next high and low price targets.
October 27, 2026 7:27 AM

Is Venice Token a Good Buy at Current Prices?
Venice Token has multiplied within twelve months and has been correcting since its September high. We check the chart, the supply and the risks of VVV against the question of whether the token is a good buy at the current price.
October 26, 2026 11:22 PM

Is Sky a Good Buy at Current Prices?
Sky is the renamed MakerDAO, and its governance token is tied to the earnings of a lending protocol with its own stablecoin. Is SKY a good buy at current prices? We weigh the chart position, the savings rate, supply mechanics and the open question of European regulation.
October 21, 2026 12:33 AM

Is Worldcoin a Good Buy at Current Prices?
As of November 11, 2026: Worldcoin has fallen below both moving averages and the marks of the October analysis, while the twelve-month low holds. What chart, supply and World ID now mean for buying WLD.
October 9, 2026 1:06 PM

Ethereum Price Under $2,500: Is ETH a Good Buy Right Now?
Ethereum has slipped below $2,500 and the question in every chat group is the same: buy the dip, or stay out? Here is what is driving the price, what the near-term levels are, and what the long-term forecasts actually assume.
October 7, 2026 8:42 PM
Can XRP Price Reach $10? Here Is What the Math Says
XRP trades near $1.42 after losing $1.50. We check the $10 forecasts, the charts and the market cap math to see if XRP can really reach $10.
October 3, 2026 11:01 AM

XRP Price Prediction: Can XRP Hit $3 Soon If the Bull Market Returns?
XRP is stuck near $1.50 in a falling wedge. Our XRP price prediction maps the path to $2, $2.75 and $3 if the crypto bull market comes back.
September 28, 2026 9:47 AM
XRP Price Drops Below $1.50: Where Is Ripple Heading This Week?
XRP price slips under $1.50 after a red weekend. Here is the XRP price analysis with the higher and lower targets that matter this week.
September 28, 2026 4:28 AM

Is Quant a Good Buy at the Current Price?
Quant climbed as high as 357 dollars after the bank mandate and has since fallen back sharply. Is QNT a good buy at the current price? We check the chart, volume, the banks' timetable and the token's role with our own data.
September 22, 2026 5:54 PM
XRP Price Prediction: Breakout Puts $1.80 Back In Play
XRP just snapped its descending trendline and reclaimed $1.50 with RSI at 67. Here is what the daily chart says about the road to $1.80 and above.

September 18, 2026 9:03 PM

XRP Price Recovers After the CLARITY Act Failure: What the CFTC Filing Changes for XRP Investors
XRP climbs a good 7 percent within 24 hours to $1.39, three days after the US Senate stopped the CLARITY Act. What the new CFTC rule filing means, what it does not deliver, and what you should check before your next purchase or sale.
September 18, 2026 11:39 AM
Ethereum Price Prediction: Why ETH Is Closing In on $3,000
Ethereum is coiling between $2,400 and $2,600 with a rising 200 EMA underneath. Here is what the ETH chart says about $3,000.
September 11, 2026 9:50 AM

XRP Price Crashes 6% in a Week: Buying Opportunity?
XRP price fell 6.45% this week to $1.35 and is now sitting on its 200 EMA. Here is what the chart says before the Senate vote on September 15.
September 2, 2026 4:28 PM
XRP ETFs Just Had Their Best Week of 2026. So Why Is the Price Still Falling?
US spot XRP ETFs pulled in record weekly inflows while XRP slipped toward $1.38. A Senate vote on September 15 may decide who is right.
August 30, 2026 10:56 AM
Ethereum Price Prediction: Can ETH Blast Toward $2,750 Next?
Ethereum price prediction after a 30% August rally: ETH sits at $2,453 with RSI cooling. Here are the bullish and bearish ETH price targets.
August 27, 2026 4:31 AM

Is AAVE a Good Buy at Current Prices?
As of November 11, 2026: AAVE has slipped below its 50-day and just below its 200-day average, while the August mark still holds. We check with our own price data what that means for buying at current prices.
August 24, 2026 12:34 AM

Is Monero a Good Buy at Current Prices?
Monero broke above the level we named in September as the test for a trend change. What the breakout, an overbought RSI and EU rules mean now: is Monero a good buy at current prices?
August 24, 2026 12:19 AM

Is Zcash a Good Buy at Current Prices?
Zcash has given back part of its September advance and now sits just above its 50-day average. We look at what the trend, the RSI and the turnover actually support, and under which conditions the case for buying ZEC breaks down.
August 19, 2026 6:42 PM

XRP Price Explodes 6.6%: Here Is the Next Target
XRP printed a low of $0.99524, took out every stop under the dollar, and closed 7.9% higher. Here is what the reversal sets up.
August 16, 2026 3:33 PM
XRP Price on the Edge of $1: Why the Next Bitcoin Drop Could Crash XRP to $0.80
XRP price is stuck at $1 after breaking it several times. Weekly RSI at 31 and a weak Bitcoin put the next supports at $0.90 and $0.80.
August 11, 2026 4:58 PM
XRP Crashes Below $1: 5 Reasons Behind the Drop
XRP printed 0.99057 and lost the $1 level it held for months. ETF demand, long liquidations, on-chain decay, CLARITY and CPI all played a part.
More from CryptoTicker