
Is Zcash a Good Buy at Current Prices?
Zcash has given back part of its September advance and now sits just above its 50-day average. We look at what the trend, the RSI and the turnover actually support, and under which conditions the case for buying ZEC breaks down.




Which topics should we dive deeper into?
Select what genuinely interests you. Your picks feed directly into our editorial planning.
Crypto news that's actually worth your time.
Weekly. 60 seconds. Carefully curated by our editors: no hype, no promo flood, no spam.
Zcash (ZEC) changes hands at 1,328.08 US dollars, 19.7 per cent below the highest daily close of the past twelve months, 1,653.12 US dollars, printed on 27 September 2026. In March the coin closed as low as 197.12 US dollars. The rally has carried Zcash to a market capitalisation of 22.55 billion US dollars. The question here is narrower than the rally: is Zcash a good buy at current prices?
cryptoticker.io collected the price data for this analysis on 12 October 2026. The source is public market data from CoinGecko, the method is 365 daily closing prices in US dollars, and from those closes we calculated the 200-day and 50-day exponential moving averages, the 14-day relative strength index using Wilder's smoothing, and the twelve-month high and low. The live spot price is the quote at the time of collection.
Zcash price analysis: where the ZEC price stands and which levels matter
The ZEC price of 1,328.08 US dollars still stands above both moving averages our calculation produces. The 200-day exponential moving average sits at 768.37 US dollars, roughly 42 per cent below the current price. The 50-day exponential moving average sits at 1,194.39 US dollars, about 10 per cent below the spot quote. Only the shorter of the two is close enough to work as support in any practical sense.
The twelve-month high of 1,653.12 US dollars matters most in the short run. It was set on 27 September and now sits 19.7 per cent above the market, so it is the first resistance a renewed advance would meet. Below the current quote, the first zone with trading history is the 1,186 to 1,365 US dollar area the price has traded through over the past week; below that, the 200-day average near 768 US dollars forms a wider shelf. Those zones are what a pullback would test first.
The twelve-month low of 197.12 US dollars from 8 March 2026 matters for a different reason. It is 574 per cent below today's price, and it says how much of the current quote is recent: a buyer at 1,328.08 US dollars is buying an asset the market repriced almost sevenfold inside seven months.
Is the Zcash downtrend broken or only interrupted?
For Zcash the question runs the other way round: there is no downtrend left to break. The price is above the 200-day exponential moving average of 768.37 US dollars and above the 50-day average of 1,194.39 US dollars, the shorter average is above the longer one, and the twelve-month change is plus 408.3 per cent. On the standard reading of trend structure this is an established uptrend, not a recovery inside a falling market.
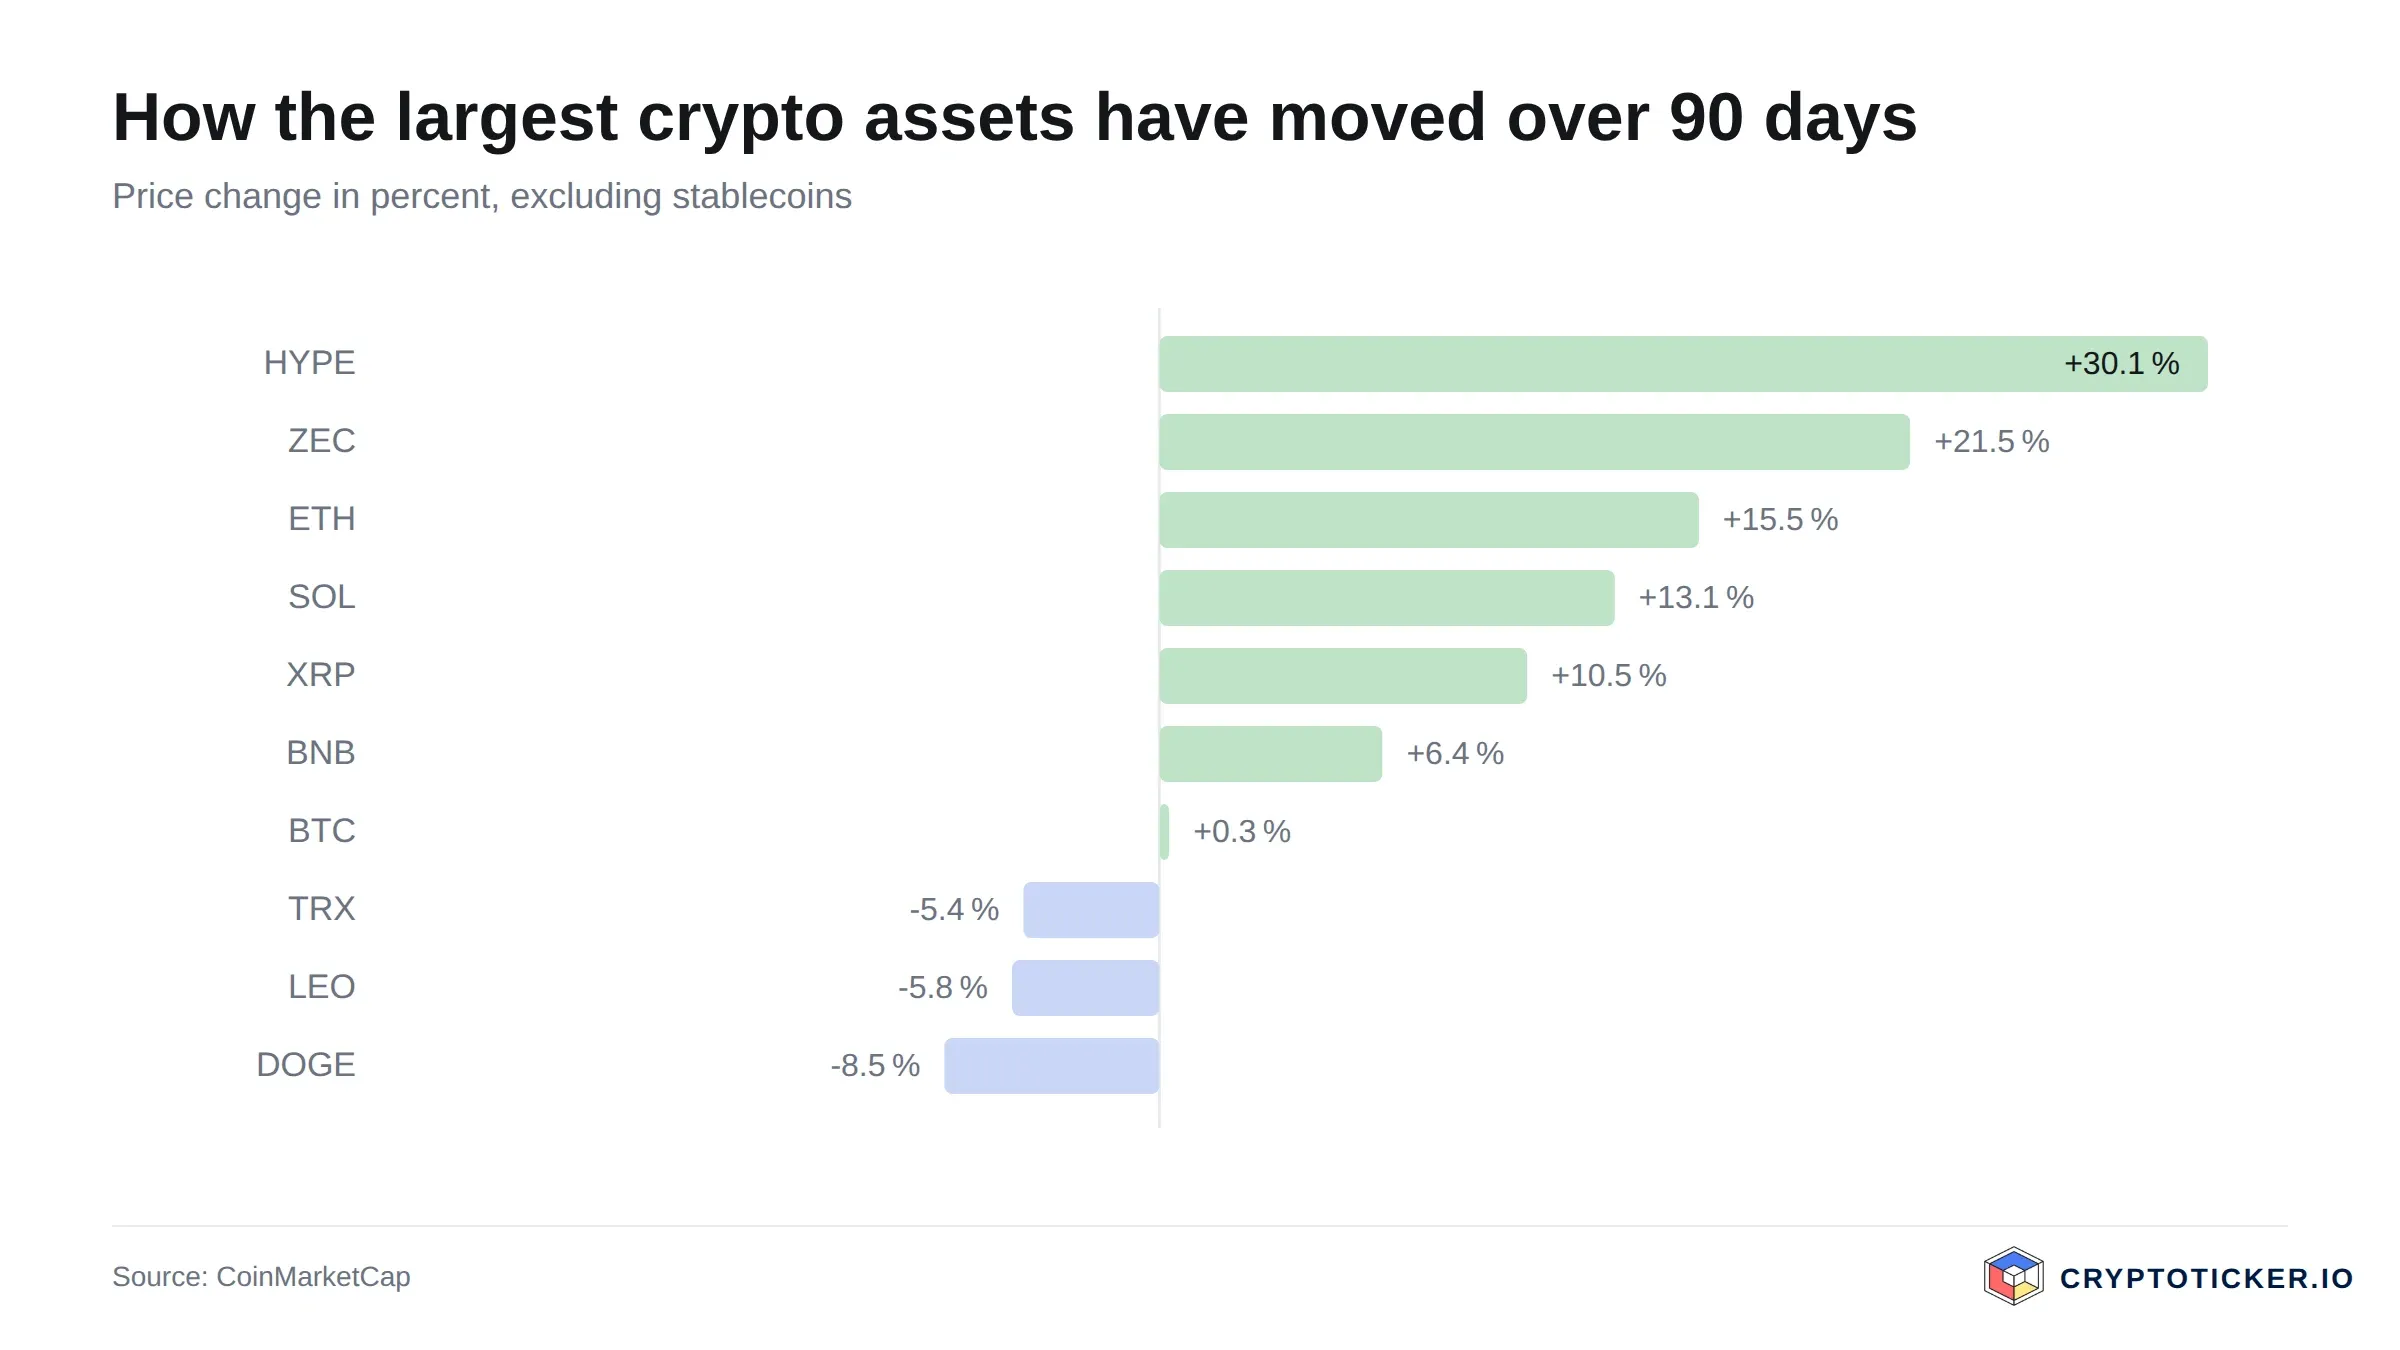
What is open is whether the advance resumes. Zcash lost 0.7 per cent over seven days, while thirty days show a gain of 18.4 per cent and ninety days one of 135.4 per cent. The quarterly figure now dwarfs the weekly one, so the move has stalled rather than accelerated since the September high. Advances of that size most often pause for an extended period before they continue. The fair description is an intact uptrend in consolidation, and that is an assessment rather than a measurement.
What the RSI and moving averages mean for a Zcash entry
The 14-day relative strength index stands at 51.5, in the middle of its scale and well clear of the range conventionally called overbought. The reading does not predict a rise; in strong trends the RSI can stay above 70 for weeks, and in a consolidation it drifts back to the middle. What it says is that the short-term overheating of September has been worked off.
The distance to the moving averages sharpens the point. A buyer at 1,328.08 US dollars is 73 per cent above the 200-day average at 768.37 US dollars. A return to the 50-day average at 1,194.39 US dollars would be a decline of about 10 per cent from here, and a return to the 200-day average about 42 per cent, either without damaging the longer-term trend. A position entered now has to tolerate that as normal behaviour, which makes position size the practical question rather than timing the top. Our Zcash price prediction page tracks these levels as they move.
What Zcash trading volume reveals about real demand
Turnover has cooled with the price rather than collapsed. Volume over the past 24 hours was 973.7 million US dollars against a 30-day average of 1,186.4 million and a 90-day average of 787.1 million US dollars, so current turnover runs about 18 per cent below the thirty-day norm and still above the quarterly one.
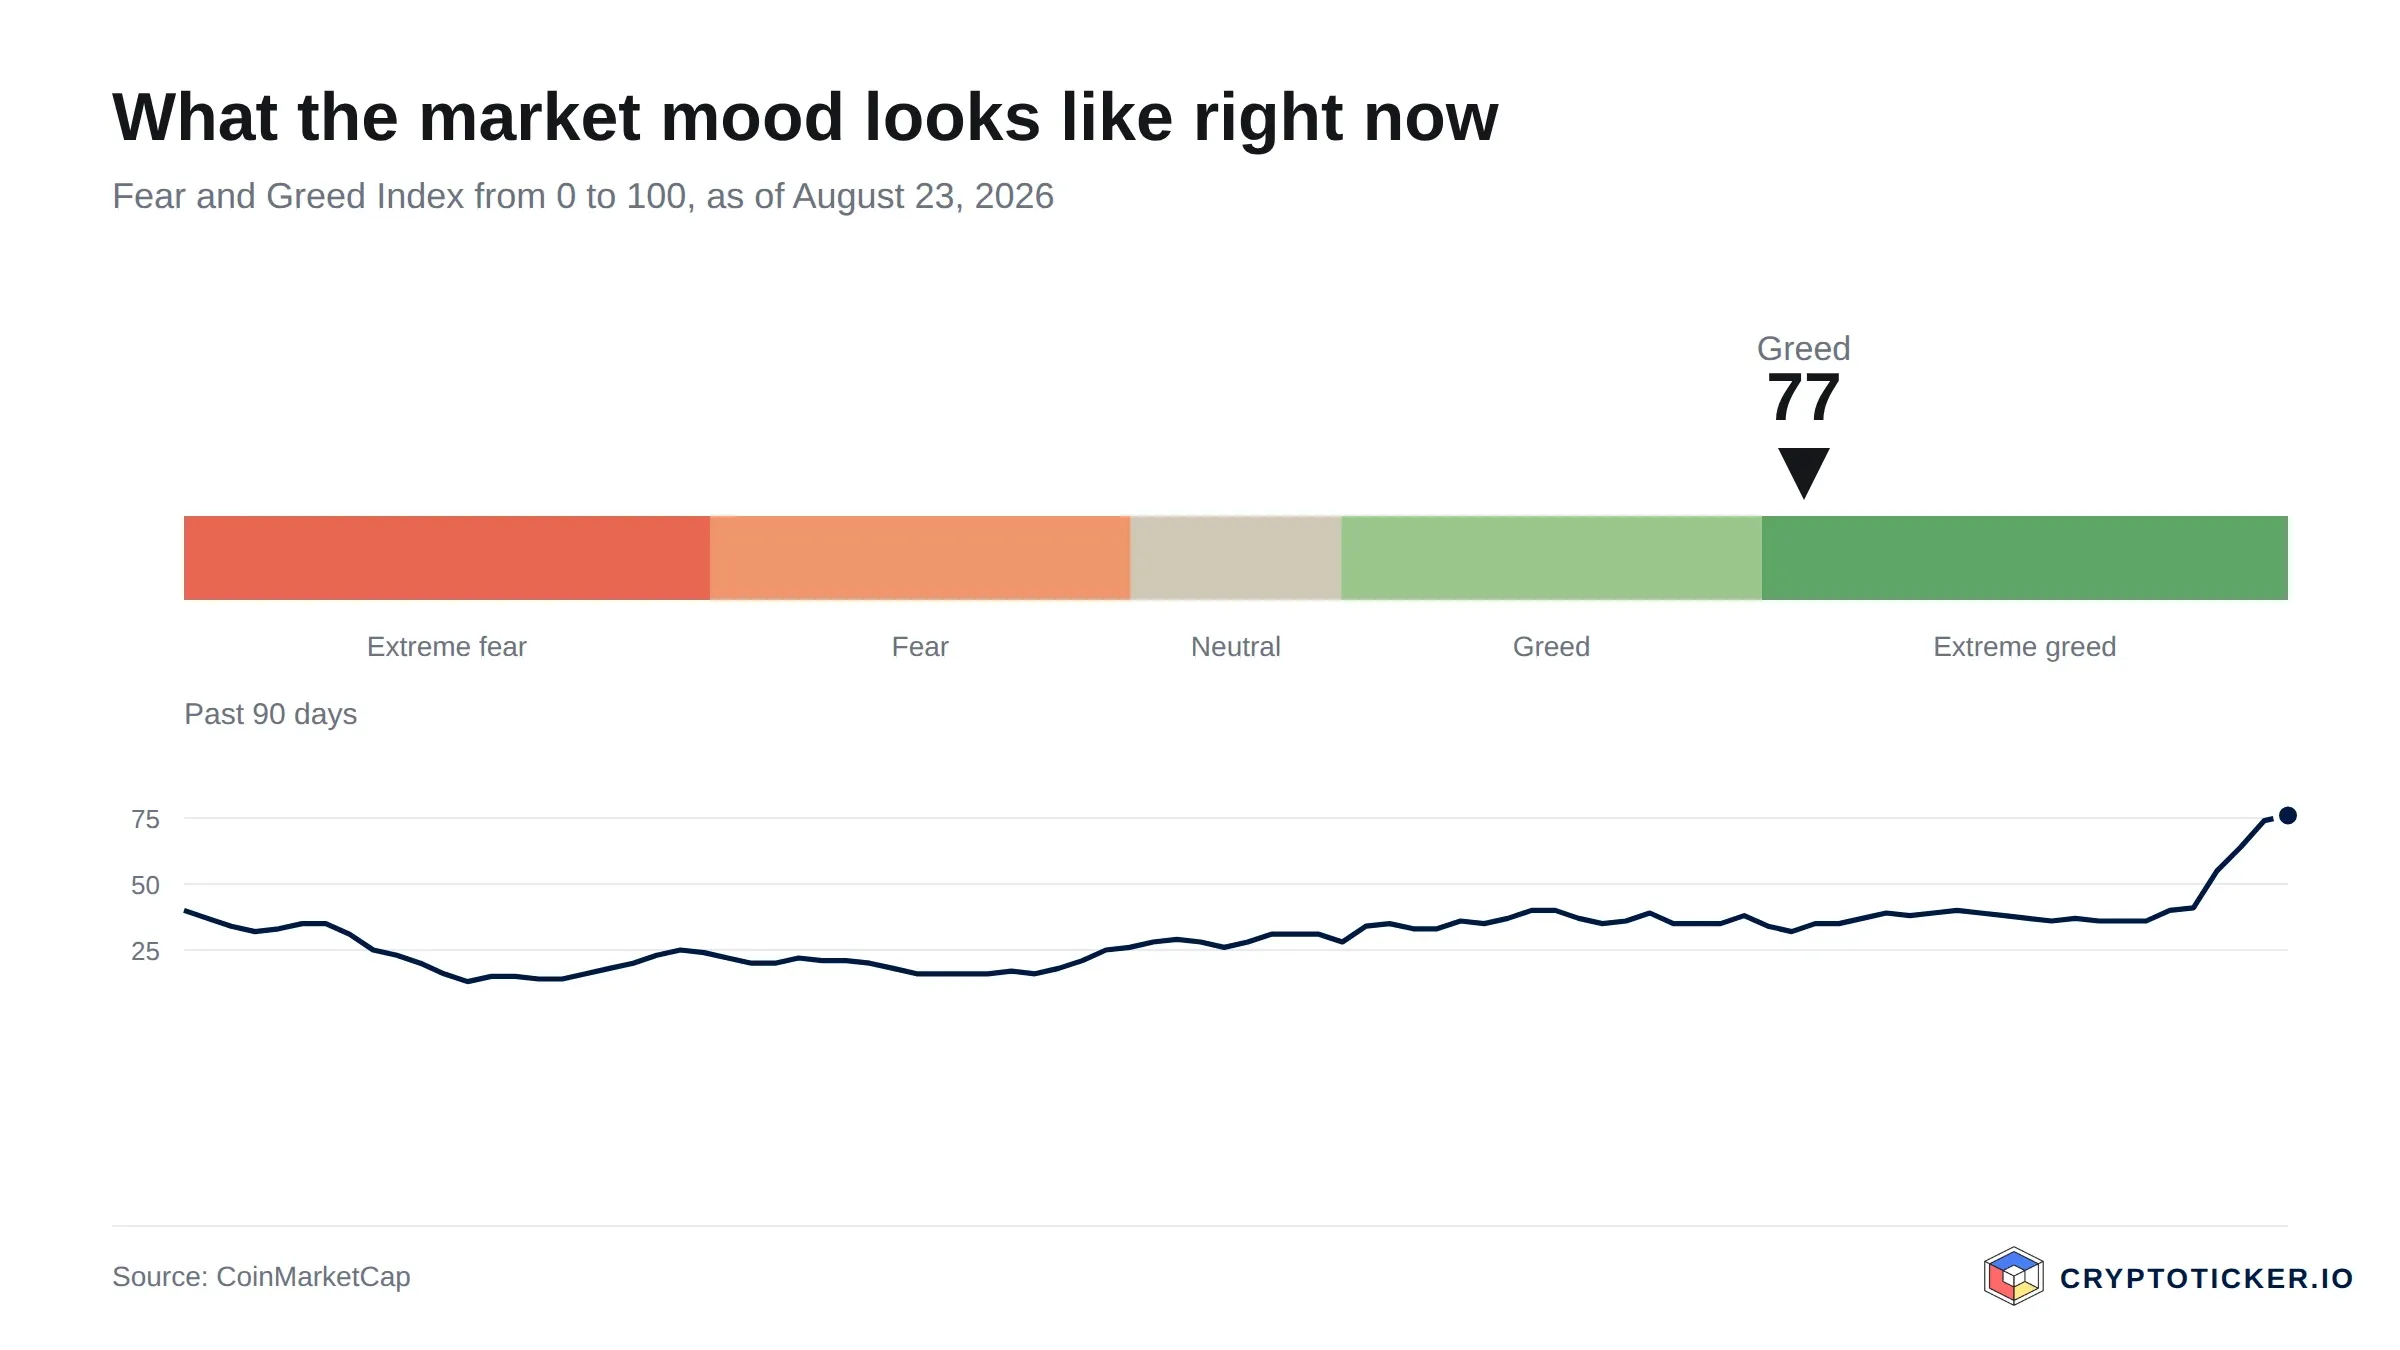
Read one way, that is orderly: turnover easing after a high is what a consolidation looks like, and it still exceeds the quarterly average. Read another way, it warns that the buyers who drove September have stepped back, and a renewed advance would need them again. The spread and depth a buyer sees today are no longer those of a breakout week. The wider backdrop remains warm rather than fearful: the Fear and Greed Index stood at 69 on 12 October 2026, in the greed range, which describes crowd positioning rather than value.
Which structural factors speak for Zcash: supply, shielded transactions and regulation
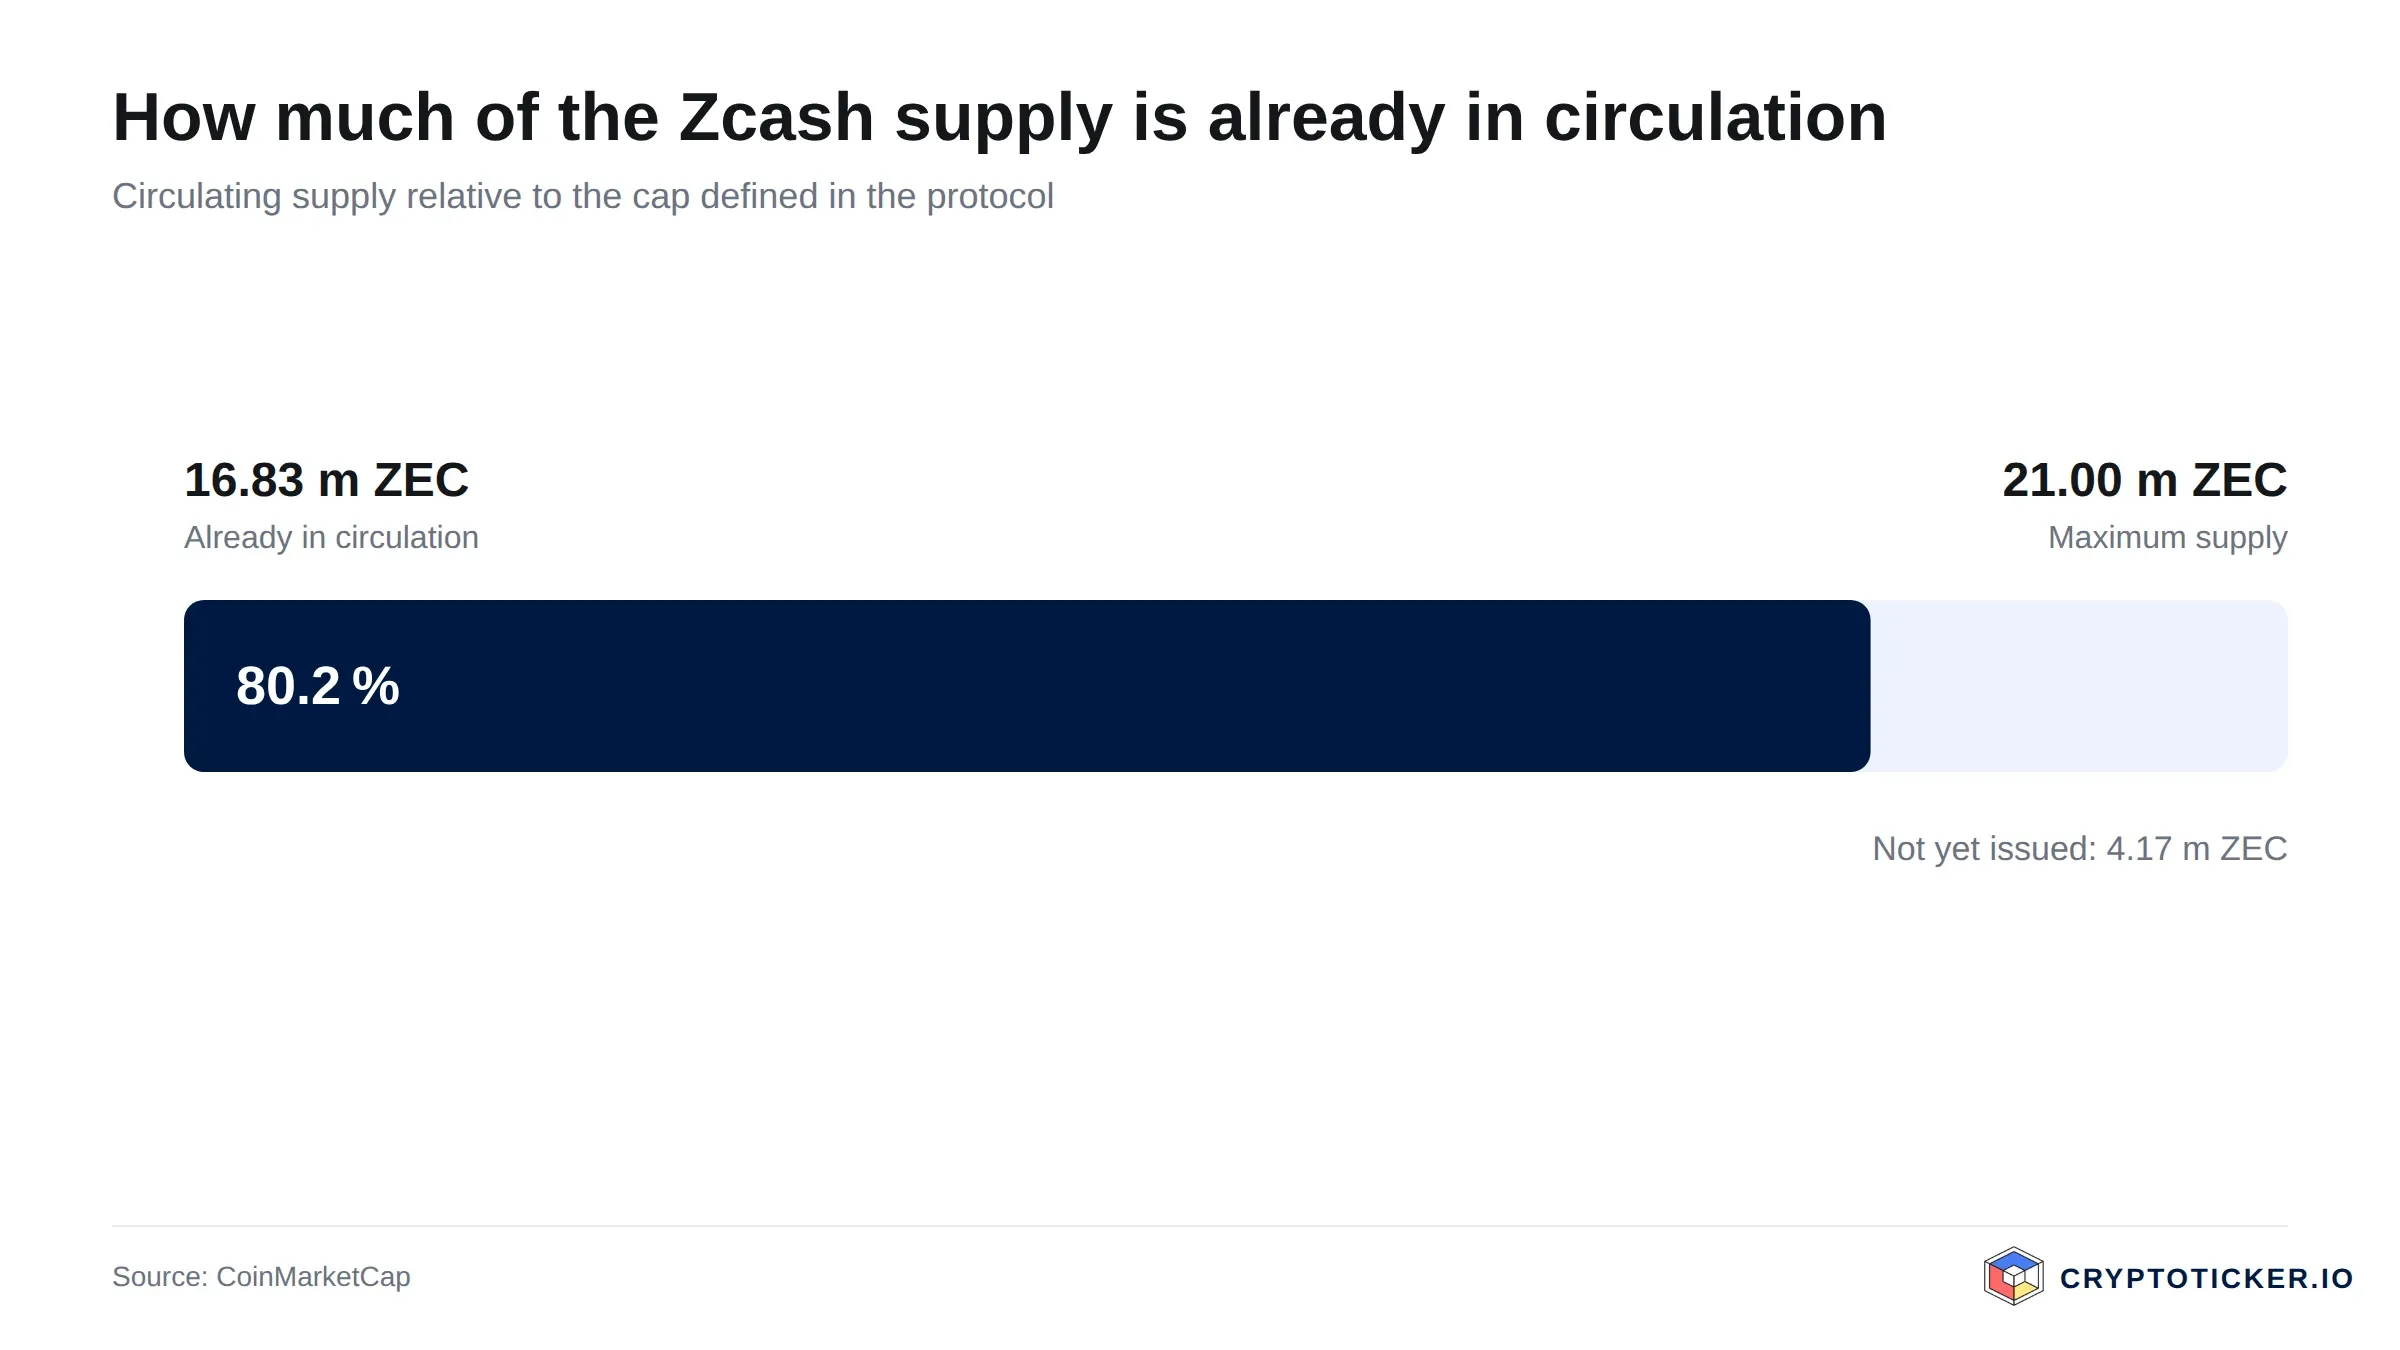
Zcash shares the basic shape of its supply schedule with Bitcoin. The maximum supply is 21 million coins, roughly 16.98 million are in circulation, just over 80 per cent of the eventual total, and issuance falls at scheduled halvings. The rules are set out in the Zcash protocol specification.
The distinguishing feature is optional shielding. Transactions can be transparent or shielded using zero-knowledge proofs, so sender, receiver and amount need not be public. That is the investment case and also the risk: demand for a chain that can hide its own contents responds to different events than demand for a payment network.
Funding is the third structural item. Development is financed through a share of block rewards, the arrangement established in ZIP 1014. That gives the project a revenue stream independent of donations, and it makes the allocation a recurring subject of governance disputes among holders.
On the regulatory side the position is unsettled, and we mark this as an assessment. European anti-money-laundering rules adopted in 2024 and applying from July 2027 are widely read as restricting how regulated providers may handle anonymity-enhancing coins, and how supervisors will treat an asset whose privacy is optional is not settled in practice. Several large exchanges have already removed privacy coins in individual jurisdictions.
What speaks for buying Zcash at current prices
Three arguments carry weight at 1,328.08 US dollars.
The trend structure is intact and the price has returned to its shorter average. Price above both the 200-day average of 768.37 US dollars and the 50-day average of 1,194.39 US dollars, with daily volume of 973.7 million US dollars still above the 90-day norm of 787.1 million, is the combination trend-following approaches are built to act on. Momentum is not a valuation, but it is an observable fact about this market.
The supply side is fixed and largely issued. With roughly 16.98 million of a maximum 21 million coins in circulation and issuance falling on a schedule, new supply is a known and shrinking quantity. That puts no floor under the price, but it means selling pressure comes from existing holders rather than from open-ended issuance.
Privacy is a durable, undiversified theme. Few assets offer shielded transactions on a chain with this operating history and this depth of liquidity. If demand for on-chain privacy grows, there are not many places for it to go, and Zcash is one of them. That concentration cuts both ways.
What speaks against buying Zcash at current prices
Three arguments run the other way, and they are specific to the price rather than to the asset.
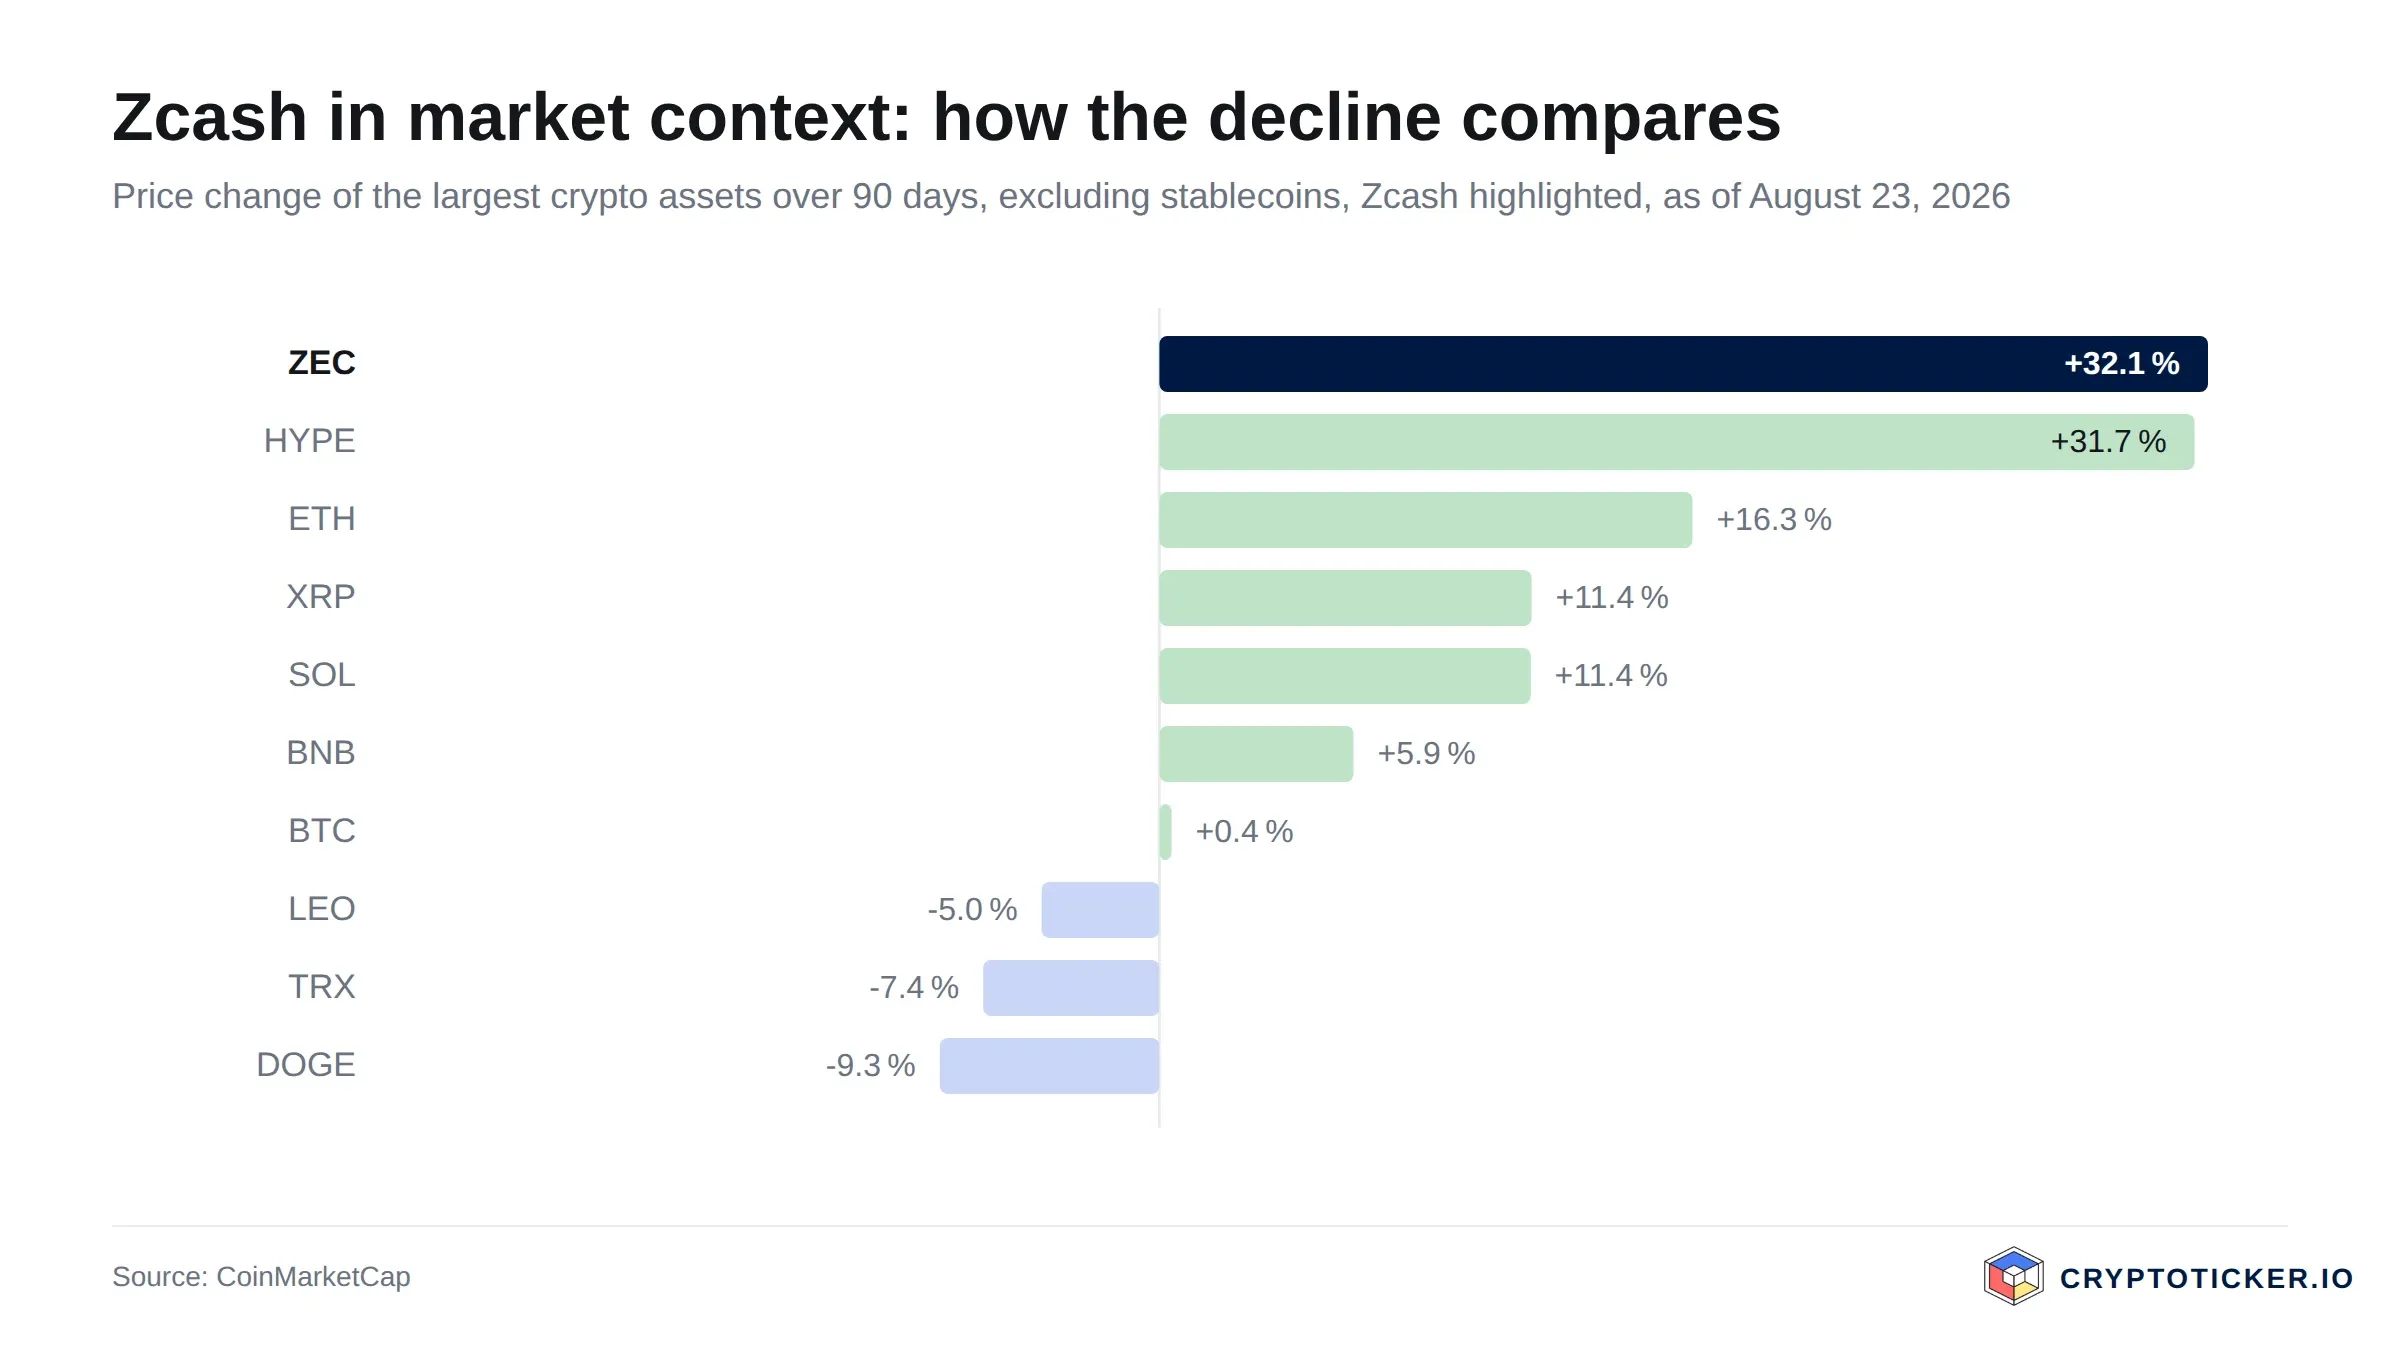
The entry point is still extended on the longer measure. At 1,328.08 US dollars the price is 73 per cent above the 200-day average of 768.37 US dollars, though only 10 per cent above the 50-day average of 1,194.39 US dollars and 19.7 per cent below the twelve-month high close of 1,653.12 US dollars, with the RSI at 51.5. A return to the 200-day average would be ordinary behaviour in an uptrend and a loss of roughly 42 per cent for a buyer at today's quote.
The move is large and has already stalled once. Plus 135.4 per cent in ninety days and plus 408.3 per cent over twelve months, followed by a 19.7 per cent retreat from the September high, is the shape of a market digesting a steep advance. Much of the capital behind that advance sits above the current price, so rallies into the high can meet selling.
The regulatory path narrows rather than widens. An exchange that decides privacy coins are more trouble than they are worth removes both a venue and a share of liquidity. That risk applies to Zcash in a way it does not apply to a transparent chain, and no indicator above prices it. Where to hold the coin therefore matters more here than for most assets, which is why the hardware wallet comparison belongs in the decision.
How to buy Zcash at current prices: costs, custody and providers
Three cost blocks decide what a Zcash position costs. The trading fee typically runs between 0.1 and 1.5 per cent depending on venue and order type. The spread is the invisible one, and on 973.7 million US dollars of daily turnover it is wider than during the September breakout, which argues for limit orders. The withdrawal fee applies if the coins leave the exchange.
On venue choice, availability is the first filter here rather than the fee schedule, because not every regulated exchange lists Zcash. The exchange comparison sets out the fee structures side by side, and the comparison of regulated exchanges is the more relevant one, since a licensed venue is also the kind most exposed to a future rule on anonymity-enhancing assets. Individual platforms are covered in our Kraken review and our Bitpanda review. Fees and listings change, so check them with the provider before buying.
On custody, self-custody removes counterparty risk and adds the risk of losing the keys. For Zcash there is a second consideration: wallet support for shielded addresses is uneven, so anyone intending to use shielding should verify it before transferring anything.
Is Zcash a good buy at current prices, short term and long term?
Short term, the numbers no longer argue against entry as plainly as they did. A price 19.7 per cent below the twelve-month high close of 1,653.12 US dollars, 10 per cent above the 50-day average of 1,194.39 US dollars, with an RSI of 51.5 and a flat week behind it, describes a market that has paused rather than one that is running. That is not a forecast of a rise; it says the reward-to-risk of entering here is better than it was at 1,653.12 US dollars and still poor against the 200-day average.
Long term, the case rests on one question no chart answers: whether demand for shielded transactions grows or shrinks over the next several years. If it grows, the fixed supply of 21 million coins does the work and the entry price matters less than the holding period. If it shrinks, or if regulated access narrows first, the 200-day average at 768.37 US dollars is a reminder of where this asset traded for much of the past year.
We would treat the constructive reading as falsified if the price closed back below the 50-day average of 1,194.39 US dollars, which would place the September advance back inside the prior range. We would treat the cautious reading as falsified if the price reclaimed 1,653.12 US dollars on a weekly basis while daily turnover stayed above the 90-day average of 787.1 million US dollars, which would mean the new level had found holders rather than a week of traders. Those are scenarios and conditions, not recommendations.
Buying Zcash: what to take away
- The trend is intact and the entry is less extended than it was. At 1,328.08 US dollars against a 200-day average of 768.37 and a 50-day average of 1,194.39 US dollars, both are true at once, and the first governs position size. Levels are updated on our Zcash price prediction page.
- The privacy feature is the thesis and the risk. Shielded transactions make Zcash different and make its regulatory path uncertain. Background to the current move is in our report on the Ironwood upgrade rally, the counter-case in the crash of June 2026.
- Where you hold it is part of the decision. Access through regulated venues may narrow for anonymity-enhancing assets, which makes custody a live question. Start with the regulated exchange comparison before deciding on size.
Disclosure: Some of the providers mentioned in this article work with us through partner programmes. This has no influence on the price analysis or on our assessment of the chart situation; the price data comes from a public market data source and can be verified there.
(As of 12 October 2026. This article is not investment advice. Prices, fees and terms change; check them with the provider before every purchase. Crypto assets are subject to high price volatility and a total loss is possible.)
Transparency note: This article was produced with the assistance of artificial intelligence and reviewed by our editorial team before publication. All figures and claims were checked against the primary sources linked in the text. The feature image was generated with AI.
Related articles
Which topics should we dive deeper into?
Select what genuinely interests you. Your picks feed directly into our editorial planning.
Crypto news that's actually worth your time.
Weekly. 60 seconds. Carefully curated by our editors: no hype, no promo flood, no spam.

August 3, 2026 10:41 AM
Is XRP Coin a Good Buy At Current Prices?
XRP trades at $1.4048 and has given back the $1.50 level. Why the zone around $1.39, where both EMAs now sit together, decides as support whether the reversal holds.

September 29, 2026 1:33 AM
Zcash falls 8.5 percent as open interest shrinks 13.5 percent: the level that decides
Zcash trades at around $1,464 on September 28, 2026, 8.5 percent below the previous day. Our own measurement of open interest on OKX shows a fall of 13.5 percent in 24 hours, so more leverage unwinding than price loss.
June 4, 2026 4:30 PM
Zcash Crash: Why Is ZEC Falling Harder Than the Rest of the Crypto Market?
Zcash price crashes harder than major cryptos as ZEC faces profit-taking, technical uncertainty, and renewed pressure after its recent rally.
September 23, 2024 8:44 AM
Is it a Good Idea to Buy XRP below $0.60?
With recent XRP price drops positioning it below the $0.60 mark, investors are left pondering. Is it a good idea to buy XRP below $0.60?
January 8, 2026 10:36 PM

Zcash Price Crashed 20% as the Core Developer Team Resigned in January 2026, and Then Rallied
ZEC fell about 20% on 8 January 2026 after the Electric Coin Company team resigned. It slid to about $197 in March, then rallied to above $1,500 by September 2026.

October 12, 2026 10:31 AM

$1,332: Zcash is the only one of the ten largest coins with a weekly gain
Zcash stands at around $1,332, a good eight percent above the previous day. Among the ten largest cryptocurrencies, ZEC is the only one up over seven days. Two dates in October and November decide what holders have to settle beforehand.

September 28, 2026 4:28 AM

Is Quant a Good Buy at the Current Price?
Quant has broken out sharply after a mandate in US payments and stands at its highest level in twelve months. Is QNT a good buy at the current price? We examine the chart situation, volume and supply mechanics with our own data.
August 27, 2026 4:31 AM

Is AAVE a Good Buy at Current Prices?
AAVE has worked its way back above both the 200-day and the 50-day moving average, yet still trades far below its twelve-month high. Using our own price data, we examine what speaks for and against an entry at current prices.
August 27, 2026 3:24 AM
Is Hedera a Good Buy at Current Prices?
HBAR has bounced off its twelve-month low but still trades well below its long-term average. We weigh moving averages, RSI and volume to judge whether Hedera is a good buy at the current price.
August 27, 2026 2:21 AM
Is SUI a Good Buy at Current Prices?
SUI has reclaimed its 200-day moving average and trades 82 percent above its twelve-month low. We check whether the coin is a good buy at current prices.
August 16, 2026 12:21 PM

Is Toncoin a Good Buy at Current Prices?
Toncoin has reclaimed both of its moving averages and now goes by the name Gram. We weigh what the chart, the RSI and the recovery in trading volume say for and against buying at current prices.
September 28, 2026 9:47 AM
XRP Price Drops Below $1.50: Where Is Ripple Heading This Week?
XRP price slips under $1.50 after a red weekend. Here is the XRP price analysis with the higher and lower targets that matter this week.
August 23, 2026 1:16 AM

Is PEPE a Good Buy at the Current Price?
PEPE is back above both moving averages and the 50-day has crossed the 200-day. Is the memecoin a good buy at the current price, or is the rally already running on thin volume?
August 24, 2026 12:50 AM
Is Bitcoin Cash a Good Buy at Current Prices?
Bitcoin Cash has rallied hard off its June floor, but it still trades below its long-term trend line with the RSI stretched. We work through what speaks for and against buying BCH at current prices.
August 11, 2026 5:35 PM

Is Ethereum a Good Buy at Current Prices?
Ethereum has fallen further than Bitcoin and recovered better of late. What chart structure, the fee mechanism and trading volume say about buying at current prices.
August 11, 2026 5:35 PM

Is Bitcoin a Good Buy at Current Prices?
Bitcoin trades about 28 percent below its twelve-month high and has reclaimed both moving averages. What chart structure, RSI and trading volume say about buying at current prices.
June 18, 2026 10:57 PM
Is Solana (SOL) a Good Buy at Current Prices?
Solana has traded above its 200-day average since August and the 50-day average joined it on 21 September, but volume is no longer keeping pace. What chart structure, issuance and tokenisation say about buying at current prices.
September 20, 2026 4:13 AM
Zcash Above $1,500: What ZEC Holders Should Check on Tax and Custody
Zcash rose above $1,500 on September 19 for the first time since 2016 and, after an intraday high of $1,590.80, trades back at around $1,474. For German holders three questions hang on that jump: the one-year holding period, the planned year-end cut-off and the EU anti-money-laundering regulation from July 2027.
August 23, 2026 7:34 PM

Buying Zcash Despite the EU Trading Ban: What Happens to Your ZEC From July 2027
From July 10, 2027 the EU anti-money-laundering regulation takes anonymity-enhancing crypto-assets out of regulated trading venues. What Article 79 forbids in its actual wording, why your own ZEC holding is not caught by it and what to sort out before then.
March 29, 2026 2:07 PM
Is Ethereum a Good Store of Value?
Is Ethereum a reliable store of value? We analyze ETH price history, the "ultrasound money" narrative, and its long-term potential for 2026 and beyond.
July 10, 2026 3:04 PM
Zcash Surges 8% as the Ironwood Upgrade Reignites Privacy-Coin Hype
Zcash is up more than 8% today and back above $500. Here is what is driving the ZEC rally and where analysts see the price heading next.
October 8, 2024 10:46 AM

This Memecoin Made 100% in 1 Month...Meet MOG Token
MOG crypto has seen a significant price increase over the past month, attracting attention from traders and investors.
September 20, 2026 9:21 AM

Is Ethena a Good Buy at Current Prices?
Ethena has rebounded hard off its twelve-month low and still trades far below its high. Is ENA a good buy at current prices? We check the chart, the supply schedule and the source of the yield with our own price data.
March 25, 2026 10:38 AM
Ethereum News: ETH Targets $2,200 as Geopolitical Tensions Ease and Bitcoin Reclaims $71k
Ethereum nears $2,200 while Bitcoin reclaims $71,000 amid reports of US-Iran peace talks. Here are the latest ETH chart trends and market sentiment for March 2026.
November 7, 2025 3:36 PM
Top 5 Privacy Tokens to Watch Before 2026
Zcash jumps 78% in a week, leading a major rally in privacy coins. Here are the top 5 privacy tokens by market cap in 2025.
October 12, 2026 10:27 AM
Is Bitcoin Still a Good Investment in October 2026?
Spot ETFs have changed who sets the Bitcoin price, and the easy repricing is behind us. What still supports BTC, what could break it, and how much belongs in a portfolio today.
September 20, 2026 1:27 PM

Why Is PEPE Rising Right Now? Three Explanations Circulate, None Is Documented
PEPE has been up by double digits for a week, and three reasons for it are doing the rounds online: whales are buying, a fund is coming, a large buyback is due. We checked all three. What the data really says, and how you tell whether a crypto report is worth anything.
More from CryptoTicker