
Is Sky a Good Buy at Current Prices?
Sky is the renamed MakerDAO, and its governance token is tied to the earnings of a lending protocol with its own stablecoin. Is SKY a good buy at current prices? We weigh the chart position, the savings rate, supply mechanics and the open question of European regulation.


Which topics should we dive deeper into?
Select what genuinely interests you. Your picks feed directly into our editorial planning.
Crypto news that's actually worth your time.
Weekly. 60 seconds. Carefully curated by our editors: no hype, no promo flood, no spam.
Sky changes hands at $0.0683 on Monday evening. That leaves the token 30.0 per cent below its twelve-month high of $0.0976, set on 5 October 2026, and 63.4 per cent above its twelve-month low of $0.0418 from November 2025. Which raises the question this article sets out to answer: is Sky a good buy at current prices?
cryptoticker.io measured the price data for this article on 26 October 2026 and calculated it from the daily closing prices published by CoinMarketCap. The moving averages, the RSI and the distances to the high and the low all come from the same series of 365 daily closes.
Sky is not an ordinary price case. The token has carried this name only since MakerDAO rebranded, and it is tied to the earnings of a lending protocol on the Ethereum blockchain. Buying SKY is less a bet on a price than a claim on a running business.
Advertisement: Crypto futures trading: Bitget offers leverage of up to 100x. Leverage can lead to high losses. Our exchange comparison shows more platforms.
Sky price analysis: the levels that matter at $0.0683
The price sits between its two most important averages. The 200-day moving average stands at $0.0667, the 50-day moving average at $0.0730. Sky therefore trades 2.5 per cent above the long-term line and 6.4 per cent below the short-term one. That describes an in-between zone: the long-term uptrend is intact, the short-term recovery is not.
On the downside, the 200-day average at $0.0667 is the first support, below which comes the area around $0.0600, where the price turned higher several times over the summer. The twelve-month low of $0.0418 would only come back into play in a broad market slide.
On the upside, the 50-day average at $0.0730 stands in the way first, then the zone around $0.0870, and only then the twelve-month high of $0.0976. That high is also the highest daily close the token has recorded since it began trading under this name in September 2024, which makes it the ceiling of its entire history rather than of one year. Market capitalisation comes to $1.60bn, placing Sky 52nd among the largest crypto assets.
Is the Sky downtrend broken or merely interrupted?
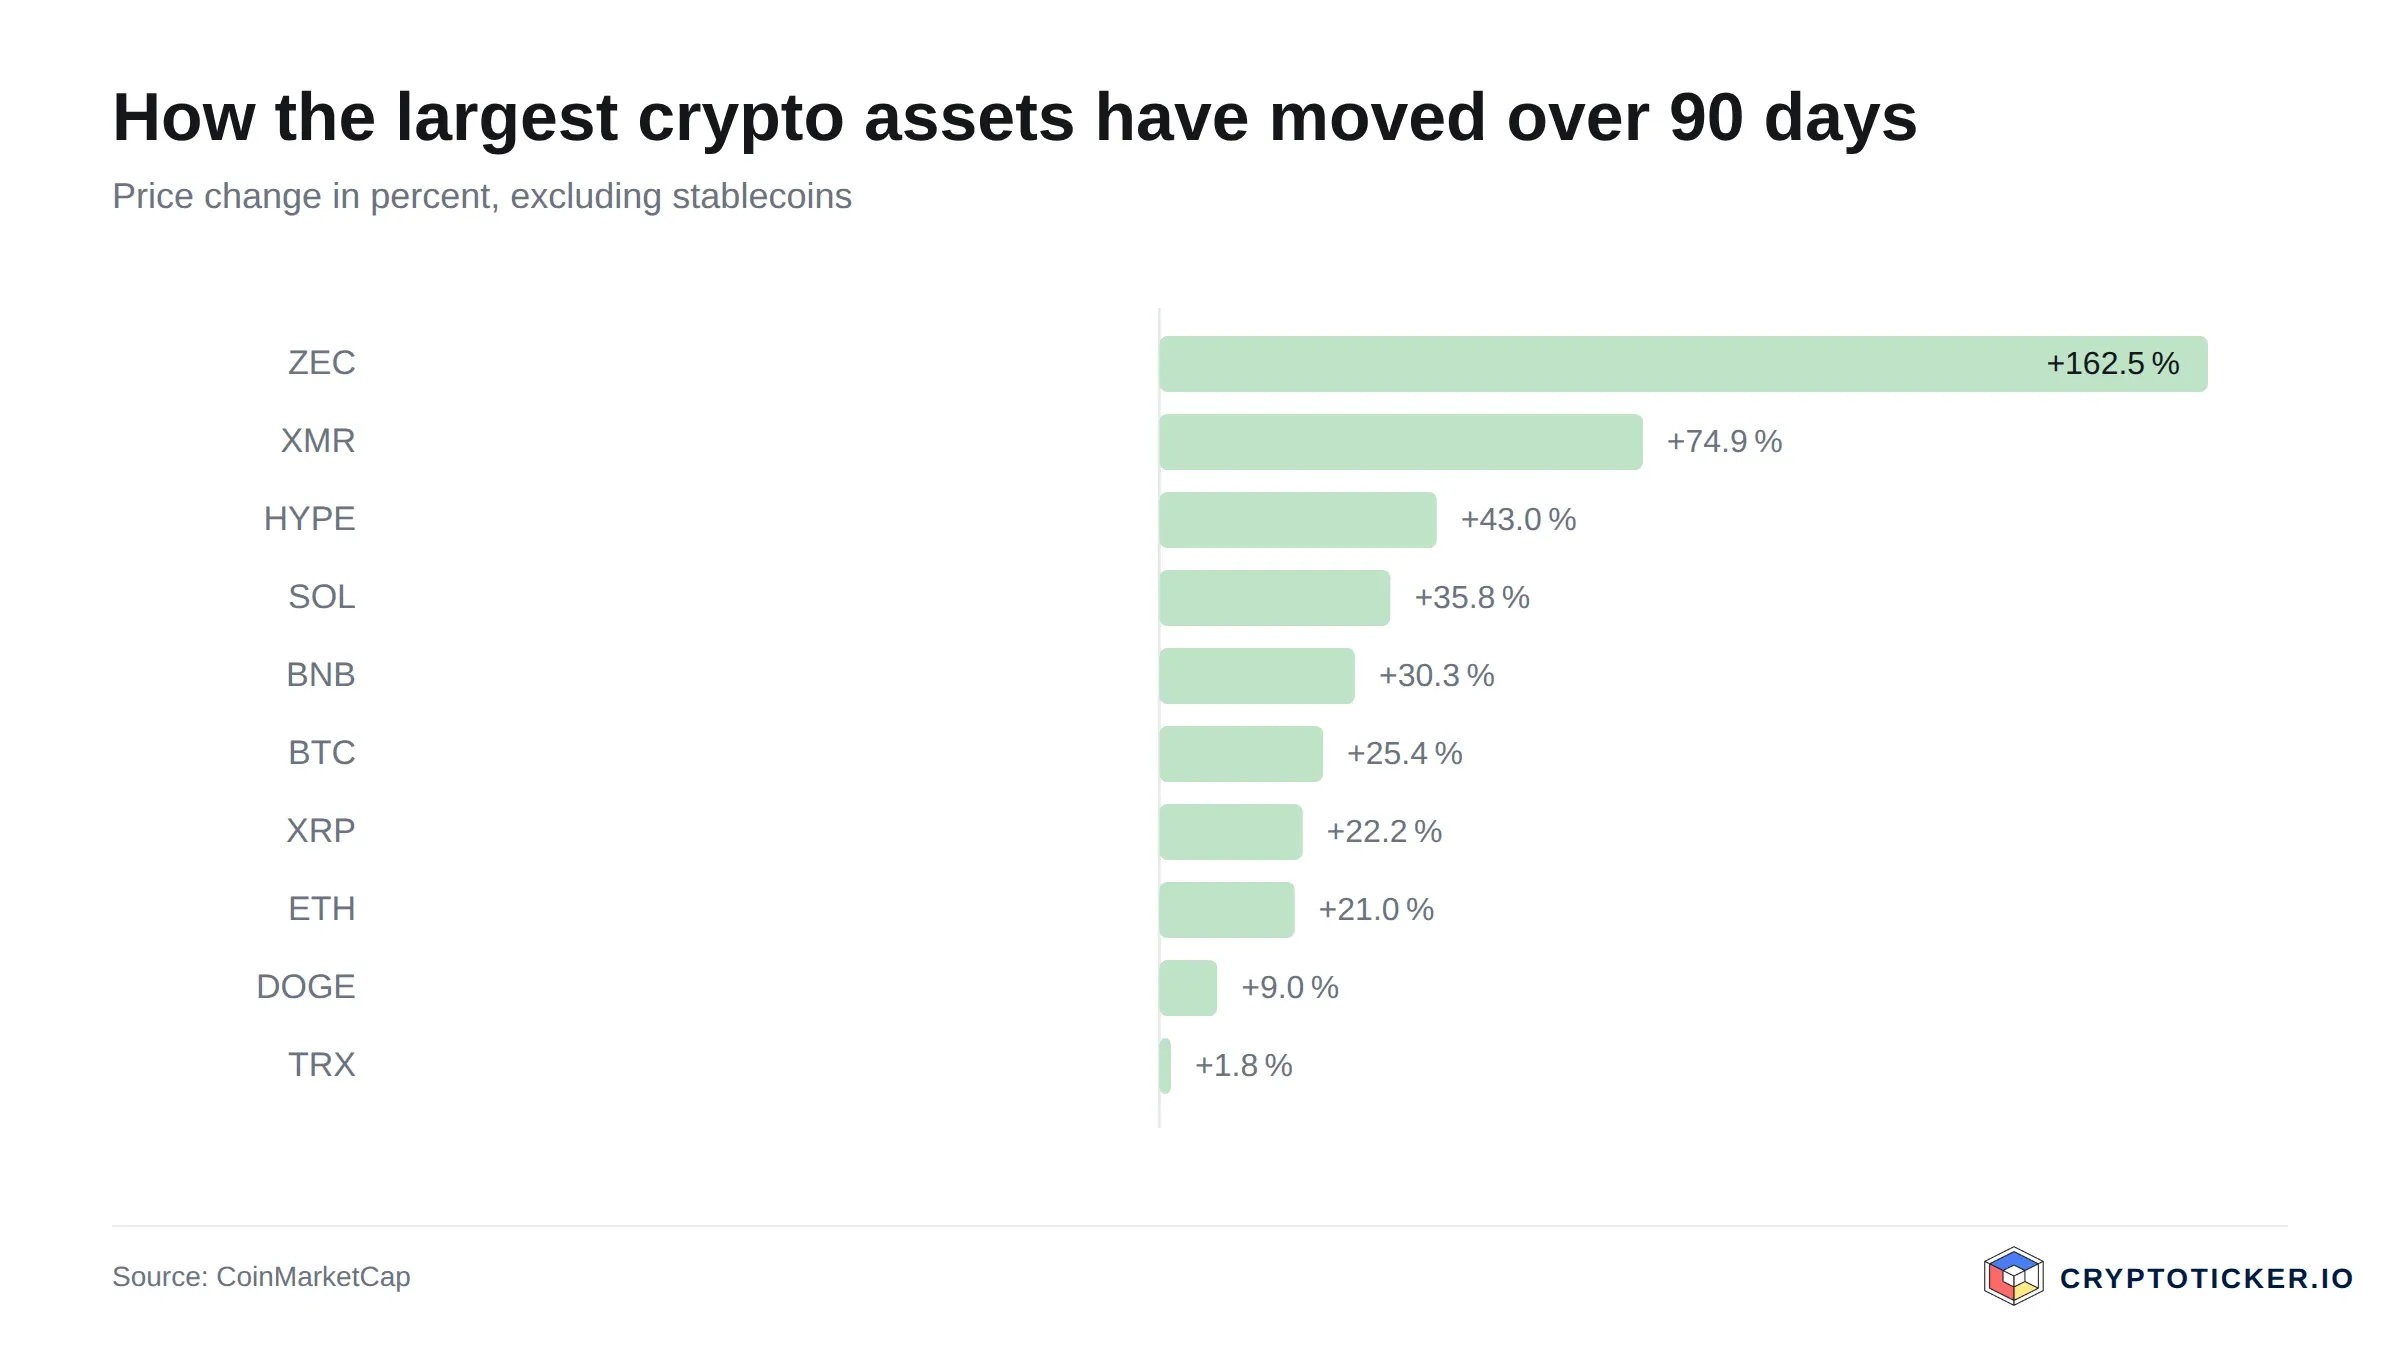
The question can only be answered by separating the time frames. Over 90 days the price is up 22.3 per cent, over 30 days it is down 12.2 per cent, and over twelve months it shows a gain of 18.6 per cent. What is under way is therefore not a downtrend but a correction inside an uptrend. For anyone considering an entry the difference is substantial: a correction ends at a support level, a trend break runs straight through it.
The correction counts as broken only on a daily close above the 50-day average of $0.0730. Above that, both averages work in the same direction again; below it, every advance remains a counter-move.
 Compare crypto exchanges and fees
What RSI and moving averages mean for a Sky entry
The 14-day RSI stands at 43.7. The relative strength index measures, on a scale from 0 to 100, how strongly the gains of recent days compare with the losses; below 30 counts as oversold, above 70 as overbought. A reading of 43.7 sits in neutral territory with a slight tilt to weakness: no buy signal from an overshoot to the downside, but no warning from the upside either.
With the averages, the order matters more than the distance. The 50-day average of $0.0730 lies above the 200-day average of $0.0667, a configuration that follows a longer advance and is read as a sign of an intact trend. The price itself stands between the two lines: too high for a bargain, too low for a confirmation.
The distance down to the first support is 2.5 per cent, the distance up to the first obstacle 6.4 per cent. Anyone building a position in two steps has room between those marks. How the zones look from the perspective of a longer forecast is set out in our price prediction for the protocol now called Sky.
What trading volume reveals about demand for Sky
Daily turnover amounts to $12.14m. Measured against a market capitalisation of $1.60bn, around 0.76 per cent of the outstanding supply changes hands per day. This is a thin market, and for a purchase decision that figure carries more weight than any trend line.
In such a market the execution price deviates more sharply from the quoted one, and that costs money on every entry and exit. For amounts above a few thousand euros a limit order is therefore worth more than one at the market price.
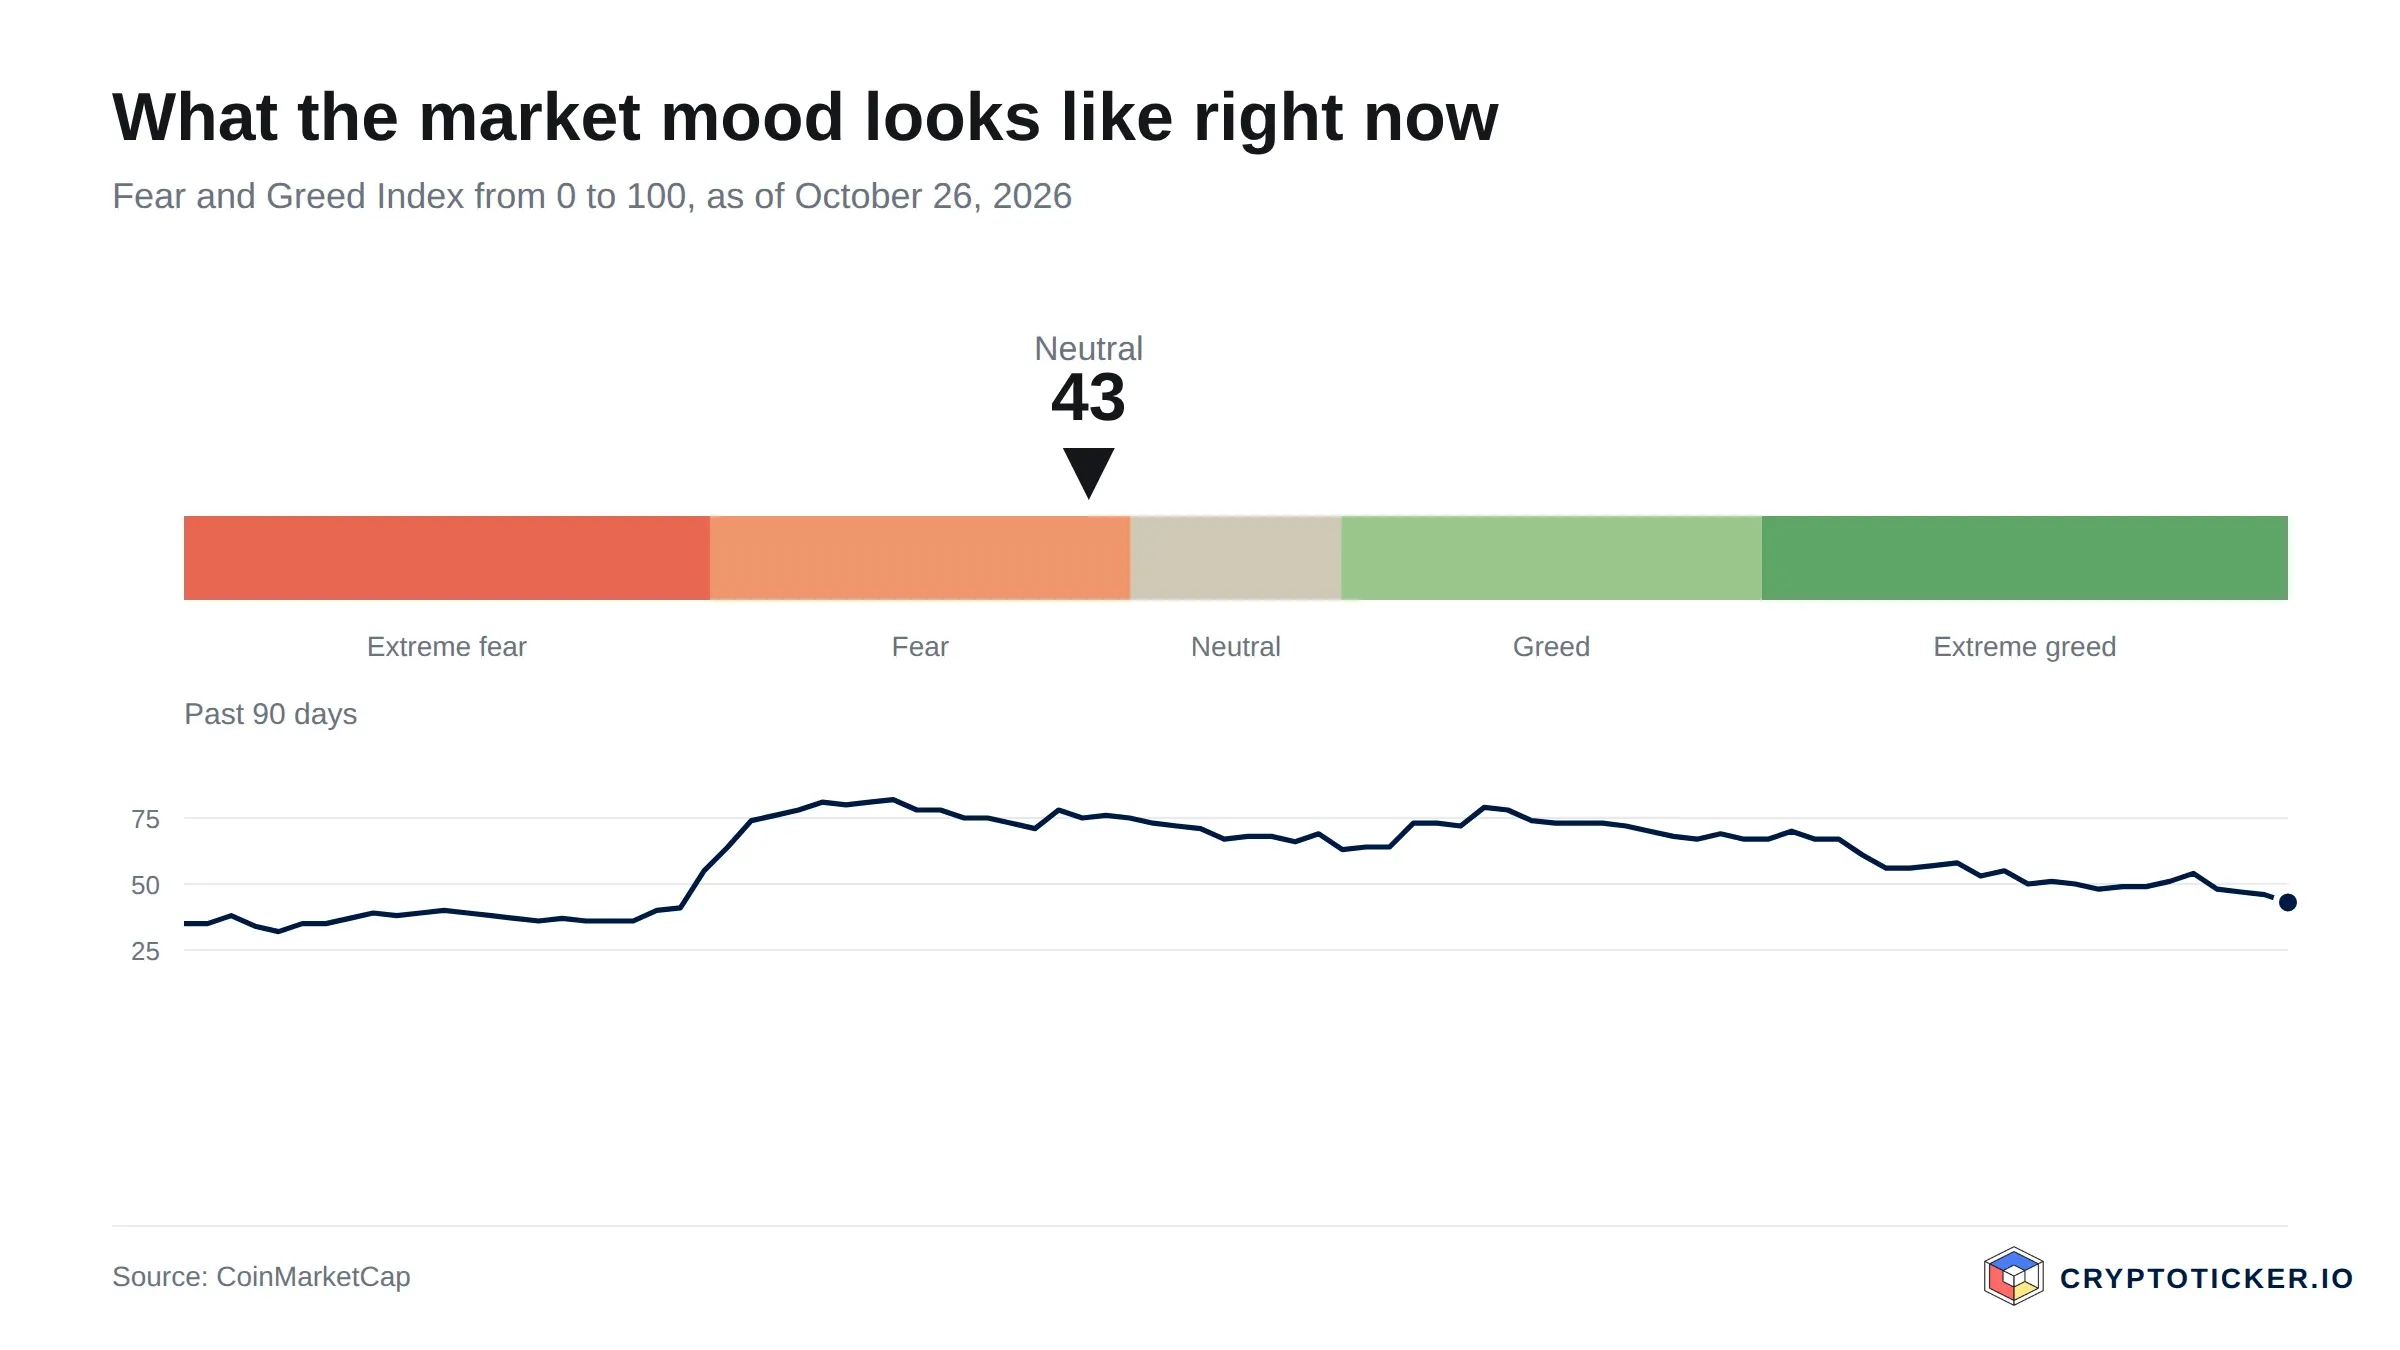
Turnover did not collapse in October, but neither did it rise, while the price gave up 12.2 per cent. That points to fading interest rather than selling pressure born of panic. Market sentiment is neutral, with the fear and greed index at 44 out of 100 points. For a token ranked 52nd, that leaves the protocol's own numbers as the deciding factor.
The structural factors that support Sky: USDS, savings rate and supply
Sky is the renamed MakerDAO. The governance token MKR is now called SKY, the stablecoin DAI is called USDS, and its interest-bearing variant sUSDS. A governance token confers a vote on the rules of the protocol, including the level of the savings rate; SKY is not intended as a means of payment.
The most important number does not appear on the chart. The supply of the in-house stablecoin USDS reached ten billion dollars at the end of September, and according to the protocol that supply was backed by $17.16bn of collateral. Such over-collateralisation is the rule in credit-based models, because the collateral itself fluctuates in value.
Out of this business come the rates that make SKY interesting. At the start of October the protocol advertised on its own front page a Sky Savings Rate of 3.60 per cent a year on sUSDS, alongside 6.56 per cent for staked SKY and 5.07 per cent for stUSDS. The money comes from the interest paid by borrowers and from investments of the reserves. Which platforms pay interest, and on what terms, is shown in our comparison of staking and interest platforms.
Supply mechanics are the second point. Of a total 23.46 billion SKY, 23.43 billion are in circulation; no large unlock wave that could dilute the price is pending. That large addresses use the business too was shown by the asset manager Galaxy Digital, which placed $100m in sUSDS in its own corporate treasury in September 2026.
 Compare staking and interest platforms
What argues for buying Sky at the current price
- The price sits above the long-term line and below the short-term one. At $0.0683 Sky stands 2.5 per cent above the 200-day average of $0.0667 and 6.4 per cent below the 50-day average of $0.0730. The twelve-month high of $0.0976 is 30.0 per cent away.
- There is a measurable business behind the token. Ten billion dollars of USDS and $17.16bn of collateral can be checked. A governance token with a claim on earnings is valued differently from one that carries nothing but a vote.
- Supply is almost entirely in circulation. With 23.43 of 23.46 billion SKY issued, the price has no unlock waves to absorb.
What argues against buying Sky at the current price
- The market is thin. Turnover of $12.14m against a market capitalisation of $1.60bn means execution prices that deviate in both directions. Anyone moving larger sums pays for it, and leveraged positions are especially exposed to liquidation here.
- The rate is not guaranteed. The 3.60 per cent on sUSDS and 6.56 per cent on staked SKY are set by a vote of token holders and follow the protocol's earnings. If lending rates fall, the rate can fall with them. The rates also refer to earnings inside the protocol, not to the price of SKY; the two can move in opposite directions.
- European regulation is unresolved. The securities regulator ESMA proposed at the end of September 2026 that licensed crypto services around stablecoins which do not meet the EU's MiCA regulation be prohibited. That is a recommendation to the European Commission and not binding law, and the proposal names no date for implementation. For a protocol whose earnings come from a stablecoin, it remains a valuation factor.
Buying Sky in Europe: costs, custody and licensed venues
Since 1 January 2026 only licensed firms may provide crypto-asset services across the European Union. A purchase therefore runs through a venue with a licence, and that venue's listing decides what is available at all. For a token ranked 52nd this is no formality: the smaller an asset, the more likely it is missing from the regulated houses.
Our reviews of Kraken and Bitpanda show how those venues are positioned on fees and product range; the fee models side by side are set out in our comparison of crypto exchanges. Three cost items count: the trading fee of between 0.1 and 1.5 per cent, the spread between the buying and selling price, which weighs more heavily in a thin market than the fee does, and the network fee on a withdrawal to your own address.
Custody offers two routes with different responsibilities. If the token stays with the provider, the key risk sits there, but a licensed firm inside the European Union remains reachable. If it moves to your own wallet, that risk sits entirely with you. Which devices are suited to this is covered in our hardware wallet comparison. Anyone still holding MKR pays on conversion: nominally one MKR converts into 24,000 SKY, and the conversion contract retains a deduction that rises by one percentage point each quarter.
On tax, treatment differs by country and, for an interest-bearing token, by the form the return takes. With sUSDS the return sits in the value of the token rather than in a payment, which complicates how it is classified. A tax adviser settles that question.
So is Sky a good buy at the current price?
In the short term the position is undecided, and the chart yields no signal. At $0.0683 the price stands between the 200-day average of $0.0667 and the 50-day average of $0.0730, with the RSI at 43.7 in neutral territory. Anyone buying on a horizon of weeks buys without a discount and without a confirmation. The recovery counts as confirmed only on a daily close above $0.0730; it counts as refuted on a second close below $0.0667.
In the long term the answer hangs not on the chart but on two questions: does the protocol's business keep growing, and will it be allowed to keep running in Europe? If the USDS supply grows beyond ten billion dollars, the token carries a distribution, and the twelve-month high of $0.0976 becomes a reachable mark again. If the stablecoin supply shrinks for good, if the savings rate falls well below the 3.60 per cent quoted, or if the ESMA proposal turns into a rule that forces licensed providers to withdraw, the basis of this assessment falls away. Those three conditions are the test on which the assumption of this article fails.
Sky is thus a bet on a lending business with an interest yield, not on a quick jump in price.
Buying Sky: What to take away
- Check availability and fees. The listing of a licensed venue comes first, the fee model second. The side-by-side view is in our comparison of crypto exchanges.
- Note the two levels. $0.0730 as the confirmation on the upside, $0.0667 as the break on the downside. How these zones fit into a longer expectation is set out in the price prediction for the protocol.
- Decide on custody beforehand. Leaving the token with the provider or withdrawing it to your own wallet belongs before the purchase, not after. The devices are compared in our hardware wallet comparison.
Disclosure: Some of the providers mentioned in this article work with us through partner programmes. This has no influence on the price analysis or the assessment of the chart position; the price data come from a public market data source and can be verified there.
(As of 26 October 2026. This article is not investment advice. Prices, fees and terms change; check them with the provider itself before any purchase. Crypto assets are subject to high price swings and a total loss is possible.)
Frequently asked questions about Sky
Partner links: some links on this page are partner links. If you become a customer through one of them, we may earn a commission at no extra cost to you. Selection, ratings and ranking are decided independently by our editorial team. Ethics and Independence · Ownership and Funding
Transparency note: This article was produced with the assistance of artificial intelligence and reviewed by our editorial team before publication. All figures and claims were checked against the primary sources linked in the text. The feature image was generated with AI.
For later? Save this article and find it again in your profile.
Related articles
- Is Jupiter a Good Buy at Current Prices?
- Cardano open interest climbs to $395 million while ADA falls
- Will Bitcoin Go Back Up? Three Scenarios to Year-End: $70,000, $80,000 or $100,000
- Is Aerodrome Finance a Good Buy at Current Prices?
- Solana Price Below $95: Record ETF Outflows and Whale Selling Push SOL to a 7-Month Low
Which topics should we dive deeper into?
Select what genuinely interests you. Your picks feed directly into our editorial planning.
Crypto news that's actually worth your time.
Weekly. 60 seconds. Carefully curated by our editors: no hype, no promo flood, no spam.

November 3, 2026 8:59 AM

Ethereum Price Below $2,300: Is $2,000 Next or Is This the Bottom?
Ethereum price slips toward $2,250 as $3 billion leaves DeFi. Whales are buying the dip. Does ETH hold $2,200 or test $2,000 next?

October 30, 2026 11:28 PM

Is Polygon a Good Buy at Current Prices?
Polygon sits roughly half below its twelve-month high and keeps running into both moving averages. What the chart structure, the RSI and the trading volume say about buying POL at the current price.
October 28, 2026 10:26 AM

Is JUST a Good Buy at Current Prices?
JST has gained more than 300 percent in a year and is now stalling a whisker below its twelve-month high. Here is the case for buying JUST at current prices, the case against it, and the condition that would disprove the friendly read.
October 28, 2026 6:40 AM
Is Morpho a Good Buy at Current Prices?
Morpho trades around a quarter below its twelve-month high while still holding above its long-term average. What argues for and against buying into the DeFi lending token at this level.
October 27, 2026 11:25 PM

Is Arbitrum a Good Buy at Current Prices?
Arbitrum sits well below its twelve-month high and above its long-term average. We check what argues for and against buying ARB at this level, and which condition would prove the recovery wrong.
October 27, 2026 7:27 AM

Is Venice Token a Good Buy at Current Prices?
Venice Token has multiplied within twelve months and has been correcting since its September high. We check the chart, the supply and the risks of VVV against the question of whether the token is a good buy at the current price.
October 21, 2026 12:33 AM

Is Worldcoin a Good Buy at Current Prices?
As of November 11, 2026: Worldcoin has fallen below both moving averages and the marks of the October analysis, while the twelve-month low holds. What chart, supply and World ID now mean for buying WLD.
October 12, 2026 10:27 AM
Is Bitcoin Still a Good Investment in October 2026?
Spot ETFs have changed who sets the Bitcoin price, and the easy repricing is behind us. What still supports BTC, what could break it, and how much belongs in a portfolio today.

October 4, 2026 10:42 AM

Sky (SKY) only 3.8 percent below its December 2024 record: the level that decides
Sky trades at $0.09669 and thus 3.8 percent below its record from December 2024, after a weekly gain of 25.8 percent. The USDS supply has reached $10 billion, the savings rate stands at 3.60 percent, and ESMA wants services around unauthorised stablecoins banned.
September 28, 2026 9:47 AM
XRP Price Drops Below $1.50: Where Is Ripple Heading This Week?
XRP price slips under $1.50 after a red weekend. Here is the XRP price analysis with the higher and lower targets that matter this week.
September 28, 2026 4:28 AM

Is Quant a Good Buy at the Current Price?
As of 13 November 2026: Quant has broken below its October low of 182 dollars and trades below its 50-day average, but well above its 200-day line. We check with our own price data what that means for buying at the current price.
September 20, 2026 9:21 AM

Is Ethena a Good Buy at Current Prices?
As of November 11, 2026: Ethena has fallen below both moving averages, while the zone around $0.13 to $0.14 holds. Is ENA a good buy at current prices? We examine chart, supply and the revenue question.
August 31, 2026 11:20 PM

Is Mantle a Good Buy at Current Prices?
As of November 11, 2026: Mantle has fallen below both moving averages, while the twelve-month low still holds. We check with our own price data what chart, supply and liquidity mean for buying now.
August 27, 2026 11:25 AM

Is Pump.fun a Good Buy at Current Prices?
As of 13 November 2026: PUMP has fallen below its 50-day average and sits just above its 200-day line. We check with our own price data what that and the supply overhang mean for buying Pump.fun at the current price.
August 27, 2026 6:38 AM

Is NEAR Protocol a Good Buy at Current Prices?
As of 14 November 2026: NEAR has broken out of its October range to the downside and closes below its 50-day average, but above the 200-day line. We check with our own price data what that means for buying now.
August 27, 2026 6:23 AM
Is Bittensor a Good Buy at Current Prices?
As of 14 November 2026: Bittensor has closed below its October low and both moving averages since late October, putting the trend reversal in question. We check with our own price data what that means for buying.
August 27, 2026 4:31 AM

Is AAVE a Good Buy at Current Prices?
As of November 11, 2026: AAVE has slipped below its 50-day and just below its 200-day average, while the August mark still holds. We check with our own price data what that means for buying at current prices.
August 27, 2026 3:39 AM

Is Cronos a Good Buy at Current Prices?
As of November 11, 2026: Cronos has fallen below both moving averages and trades just above its twelve-month low. We check with our own calculations what speaks for and against buying.
August 27, 2026 3:24 AM

Is Hedera a Good Buy at Current Prices?
As of 14 November 2026: by our yardstick Hedera's bottoming has failed, and it is closing at its lowest level in twelve months. We check with our own price data what that means for buying at the current price.
August 27, 2026 2:21 AM

Is SUI a Good Buy at Current Prices?
SUI is holding its 200-day moving average and trades 51 percent above its twelve-month low, with the 50-day line now above the 200-day. We check whether the coin is a good buy at current prices.
August 26, 2026 4:21 AM

Is Uniswap a Good Buy at Current Prices?
As of 14 November 2026: Uniswap has left its mid-October range to the downside and is sitting on its 200-day average. We check with our own price data what that means for buying at current prices.
August 24, 2026 12:50 AM

Is Bitcoin Cash a Good Buy at Current Prices?
Bitcoin Cash has held its summer gains but the rally has stalled: the price now sits right on its 50-day line with the RSI back to neutral and turnover halved. We work through what speaks for and against buying BCH at current prices.
August 24, 2026 12:34 AM

Is Monero a Good Buy at Current Prices?
As of 15 November 2026: Monero has fallen below its October low and just below the 200-day average, and the October breakout has not held. We check with our own price data what that means for buying at current prices.
August 24, 2026 12:19 AM

Is Zcash a Good Buy at Current Prices?
Zcash has given back part of its September advance and now sits just above its 50-day average. We look at what the trend, the RSI and the turnover actually support, and under which conditions the case for buying ZEC breaks down.
August 23, 2026 2:21 PM

Is Hyperliquid a Good Buy at Current Prices?
HYPE slipped below its 50-day average in October, triggering the test we set in September. What buybacks, team sales and leverage mean now: is Hyperliquid a good buy at current prices?


More from CryptoTicker