
Is NEAR Protocol a Good Buy at Current Prices?
As of 14 November 2026: NEAR has broken out of its October range to the downside and closes below its 50-day average, but above the 200-day line. We check with our own price data what that means for buying now.


Which topics should we dive deeper into?
Select what genuinely interests you. Your picks feed directly into our editorial planning.
Crypto news that's actually worth your time.
Weekly. 60 seconds. Carefully curated by our editors: no hype, no promo flood, no spam.
As of 14 November 2026: NEAR Protocol with updated figures
NEAR Protocol closed at $3.4462 on 13 November 2026, 35.5 percent below the $5.34 on which the analysis below, dated 22 October 2026, is based. The figures in this section are daily closing prices from CoinGecko; cryptoticker.io calculated the moving averages and the RSI from them.
| Metric | 13 November 2026 |
|---|---|
| Closing price | $3.4462 |
| 50-day average | $4.0612 |
| 200-day average | $2.9803 |
| RSI (14 days) | 36.0 |
| Change over 30 days | −29.4% |
| Change over 90 days | +113.0% |
| Twelve-month high | $5.8876 (11 October 2026) |
| Twelve-month low | $0.9635 (11 February 2026) |
| Daily trading volume (30-day average) | $658 million |
That puts NEAR 15.1 percent below its 50-day average, but 15.6 percent above its 200-day average. The 14-day relative strength index stands at 36.0, in neutral territory between 30 and 70. Trading volume averaged around $658 million a day over the past 30 days, below the 90-day average of around $727 million.
The first mark from the analysis of 22 October has broken. NEAR first closed below $4.33, the low of 8 October, on 29 October, and has stayed below it for 13 consecutive days since 1 November. The October range has therefore been left to the downside, and the 50-day average of $4.19 at the time did not hold either. The opposite mark of $5.87 never came within reach: the highest close since the analysis was $4.8783 on 22 October, the lowest $3.4191 on 12 November. By our August yardstick the uptrend remains intact, because the 50-day average is still above the 200-day average and the price is above the 200-day line. The entry case from October, buying at the top of the range, has been invalidated.
The sections below reflect the situation as of 22 October 2026.
NEAR Protocol changes hands at $5.34 in the night to Thursday, 22 October 2026, up 7.8 per cent in 24 hours. When we first assessed the token on 26 August it cost $1.89; since then it has gained 182.4 per cent. On 18 September NEAR closed above the twelve-month high of $3.18 that had capped it since September 2025, on 11 October it set its highest daily close of the past twelve months at $5.87, and on 12 October it touched $5.96 intraday. The sell-off of 8 October briefly pushed it down to $4.33. Today NEAR trades 9.1 per cent below its highest close, and a market capitalisation of $6.99bn puts it 16th in the overall market, up from 35th in August. The question is the same, the starting point is a different one: is NEAR a good buy at current prices?
cryptoticker.io collected the price data behind this update itself late on 21 October 2026. The source is market data from CoinMarketCap; the method is daily closing prices across the past twelve months with the running price as the last data point, from which the exponential moving averages, the 14-day relative strength index and the twelve-month extremes were calculated with standard formulas. Intraday highs and lows come from CoinMarketCap's daily candles. The table sets the figures from our first analysis of 26 August alongside.
| Metric | 26 August 2026 | 22 October 2026 |
|---|---|---|
| Price | $1.89 | $5.34 |
| 50-day average | $1.79 | $4.19 |
| 200-day average | $1.81 | $2.72 |
| Distance to the 200-day line | +4.4% | +96.5% |
| Relative Strength Index (14 days) | 62.4 | 57.5 |
| Trading volume, 24 hours | $262.8m | $1,425.0m |
| Market capitalisation | $2.46bn | $6.99bn |
NEAR price analysis: current price, support and the 200-day mark
At $5.34, NEAR sits 27.5 per cent above its 50-day exponential moving average of $4.19 and 96.5 per cent above its 200-day average of $2.72. In August the token hovered on top of its own trend lines, a few cents above both; today it runs far clear of them. The 50-day average has more than doubled since then, the 200-day average has risen by half, and the faster line now sits 54 per cent above the slower one.
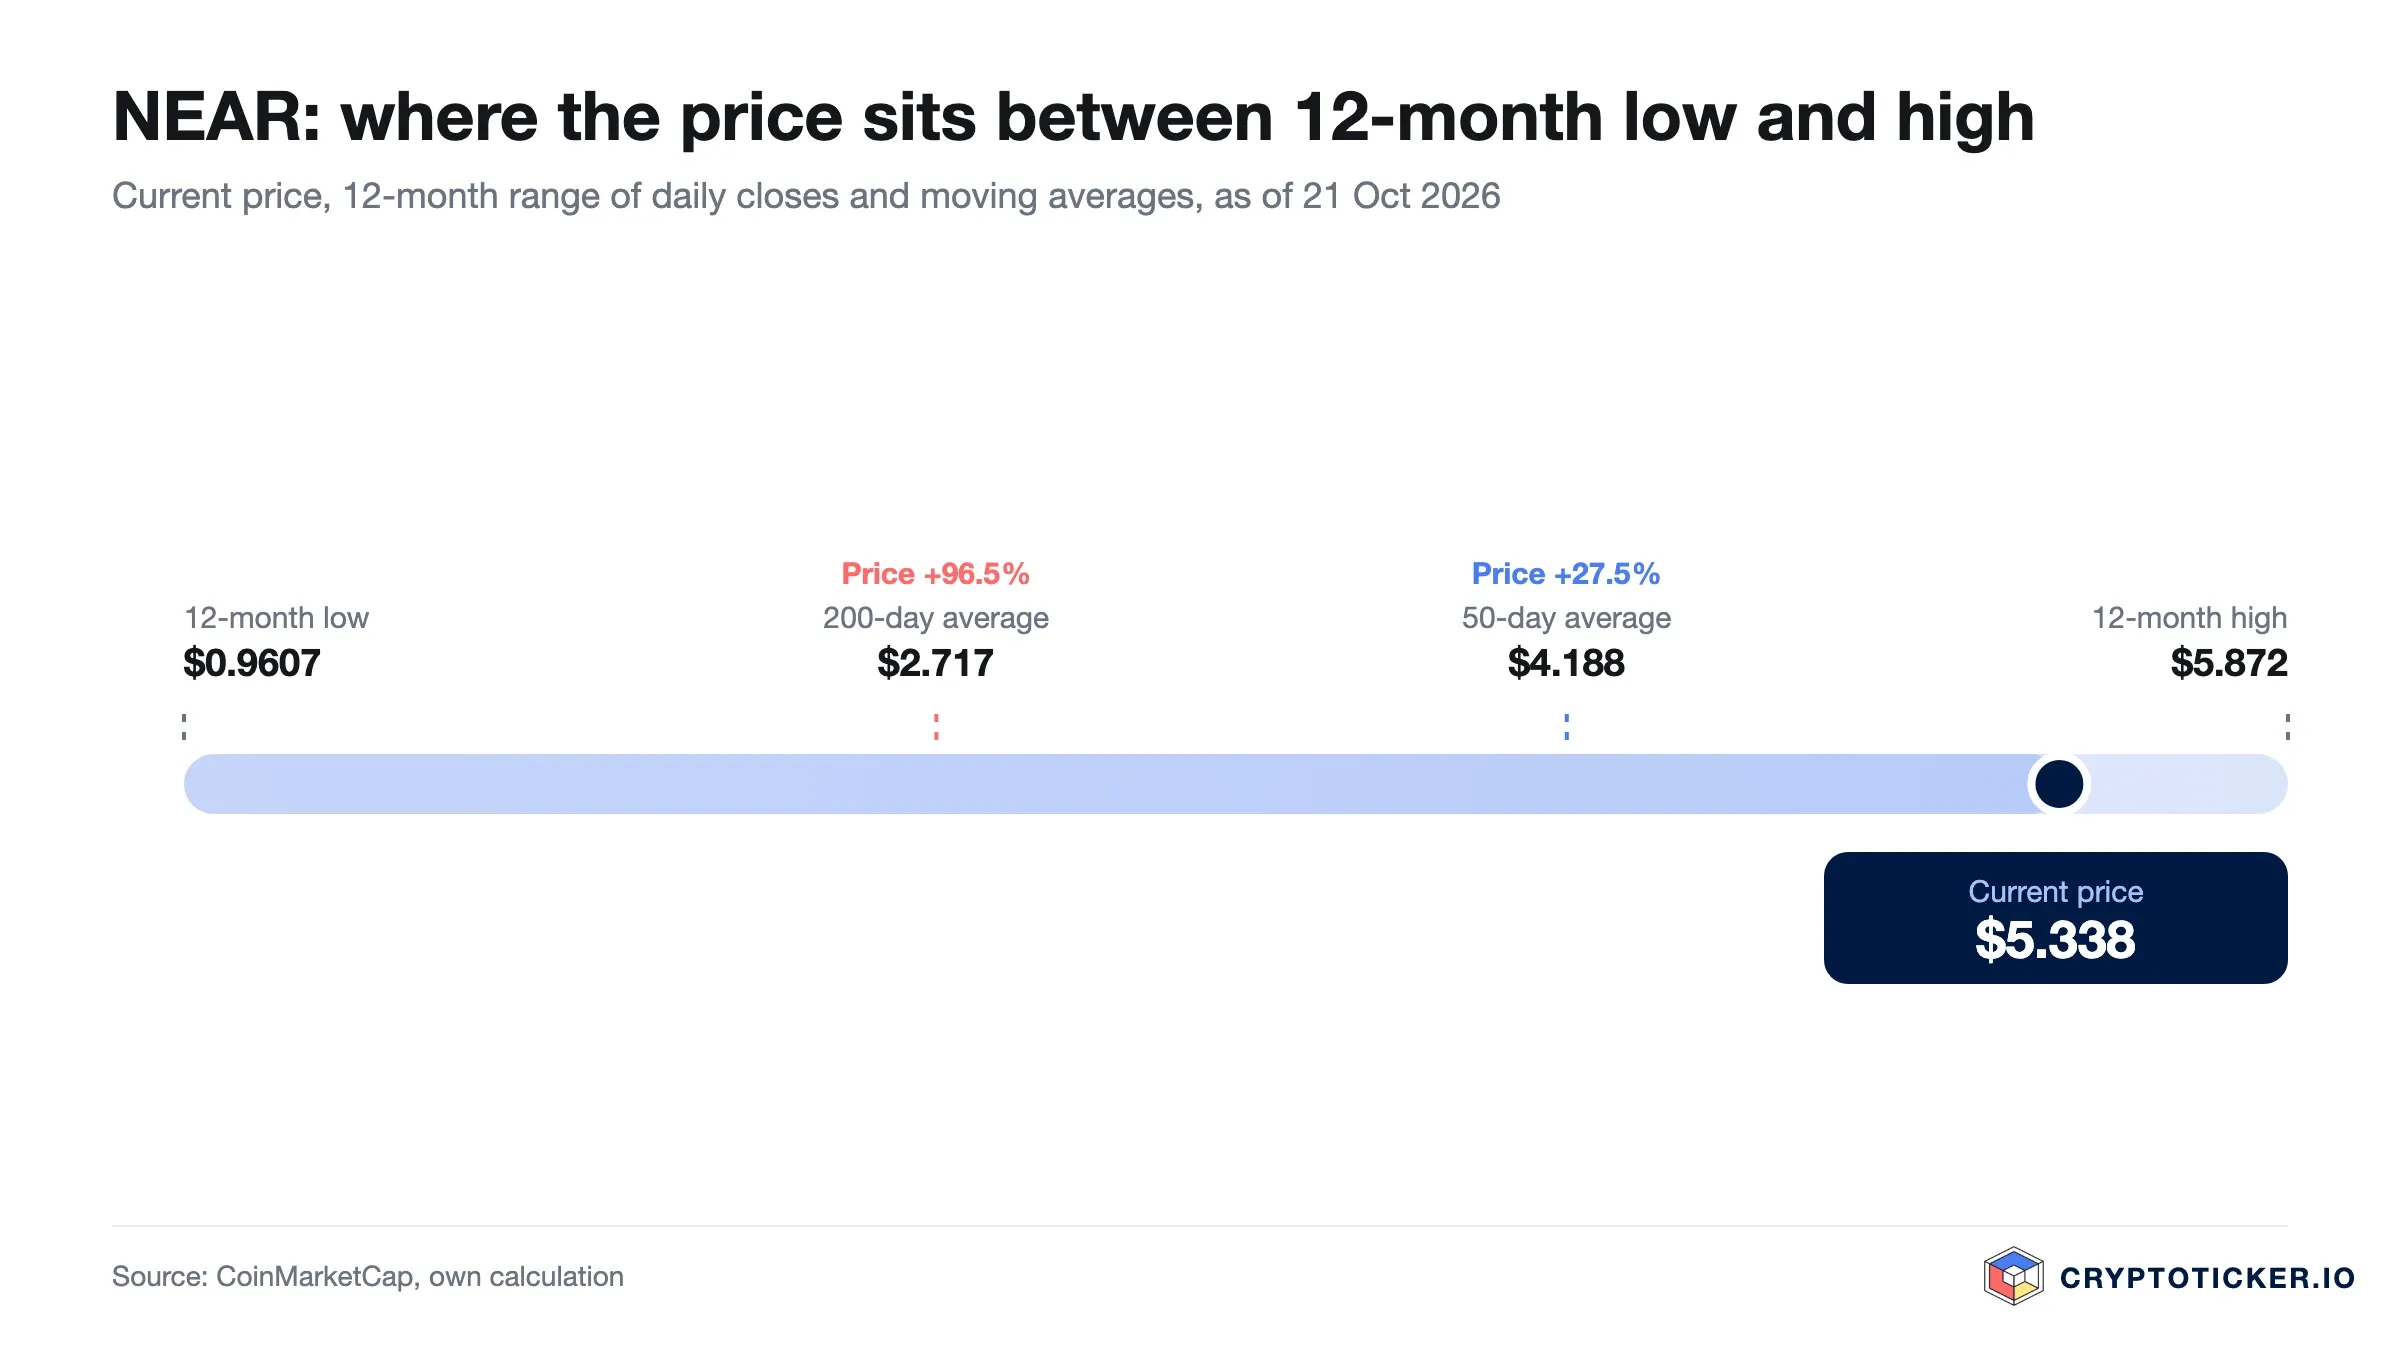
That geometry sets out the levels to watch. Above, the highest close of $5.87 from 11 October and the intraday high of $5.96 from 12 October, where the rally turned back. Since 13 October NEAR has closed between $4.85 and $5.26; the running price sits 1.5 per cent above the top of that range, and only a daily close above it would confirm the break. Below, the bottom of the range at $4.85 comes first, then the October low at $4.33 and the 50-day average at $4.19. Much further down lie the old twelve-month high of $3.18, which turned from ceiling into breakout level in September, and the 200-day average at $2.72.
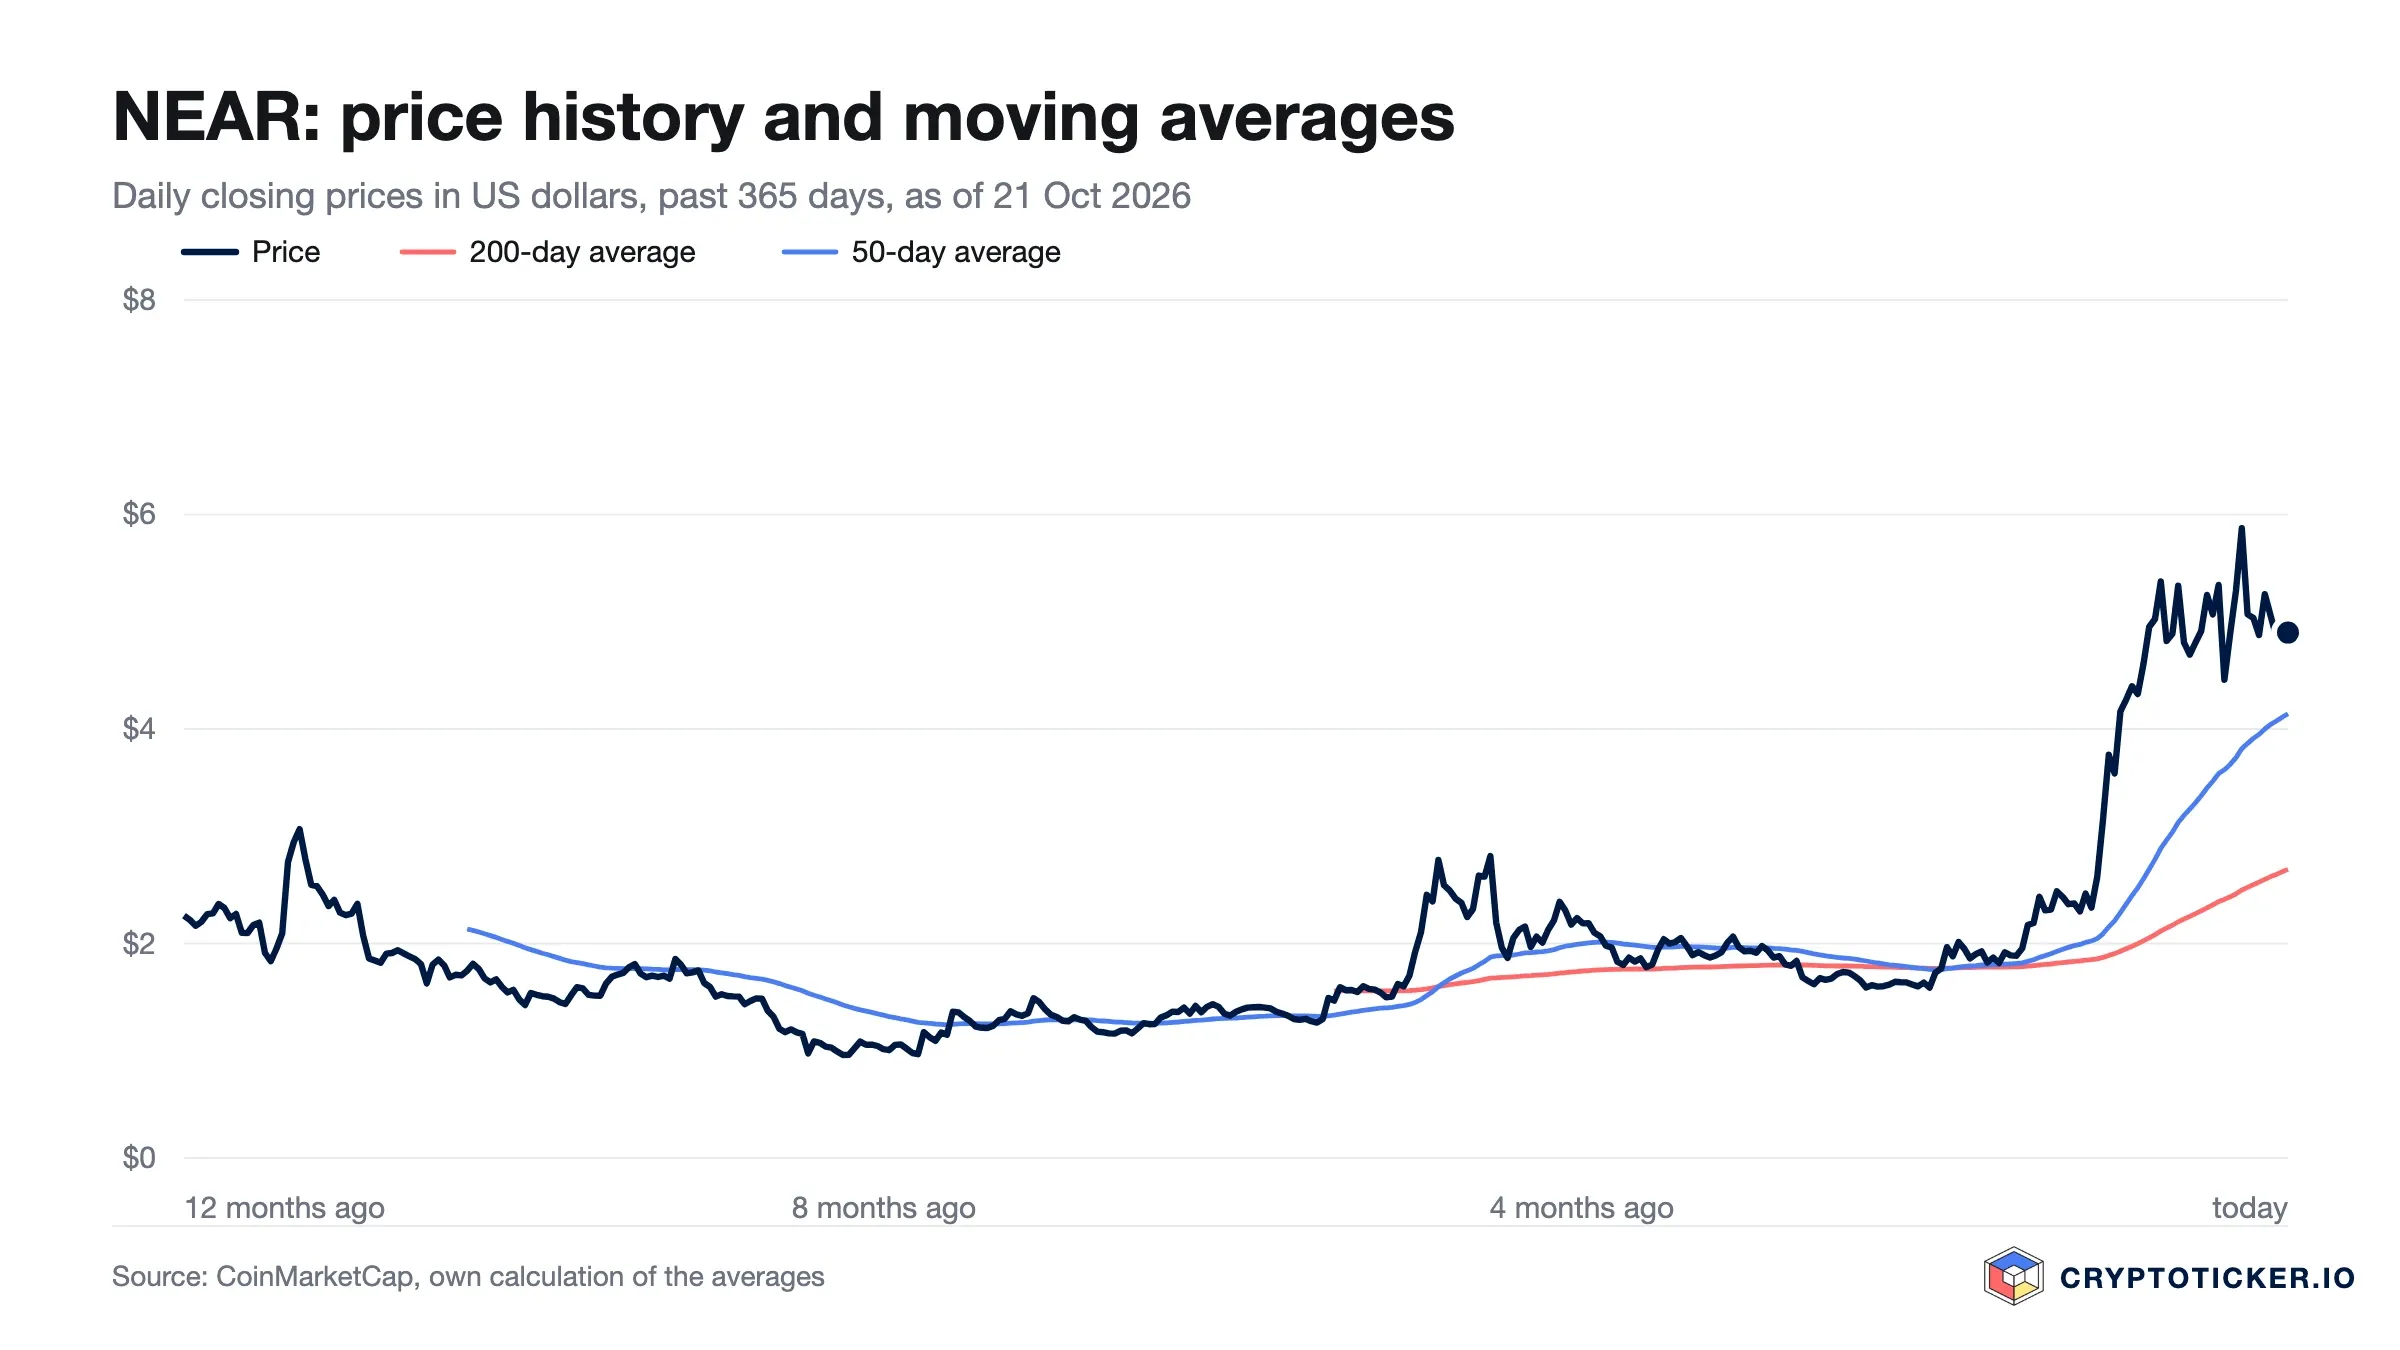
The 24-hour move shows how quickly that footing shifts: NEAR gained 7.8 per cent in a day and 10.7 per cent over seven days, after single-day losses of 16.6 and 13.6 per cent earlier in the month.
Is the NEAR downtrend broken or only interrupted?
In August we set out what would settle the question. A downtrend is generally considered broken once the price sets a higher high and then holds a higher low, and the $3.18 high from September 2025 was the mark to beat. The case would be strengthened, we wrote, by the 50-day average crossing above the 200-day average on rising volume, followed by a move through the $2.20 to $2.40 band that had capped every rally that year. It would be refuted by a weekly close back below $1.79.
The refutation never came: the lowest weekly close after 26 August was $1.82 on 30 August. Everything on the confirming side did. Using the same method as in August, the 50-day average crossed above the 200-day average with the close of 4 September, at $1.83 against $1.82, on a day when $526m changed hands, more than double the turnover of late August. On 6 September NEAR closed at $2.43, above the band, and it has not closed below $2.40 since 16 September. On 18 September a close of $3.76 cleared the $3.18 high. By our own yardstick the downtrend is broken.
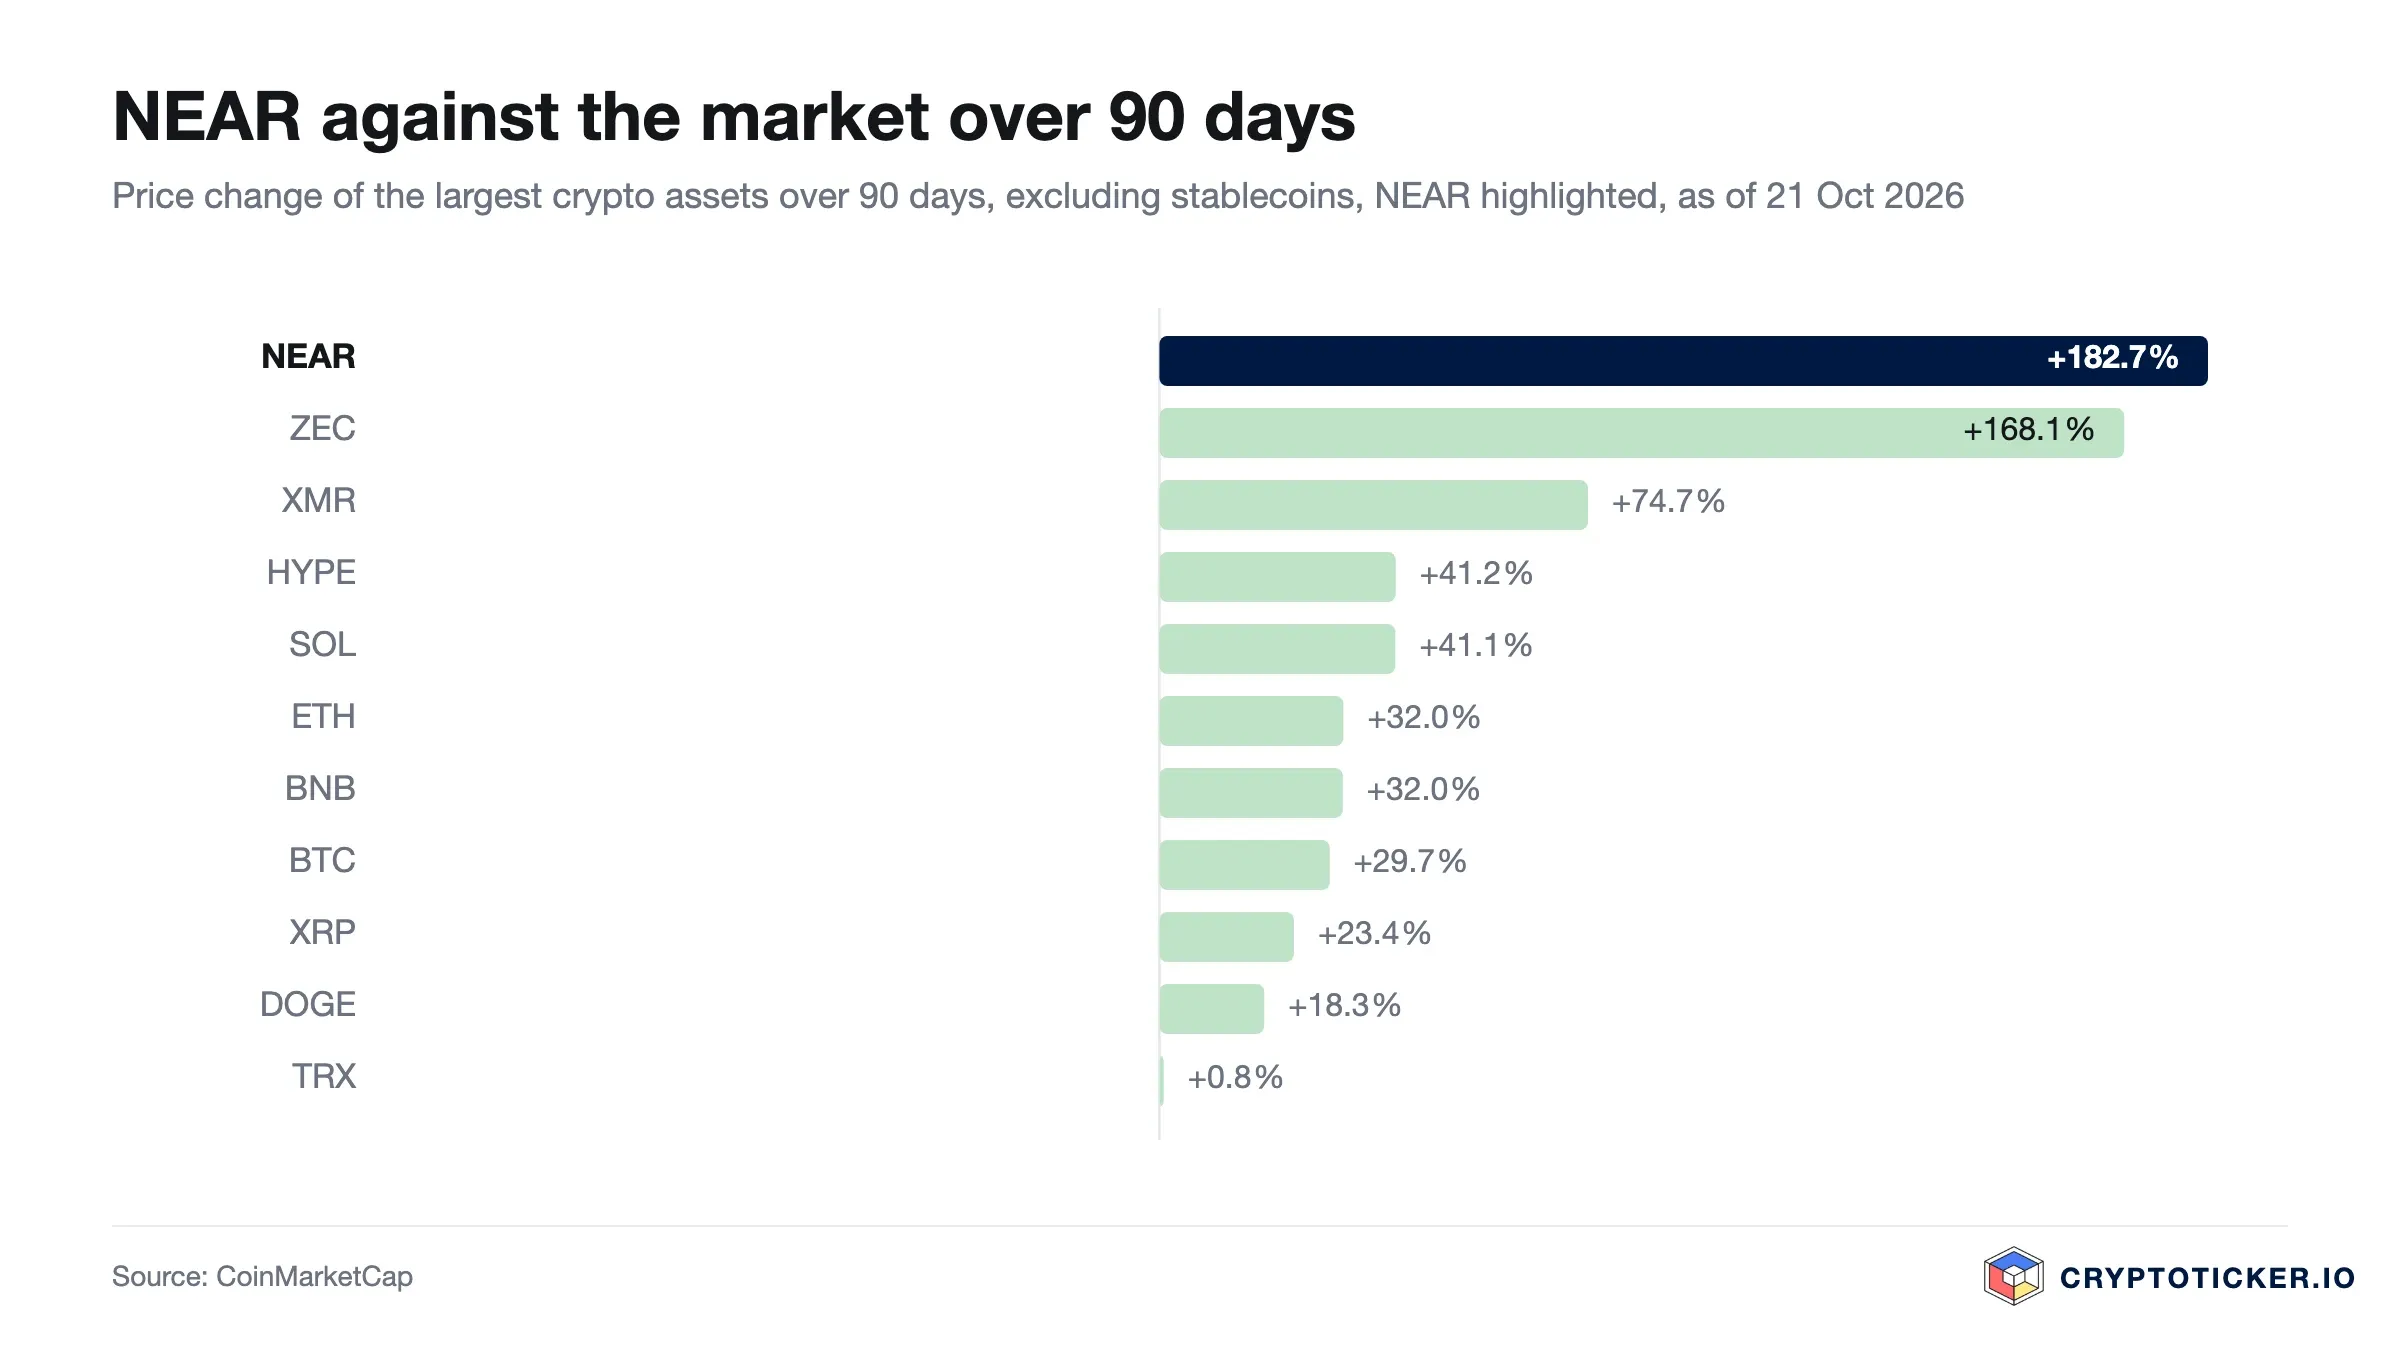
Three documented triggers carried the move: confidential perpetual futures and an incentive programme on near.com, tokenised US equities and ETFs from Ondo Finance on NEAR from 22 September, and a US spot fund on NEAR listed on NYSE Arca from 29 September. Over 90 days the token is up 182.7 per cent, over twelve months up 136.2 per cent from $2.26.
Since late September the steep advance has turned into a wide range. On 8 October, the day of the market-wide sell-off with $1.16bn in forced liquidations, NEAR dropped to $4.33 intraday and closed 16.6 per cent lower; on 12 October it fell 13.6 per cent after turning back at $5.96. When many altcoins hit their lows on 18 October, NEAR held at $4.64, well above the October low. The question has therefore moved on: whether the young uptrend resolves the range between $4.33 and $5.96 to the upside.
What RSI and moving averages mean for a NEAR entry
The 14-day relative strength index reads 57.5, slightly below the 62.4 of 26 August. Between those two readings lies a full swing: on 27 September the index reached 87.4, deep in the overbought zone that conventionally begins at 70, and since 12 October it has moved between 52 and 58. The overheating of September has been worked off without the price having to drop below the $4.85 area.
The relationship between the two averages has turned from the open question of August into the clearest signal on the chart. The golden cross we were waiting for happened on 4 September, and the 50-day average at $4.19 now stands 54 per cent above the 200-day average at $2.72. It is also rising fast: from $3.82 on 11 October to $4.14 on 19 October, a little over four cents a day. If the price holds its level, the gap narrows week by week without the price having to fall.
Read together, the indicators describe a market that has completed its transition and is now consolidating. What has changed is the distance to the level at which the thesis would be wrong. In August the support cluster was a few cents below the entry; today the October low at $4.33 is 18.8 per cent below and the 50-day average 21.5 per cent below.
Wider sentiment has cooled. The CoinMarketCap Fear and Greed reading stood at 81 on 26 August, in the extreme greed band; late on 21 October it shows 54, a neutral market, after a 60-day low of 48 on 17 October. Our caution in August that elevated readings tend to coincide with local tops did not hold for NEAR: the token nearly tripled over the following eight weeks because its own triggers outweighed the mood of the whole market.
What trading volume reveals about demand for NEAR
NEAR turned over $1.42bn in 24 hours against a market capitalisation of $6.99bn, a ratio of 20.4 per cent, up from 10.7 per cent in August. The seven-day average to 20 October stands at $1.11bn, the 30-day average at $1.38bn, and the busiest day so far was 23 September with $3.08bn. Liquidity was not the weak point in August, and it is not today.
In August we wrote that the confirmation would be volume holding up on advancing days and falling away on retreating ones, sustained across several weeks. That is what the data shows for September: turnover above $1bn on 13 of the 14 days from 17 to 30 September, with the three busiest days all falling in the steepest week. October is more mixed. The seven-day average sits 19.2 per cent below the 30-day average, while the last 24 hours, on a rising day, came in 28.2 per cent above the weekly average.
The composition of that volume still deserves caution. According to CoinGlass data, open interest in NEAR futures hit a record of about $1.92bn on 12 October, against $300m to $450m in July and August, and dropped 16.5 per cent to about $1.54bn the next day as the price turned back at $6. A growing share of the turnover is leveraged traders cycling in and out of positions.
Which structural factors speak for NEAR Protocol
NEAR ranks 16th by market capitalisation at $6.99bn, up from 35th at $2.46bn in August. That lifts it out of the mid-cap band it occupied in August, while it remains far more volatile than the majors.
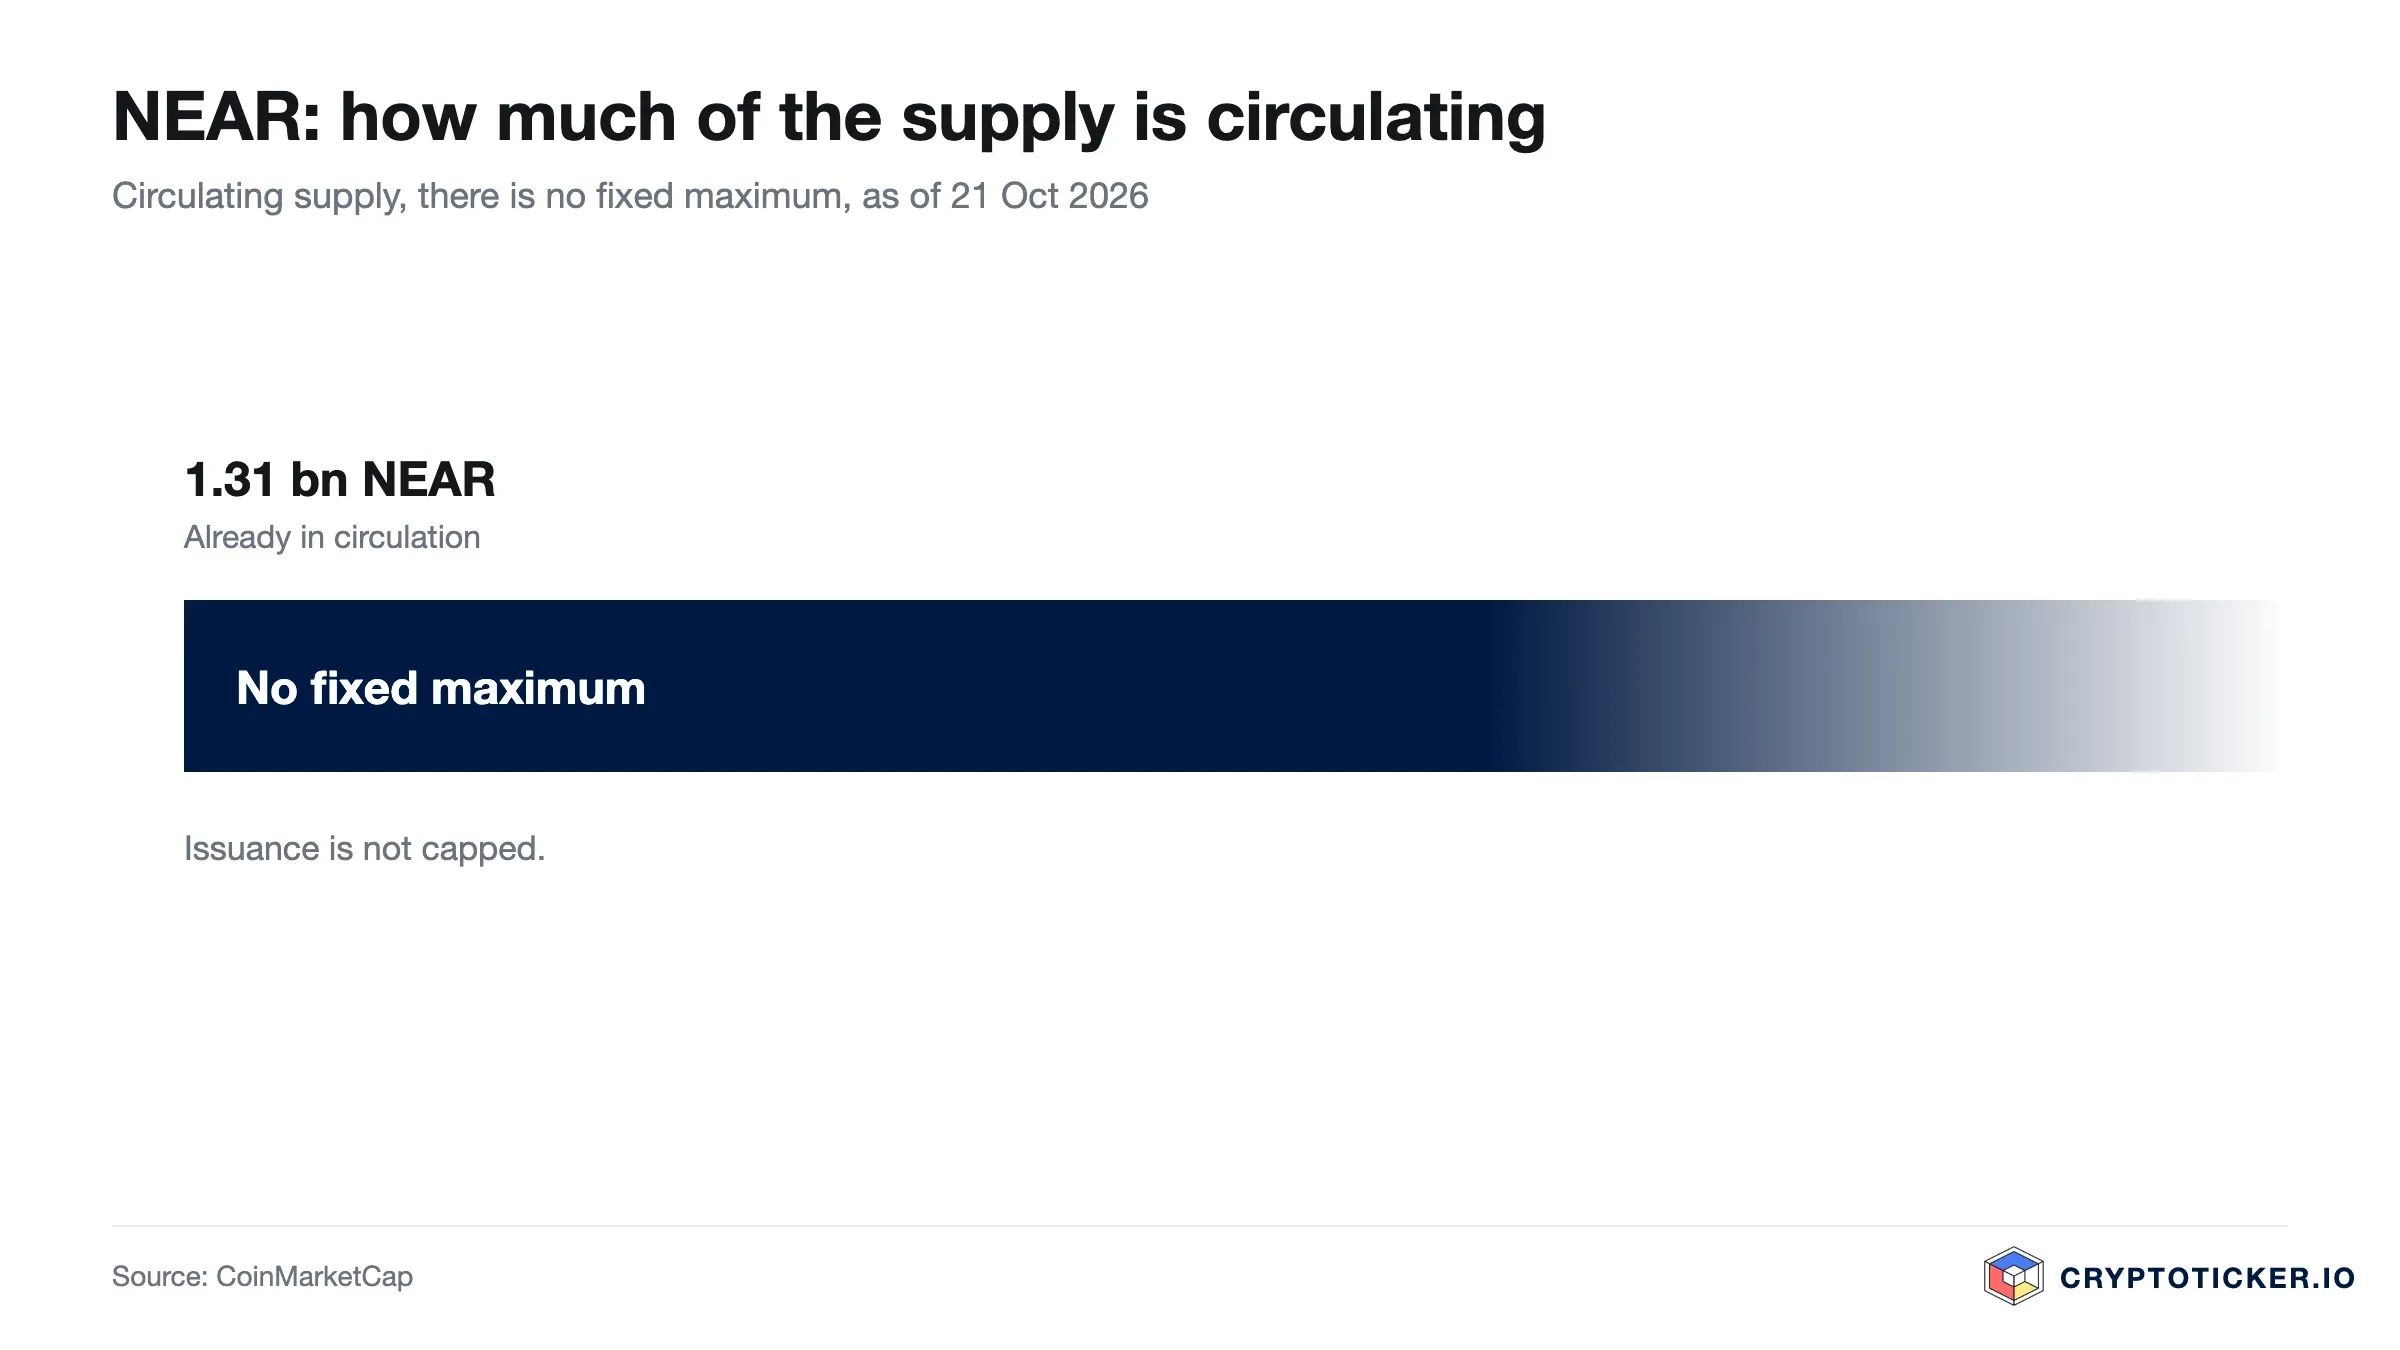
The supply mechanics still cut both ways. Circulating supply stands at about 1.31bn NEAR, equal to the total supply, and there is no maximum. According to the project's own documentation, the network issues new tokens to pay validators and burns a portion of transaction fees, so net issuance depends on how heavily the chain is used. The protocol allows up to 2.5 per cent new tokens a year, up to 32.7m NEAR at today's supply; a proposal to cut that to 1.6 per cent has not been implemented, as our piece on the emission rate and staking yield explains. New since August is a buyer that absorbs supply: according to CryptoBriefing, the Bitwise NEAR ETF held about 15.78m NEAR on 12 October, 1.2 per cent of circulating supply and almost half of the maximum annual issuance.
On the usage side, the open question of August now has first answers. NEAR Intents, the network's cross-chain swap layer, handled about $10.4bn in the third quarter according to Nansen. Since 22 September, 20 tokenised US stocks, ETFs and commodity products from Ondo Finance, among them Nvidia, Tesla and Apple, have been tradable through near.com. In October the Nasdaq-listed SVRN acquired FastNEAR, the operator of the RPC servers through which most NEAR wallets talk to the chain.
Regulation is the third structural input. In the US, the SEC declared the registration of the Bitwise fund effective on 24 September and it has traded under the ticker NRR since 29 September; our guide to the NRR listing and the buying route from Europe covers what that means for European investors. In the EU, the MiCA framework, supervised in part by ESMA, sets licensing requirements for the platforms through which most retail investors reach a token like NEAR. Both shape where and how you can buy far more than they affect the protocol itself.
 Find a crypto exchange with an EU licence
What speaks for buying NEAR at current prices
Three arguments carry weight at $5.34. First, the trend change is confirmed by the yardstick we set in August. The 50-day average crossed above the 200-day average on 4 September, the price broke through the $2.20 to $2.40 band on 6 September and has traded above the old $3.18 high since 18 September. The 50-day average at $4.19 now sits 54 per cent above the 200-day average at $2.72.
Second, new buyers and new usage stand behind the price. A regulated US fund held 15.78m NEAR on 12 October, NEAR Intents processed $10.4bn in the third quarter, and tokenised US equities have been tradable through near.com since 22 September. These are checkable developments rather than sentiment.
Third, the overheating has been worked off without breaking the trend. The RSI has fallen from 87.4 on 27 September to 57.5, and the sell-off of 8 October ended at $4.33, well above the 50-day average of $3.62 at the time. Over 90 days NEAR leads the large crypto assets with a gain of 182.7 per cent, ahead of Zcash at 168.1 per cent and far ahead of Bitcoin at 29.7 per cent.
What speaks against buying NEAR at current prices
Three arguments cut the other way, and they are not weaker than the ones above. First, the drop potential is large. The price stands 96.5 per cent above the 200-day average and 27.5 per cent above the 50-day average, and October showed how quickly such gaps can shrink: minus 16.6 per cent on 8 October, minus 13.6 per cent on 12 October, and daily ranges between 5.1 and 19.4 per cent in the week to 20 October. The October low is 18.8 per cent away, the 50-day average 21.5 per cent.
Second, much of the trading is leveraged. Record open interest of about $1.92bn on 12 October equalled roughly 27 per cent of today's market capitalisation. Leveraged buyers amplify rallies, and they amplify every pullback, because forced liquidations trigger further selling.
Third, supply keeps growing and the macro backdrop stays tight. Issuance of up to 2.5 per cent a year remains in place, so holders who do not stake are diluted. Sentiment is no longer overheated, with Fear and Greed at 54 instead of 81, but the Federal Reserve raised rates in September, the minutes of 7 October point to a further increase, and US consumer prices rose 3.7 per cent in September. The meeting on 27 and 28 October is the first date on which that can show up in the price.
How to buy NEAR at current prices
NEAR is listed on most large regulated venues, so availability is rarely the constraint. Cost usually is. Spot fees at established exchanges typically run between about 0.1 and 0.5 per cent per order, while the spread and any conversion charge on a euro deposit can quietly exceed the headline fee. Our exchange comparison sets the venues side by side, and the overview of regulated exchanges narrows the field to platforms licensed in the EU. With daily ranges of 5 to 19 per cent, as in the week to 20 October, a market order fills at the next available price, which can differ noticeably from the quote; a limit order fixes the most you are willing to pay.
Individual reviews go deeper on details that surface only after you open an account. Our reports on Kraken, Bitpanda and Bitvavo cover fee schedules, deposit routes and withdrawal handling. Check the current terms with the provider before you buy, since fees and conditions change.
Custody is a second decision, separate from the purchase. Leaving NEAR on an exchange is convenient and exposes you to that platform's solvency and security; moving it to your own wallet hands you responsibility for the recovery phrase instead. Our hardware wallet comparison covers the trade-off. If you already hold NEAR yourself, note one date: the MyNearWallet browser wallet shuts down on 31 October 2026. Balances stay on the chain, only access through that interface ends; our guide to the MyNearWallet shutdown walks through the move.
Is NEAR a good buy at current prices, then?
Update of 14 November 2026: this assessment reflects the situation as of 22 October 2026. The first mark at which the assumption was to fail has been hit: NEAR has closed below $4.33 since 1 November, most recently at $3.4462, and therefore also below its 50-day average of $4.0612. The current assessment is in the section “As of 14 November 2026” at the top of the article.
The short-term and the long-term readings point in different directions, and collapsing them into one verdict would hide the useful part.
Over a horizon of weeks, a buyer at $5.34 steps into a confirmed uptrend that has moved sideways for three weeks. The overbought reading of September is gone, the RSI stands at 57.5, and the price is testing the top of the range it has held since 13 October. The highest close of $5.87 is 10.0 per cent above, the October low of $4.33 is 18.8 per cent below. A short-term entry is a bet on that range resolving to the upside, and the Federal Reserve meeting on 27 and 28 October is the next test.
Over a horizon of years, the question is still not about the chart. It is whether usage attracts enough demand to outpace an issuance schedule with no fixed cap. Unlike in August, that can now be tracked in figures: NEAR Intents volume, trading in tokenised equities on near.com and the holdings of the US fund, set against issuance of up to 2.5 per cent a year.
The case set out here would be refuted by one of three observations. First, a daily close below $4.33, the low of 8 October, which would break the October range to the downside and make the 50-day average at $4.19 the next test. Second, the Bitwise NEAR ETF's holdings falling below the 15.78m NEAR of 12 October, which would turn the new source of demand into a seller. Third, in the other direction, a daily close above $5.87 on sustained volume would set a new twelve-month high and mark the sideways phase since 11 October as a pause within the uptrend. All three are checkable in public data. None of this is investment advice, and a twelve-month range from $0.96 to $5.87 is a reminder of how wide the outcomes have been.
Buying NEAR: what to take away
- NEAR at $5.34 has done what we named as confirmation in August: the golden cross on 4 September and the break through $2.40 two days later. The NEAR price prediction puts that position in a longer context.
- The cushion below has widened: 18.8 per cent to the October low of $4.33 instead of a few cents to the average cluster in August. Entry costs and venue matter at these swings, which our exchange comparison lays out.
- An RSI of 57.5 and daily ranges of up to 19 per cent argue for staging an entry with limit orders rather than committing at once, and for settling custody first via our hardware wallet comparison.
Disclosure: Some of the providers mentioned in this article work with us through partner programmes. This has no influence on the price analysis or on the assessment of the chart situation; the price data comes from a public market data source and can be verified there.
(As of 14 November 2026; analysis as of 22 October 2026. This article is not investment advice. Prices, fees and conditions change; check them with the provider yourself before every purchase. Crypto assets are subject to high price volatility, and a total loss is possible.)
Partner links: some links on this page are partner links. If you become a customer through one of them, we may earn a commission at no extra cost to you. Selection, ratings and ranking are decided independently by our editorial team. Ethics and Independence · Ownership and Funding
Transparency note: This article was produced with the assistance of artificial intelligence and reviewed by our editorial team before publication. All figures and claims were checked against the primary sources linked in the text. The feature image was generated with AI.
For later? Save this article and find it again in your profile.
Related articles
Which topics should we dive deeper into?
Select what genuinely interests you. Your picks feed directly into our editorial planning.
Crypto news that's actually worth your time.
Weekly. 60 seconds. Carefully curated by our editors: no hype, no promo flood, no spam.

November 5, 2026 9:22 PM

NEAR Protocol Slips to $3.70, but the TVL Drop Is Mostly a Price Effect
Analysis: NEAR Protocol loses 7.6 percent and posts its lowest close since September 20, while TVL falls to $173.6 million. Measured in tokens, however, locked capital has held steady at around 47 million NEAR since mid-October.

November 3, 2026 9:29 AM

Solana Price Below $95: Record ETF Outflows and Whale Selling Push SOL to a 7-Month Low
Solana price drops under $95 after a record $71 million ETF outflow and whale dumping. SOL is 19% down in a month. Is $78 the next stop?
November 3, 2026 8:59 AM

Ethereum Price Below $2,300: Is $2,000 Next or Is This the Bottom?
Ethereum price slips toward $2,250 as $3 billion leaves DeFi. Whales are buying the dip. Does ETH hold $2,200 or test $2,000 next?

November 2, 2026 7:21 PM

NEAR Protocol slides below $4.30 as long liquidations drive the sell-off
NEAR Protocol loses a good 7 percent on Monday to around $4.02 and breaks the $4.30 mark, taking the decline since October 12 to around 32 percent. In the futures market it was mainly long positions that were liquidated; the levels, the facts on tax and leverage, and what matters when buying.

October 28, 2026 6:40 AM

Is Morpho a Good Buy at Current Prices?
Morpho trades around a quarter below its twelve-month high while still holding above its long-term average. What argues for and against buying into the DeFi lending token at this level.
October 27, 2026 11:25 PM

Is Arbitrum a Good Buy at Current Prices?
Arbitrum sits well below its twelve-month high and above its long-term average. We check what argues for and against buying ARB at this level, and which condition would prove the recovery wrong.
October 27, 2026 7:27 AM

Is Venice Token a Good Buy at Current Prices?
Venice Token has multiplied within twelve months and has been correcting since its September high. We check the chart, the supply and the risks of VVV against the question of whether the token is a good buy at the current price.
October 26, 2026 11:22 PM

Is Sky a Good Buy at Current Prices?
Sky is the renamed MakerDAO, and its governance token is tied to the earnings of a lending protocol with its own stablecoin. Is SKY a good buy at current prices? We weigh the chart position, the savings rate, supply mechanics and the open question of European regulation.
October 22, 2026 4:18 AM

NEAR climbs 6.0 percent to $5.28: more than twice as strong as Bitcoin
NEAR Protocol has added about 6 percent in 24 hours to $5.28, outpacing Bitcoin by two to three times. Behind the move, a US spot fund has taken in money for a third day running.
October 21, 2026 12:33 AM

Is Worldcoin a Good Buy at Current Prices?
As of November 11, 2026: Worldcoin has fallen below both moving averages and the marks of the October analysis, while the twelve-month low holds. What chart, supply and World ID now mean for buying WLD.
October 13, 2026 7:49 PM

NEAR drops below five dollars and comes back: down 11.7 percent after the Nasdaq purchase
Nasdaq-listed SVRN has bought FastNEAR, the operator of the servers through which NEAR wallets talk to the blockchain. NEAR stands at around $5.09 at midday on October 13, 11.7 percent below the previous day, and at its intraday low of $4.90 sat under the five-dollar mark.
October 10, 2026 10:44 AM

Top 3 Coins to Watch Next Week: These Altcoins Could Explode
Twelve of the top 17 coins closed the week in the red. These three didn't. Here are the altcoins to watch next week and the catalysts behind them.
October 10, 2026 7:26 AM

NEAR Price at $4.93 After the 16 Percent Day: Is It Still Worth Getting In?
NEAR Protocol gains 8.6 percent to $4.93, a day after a 16.37 percent slump. Over 30 days the price is up 97.5 percent, over 14 days down 0.9 percent: our count shows what that means for an entry today.
October 9, 2026 1:06 PM

Ethereum Price Under $2,500: Is ETH a Good Buy Right Now?
Ethereum has slipped below $2,500 and the question in every chat group is the same: buy the dip, or stay out? Here is what is driving the price, what the near-term levels are, and what the long-term forecasts actually assume.
September 28, 2026 9:47 AM
XRP Price Drops Below $1.50: Where Is Ripple Heading This Week?
XRP price slips under $1.50 after a red weekend. Here is the XRP price analysis with the higher and lower targets that matter this week.
September 28, 2026 4:28 AM

Is Quant a Good Buy at the Current Price?
As of 13 November 2026: Quant has broken below its October low of 182 dollars and trades below its 50-day average, but well above its 200-day line. We check with our own price data what that means for buying at the current price.
September 21, 2026 7:20 PM

Morpho Stands Out: 33 Percent Below Its High
Morpho gains about 12 percent. A different number is more striking: the token sits only 33 percent below its all-time high, while the day's other winners stand 80 to 90 percent below theirs. What lies behind it.
September 20, 2026 9:21 AM

Is Ethena a Good Buy at Current Prices?
As of November 11, 2026: Ethena has fallen below both moving averages, while the zone around $0.13 to $0.14 holds. Is ENA a good buy at current prices? We examine chart, supply and the revenue question.
August 27, 2026 11:25 AM

Is Pump.fun a Good Buy at Current Prices?
As of 13 November 2026: PUMP has fallen below its 50-day average and sits just above its 200-day line. We check with our own price data what that and the supply overhang mean for buying Pump.fun at the current price.
August 27, 2026 6:23 AM

Is Bittensor a Good Buy at Current Prices?
As of 14 November 2026: Bittensor has closed below its October low and both moving averages since late October, putting the trend reversal in question. We check with our own price data what that means for buying.
August 27, 2026 4:31 AM

Is AAVE a Good Buy at Current Prices?
As of November 11, 2026: AAVE has slipped below its 50-day and just below its 200-day average, while the August mark still holds. We check with our own price data what that means for buying at current prices.
August 27, 2026 3:39 AM

Is Cronos a Good Buy at Current Prices?
As of November 11, 2026: Cronos has fallen below both moving averages and trades just above its twelve-month low. We check with our own calculations what speaks for and against buying.
August 27, 2026 3:24 AM

Is Hedera a Good Buy at Current Prices?
As of 14 November 2026: by our yardstick Hedera's bottoming has failed, and it is closing at its lowest level in twelve months. We check with our own price data what that means for buying at the current price.
August 27, 2026 2:21 AM

Is SUI a Good Buy at Current Prices?
SUI is holding its 200-day moving average and trades 51 percent above its twelve-month low, with the 50-day line now above the 200-day. We check whether the coin is a good buy at current prices.


More from CryptoTicker