
Is Hyperliquid a Good Buy at Current Prices?
HYPE slipped below its 50-day average in October, triggering the test we set in September. What buybacks, team sales and leverage mean now: is Hyperliquid a good buy at current prices?





Which topics should we dive deeper into?
Select what genuinely interests you. Your picks feed directly into our editorial planning.
Crypto news that's actually worth your time.
Weekly. 60 seconds. Carefully curated by our editors: no hype, no promo flood, no spam.
Hyperliquid (HYPE) changed hands at 81.78 US dollars in the night to Thursday, 22 October 2026, up 0.9 per cent in 24 hours. Since our first assessment on 29 September the token has made a second run higher and then a clear setback: on 5 October it traded as high as 95.22 dollars, just short of the September peak, before the sell-off of 6 to 8 October and the week that followed took it down to a low of 76.16 dollars on 18 October. HYPE is now 7.4 per cent below the price in our first version and 15.9 per cent below the highest daily close of the past twelve months, 97.18 dollars. The question is the same, the picture has turned: is Hyperliquid a good buy at current prices?
cryptoticker.io collected the price data itself late on 21 October 2026, from CoinMarketCap market data. The calculation is based on the daily closing prices of the past twelve months with the live price as the last data point; the moving averages follow the standard exponential formula, the Relative Strength Index the standard period of 14 days. Intraday highs and lows come from CoinMarketCap's daily candles. The table sets the figures from our first analysis on 29 September alongside; those were based on CoinGecko daily closes.
| Metric | 29 September 2026 | 22 October 2026 |
|---|---|---|
| Price | $88.31 | $81.78 |
| 50-day average | $81.16 | $82.76 |
| 200-day average | $62.68 | $66.55 |
| Distance to the 200-day line | +40.9% | +22.9% |
| Relative Strength Index (14 days) | 53.2 | 45.7 |
| Trading volume, 24 hours | $787.7m | $926.1m |
| Market capitalisation | $22.18bn | $20.76bn |
Hyperliquid price analysis: where the HYPE price stands today
At 81.78 dollars the HYPE price sits 1.2 per cent below its 50-day exponential moving average of 82.76 dollars and 22.9 per cent above its 200-day average of 66.55 dollars. At the end of September it stood 8.8 per cent above the faster line and 40.9 per cent above the slower one. The gap has closed from both sides: the price has fallen, and both averages have kept rising, the 50-day line from 81.16 to 82.76 dollars and the 200-day line from 62.68 to 66.55 dollars.
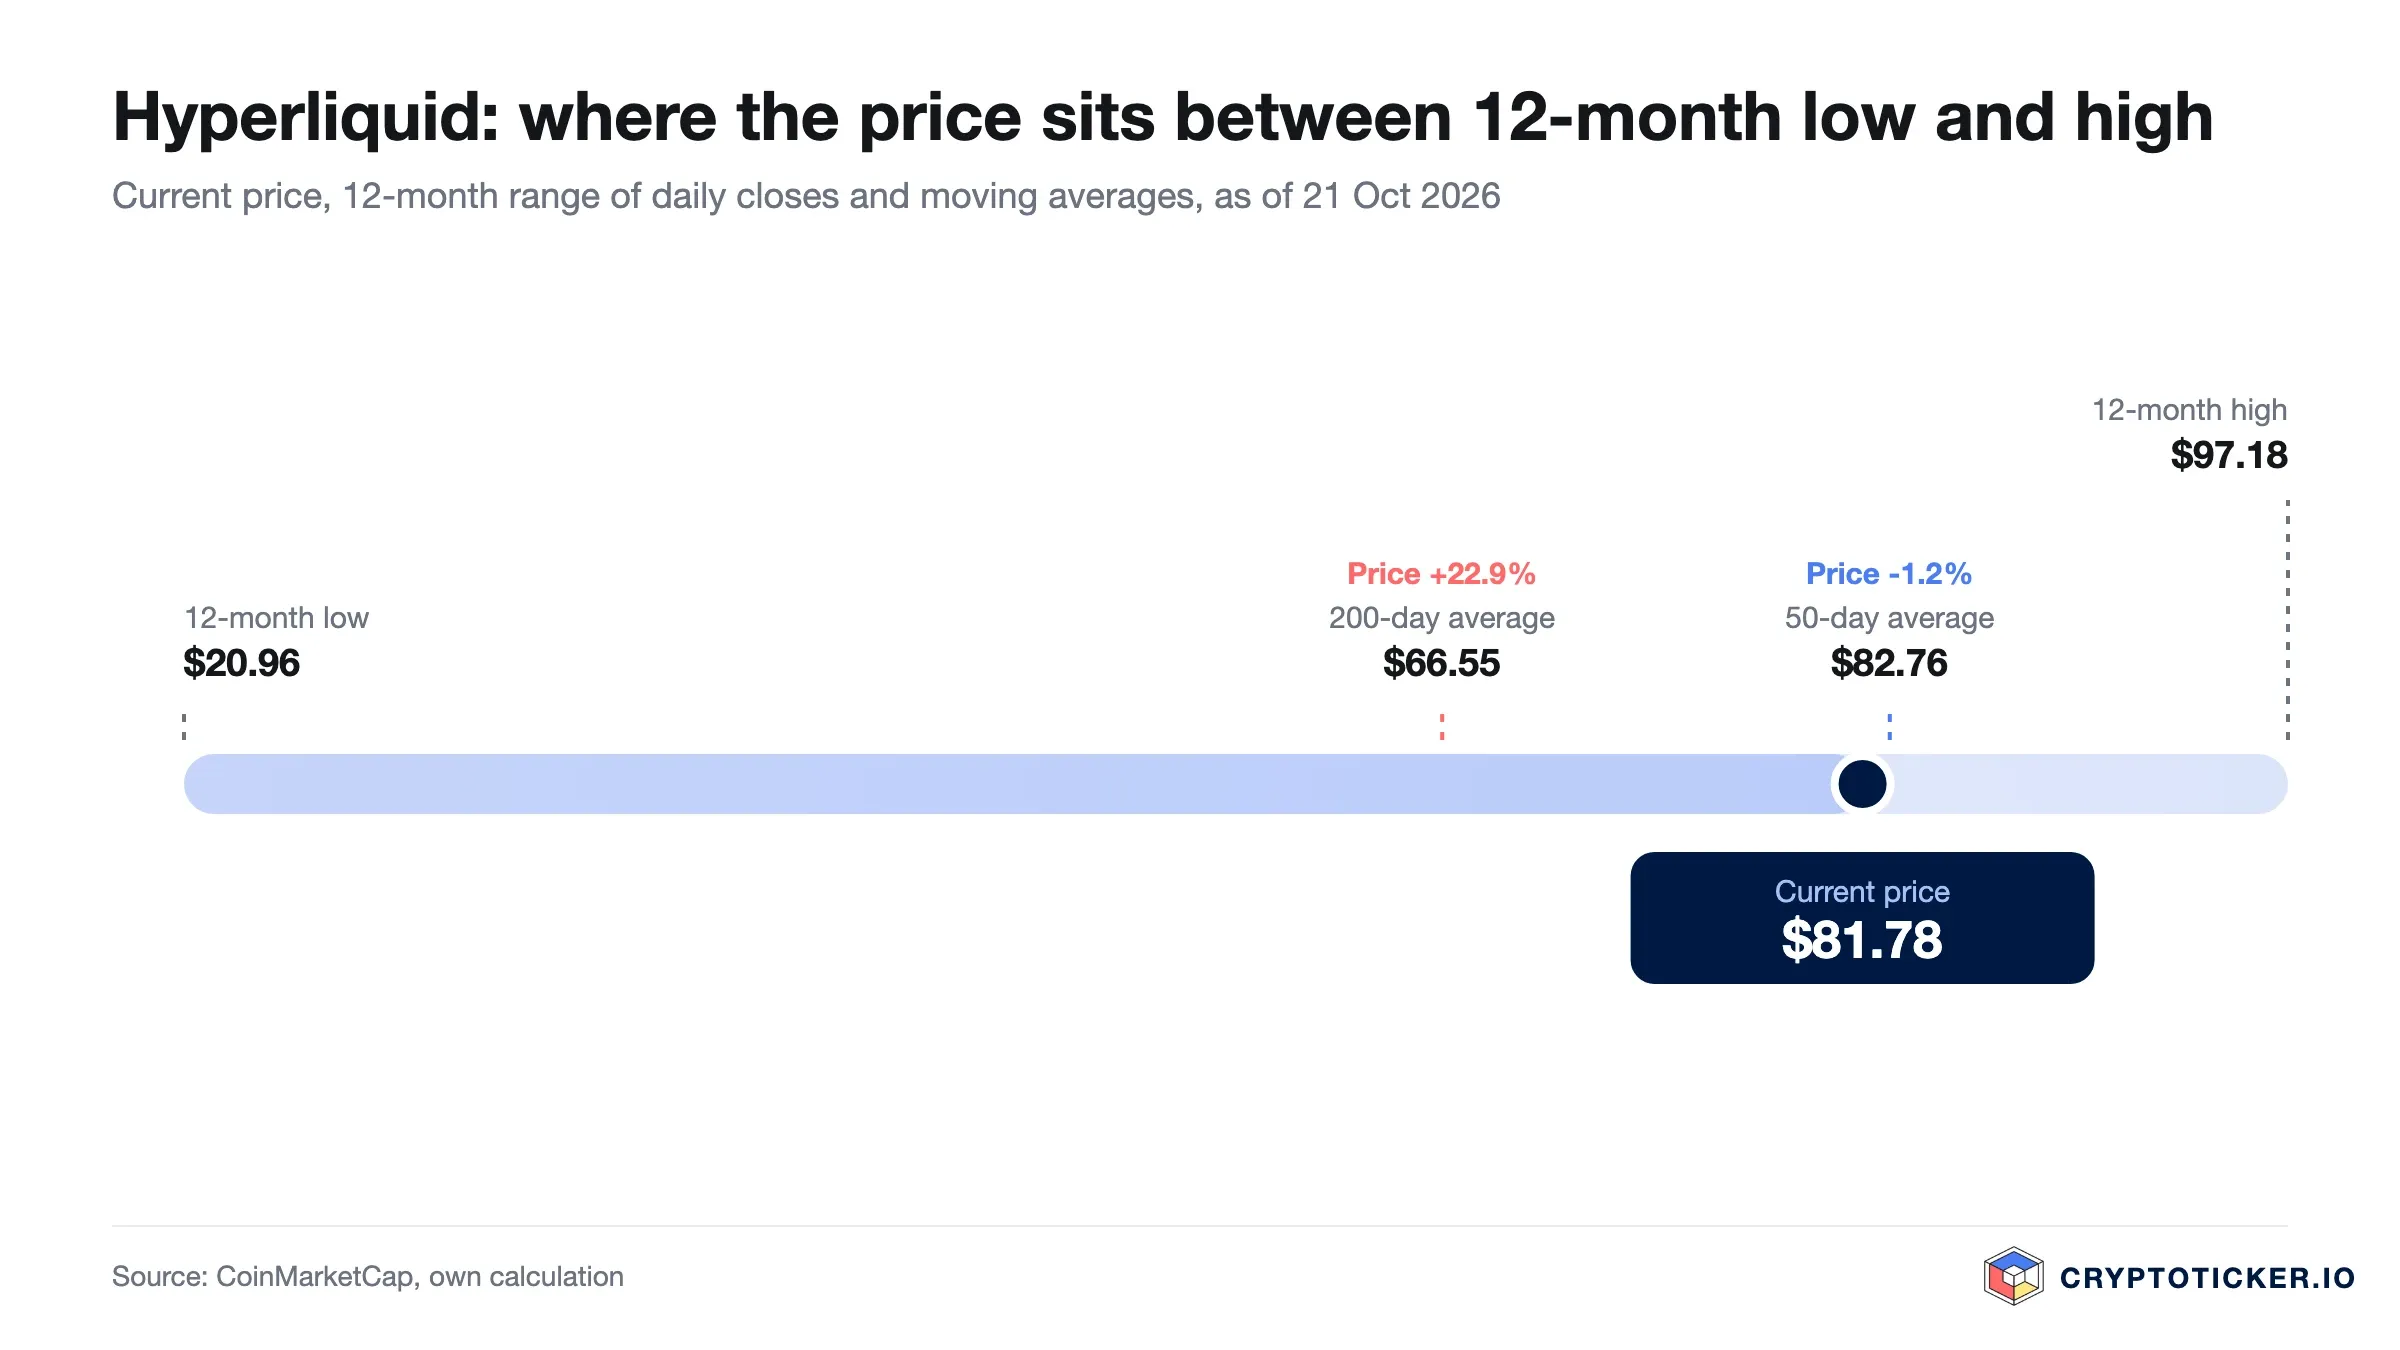
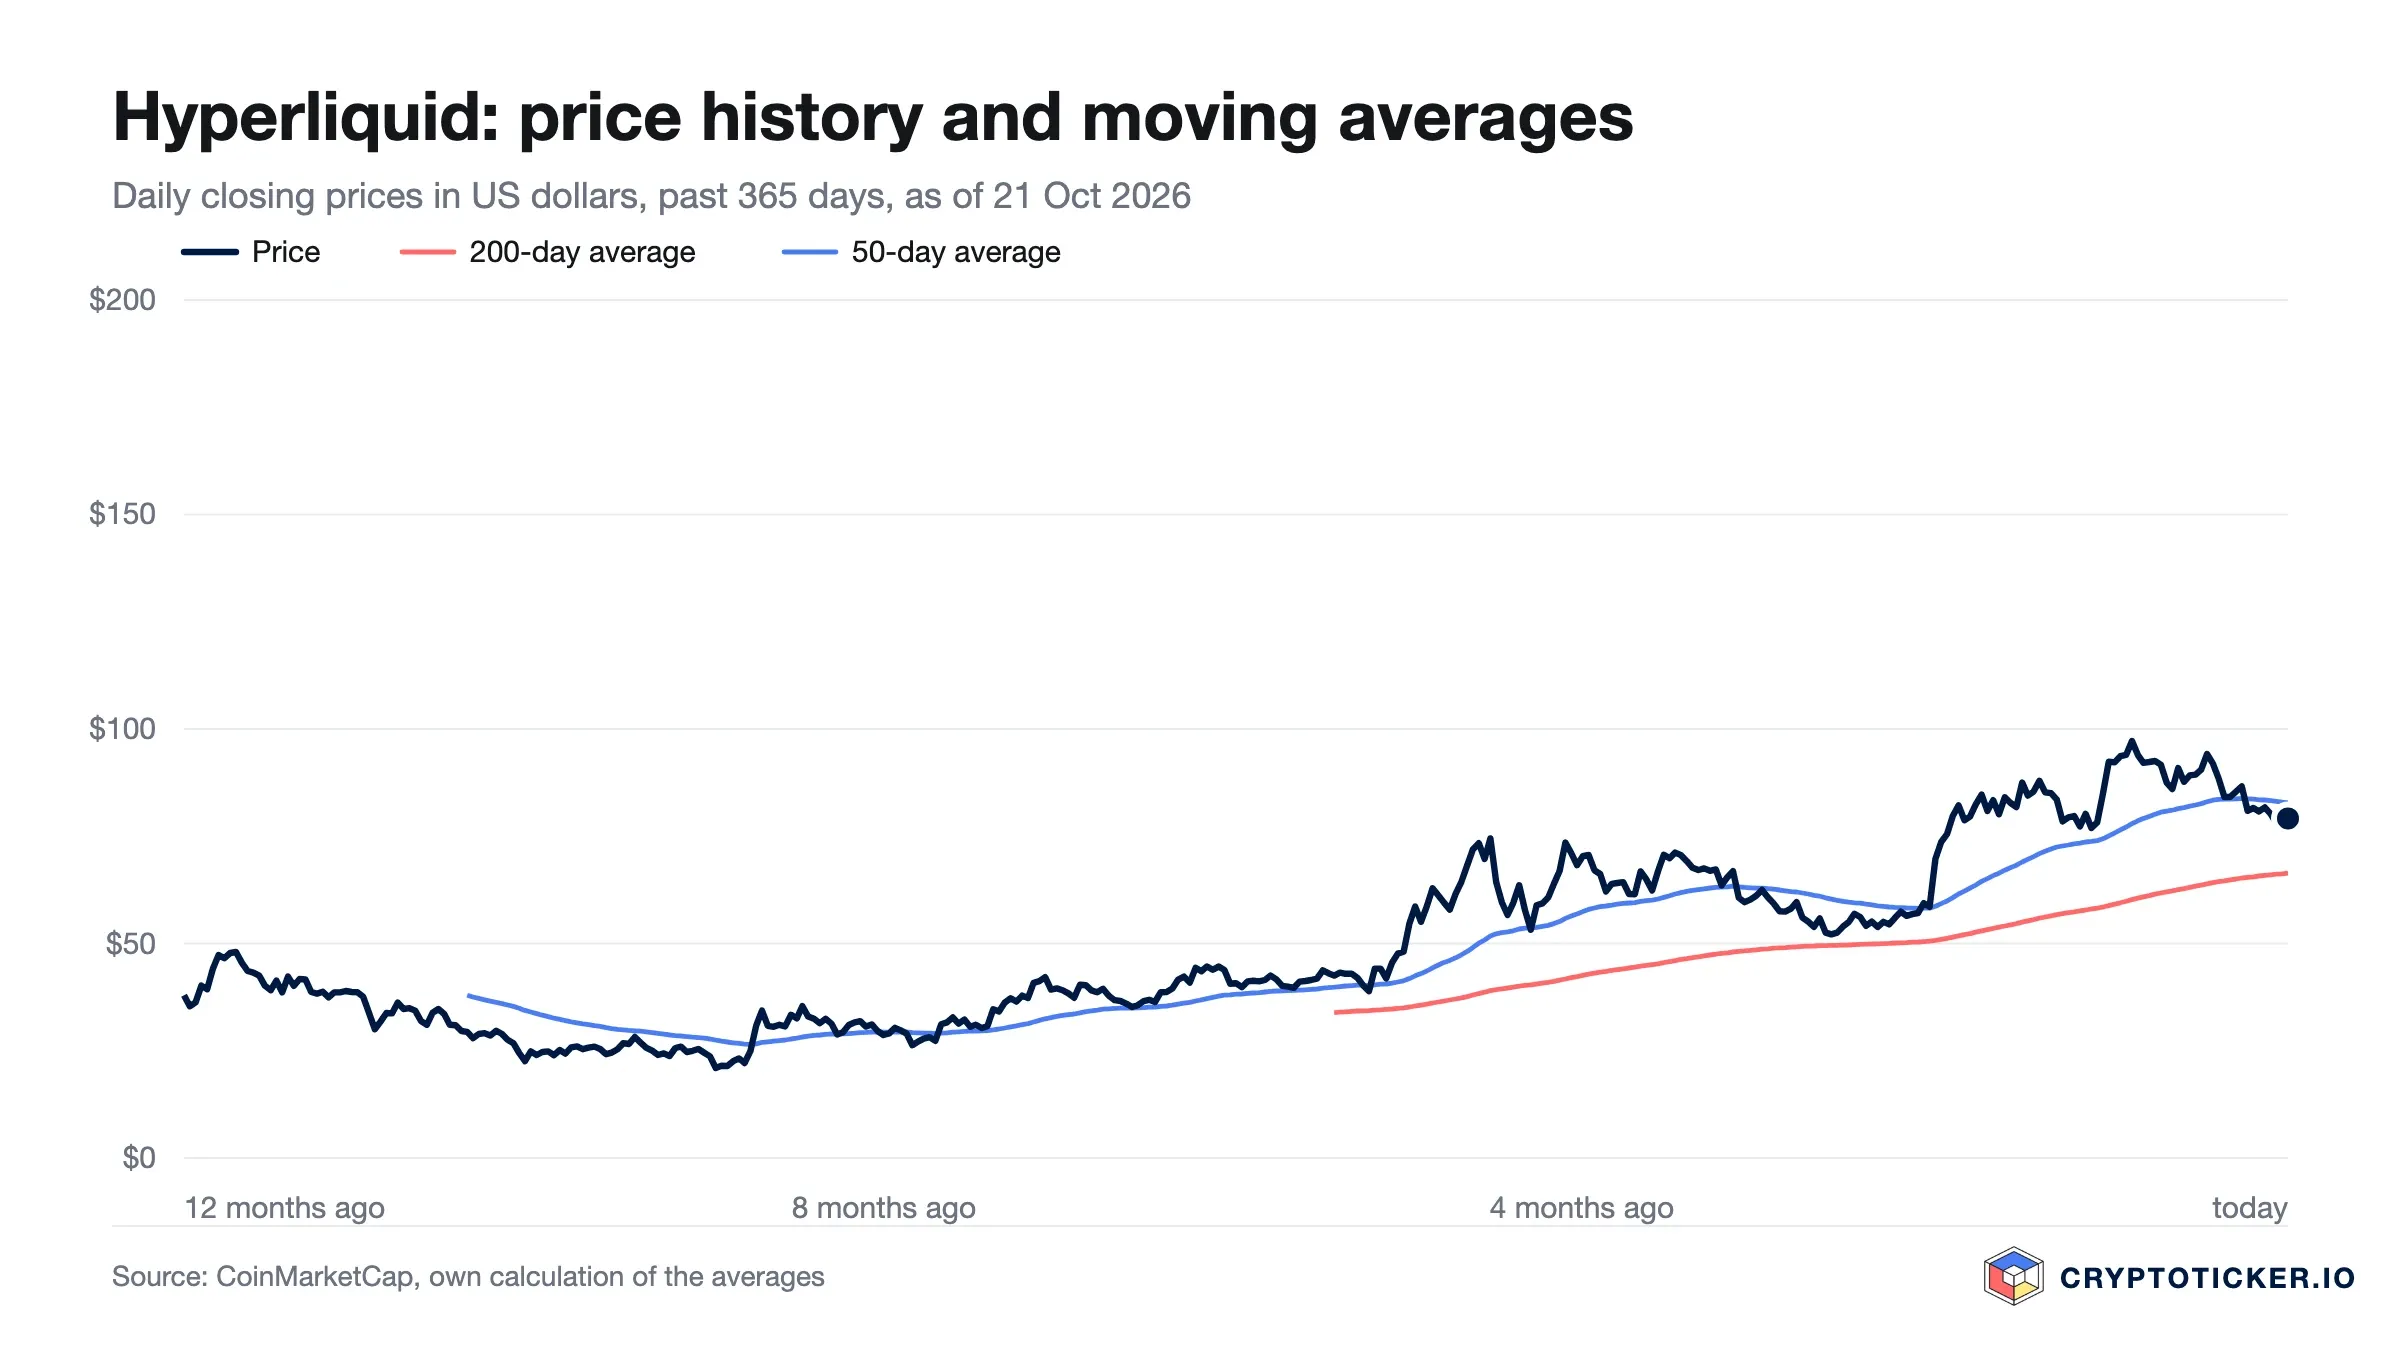
The levels now line up as follows. Overhead, the first test is the 50-day line at 82.76 dollars, which HYPE lost on 12 October and has been probing from below since. Above it sits the zone around 86 to 87 dollars from which the price slid on 12 October; the last daily close before the break was 86.63 dollars on 11 October. Further up stands the highest daily close of 97.18 dollars from 22 September. Below the price, the October low at 76.16 dollars and the September low at 76.92 dollars form a single support zone, and well beneath that runs the 200-day line at 66.55 dollars, the line separating a correction from a change of regime.
Market capitalisation stands at 20.76 billion dollars, which still places Hyperliquid tenth in the market. Rank matters for the buying question because index products and institutional mandates tend to screen by size, so a token inside the top ten is seen by more allocators than one at rank 25. Our Hyperliquid price prediction tracks the longer-dated scenarios.
Is the Hyperliquid uptrend broken, or only interrupted?
On 29 September we set out a test at this point: the assumption that the trend remains intact would count as refuted by a weekly close below the 50-day line at 81.16 dollars. That has happened. The week ending Sunday 18 October closed at 78.88 dollars, below the 81.16 mark and below the 50-day line, which stood at 82.94 dollars that day. The daily picture says the same: from 12 to 20 October HYPE closed below its 50-day line on nine days in a row. By our own yardstick, the short-term uptrend is broken.
The longer-term structure has held, if narrowly. The 50-day line at 82.76 dollars remains well above the 200-day line at 66.55 dollars, so the golden cross is intact, and the token is still up 41.2 per cent over 90 days and 115.6 per cent over twelve months, from 37.93 dollars a year ago. The sequence of higher lows also survived: the lowest October close was 77.98 dollars on 17 October, above the September low of 76.92 dollars, and only intraday on 18 October did the price dip briefly to 76.16 dollars. From the intraday peak of 97.98 dollars on 23 September to that low, HYPE lost 22.3 per cent, in a market where many altcoins set their lows on the same day after the US Federal Reserve's September rate rise and the sell-off of early October. A daily close back above the 50-day line, and more convincingly above 86.63 dollars, would undo the break of 12 October.
What RSI and moving averages mean for a Hyperliquid entry
The 14-day relative strength index reads 45.7, down from 53.2 at the end of September and 76.0 at the end of August. Values above 70 are conventionally described as overbought and values below 30 as oversold. At the lowest close on 17 October the index stood at 37.1, so the overbought reading of the summer has been fully worked off without the market ever becoming oversold.
The moving averages carry a mixed message. The 50-day line has turned lower, from 83.83 dollars on 11 October to 82.76 dollars now, while the 200-day line keeps rising. A buyer at 81.78 dollars is no longer paying up for an overextended move; instead, the buyer is stepping into a market that has to regain its short-term trend while the long-term one still holds.
The wider backdrop has cooled as well. Bitcoin traded at 84,760 dollars on 21 October, its dominance sits around 59 to 60 per cent, and the Federal Reserve meets again on 27 and 28 October after the minutes released on 7 October signalled a further rate rise. That is a market in which a token with HYPE's leverage profile tends to move further than Bitcoin in both directions.
What trading volume reveals about demand for HYPE
Trading volume over 24 hours came to 926.1 million dollars against a market capitalisation of 20.76 billion dollars, a turnover ratio of about 4.5 per cent, up from 3.6 per cent at the end of September. For a top-ten token that is healthy: an order of the size a private investor would place can be executed without moving the price, and the market is liquid enough to leave in a hurry.
The comparison with the averages is the informative part. The seven-day mean to 20 October sits at 654.3 million dollars a day and the 30-day mean at 830.9 million, against 908.9 and 1,073.2 million at the end of September. Activity has therefore thinned through October, with the 30-day mean about 23 per cent lower. The last 24 hours break that pattern: turnover ran 42 per cent above the weekly mean while the price rose only 0.9 per cent, a sign that buyers and sellers are meeting in size at the 50-day line without either side winning yet. The leverage on the token sharpens such moves; our analysis of the 1.66 billion dollars of open interest on HYPE shows how the slide of 12 and 13 October was amplified.
Hyperliquid also operates its own perpetual futures exchange, so much of the activity around the token happens on the platform whose fees the token is tied to. On 13 October it listed 234 perpetual markets with 11.75 billion dollars in open positions and 7.73 billion dollars of turnover in 24 hours, and since 16 October Pump.fun has been routing perpetual futures on Bitcoin and Ethereum through Hyperliquid's order book via builder codes. That link is a real advantage over tokens with no native flow, and it is why the project appears in our comparison of perpetual DEX platforms. The basics of the platform are set out in our profile What is Hyperliquid?
Which structural factors speak for Hyperliquid
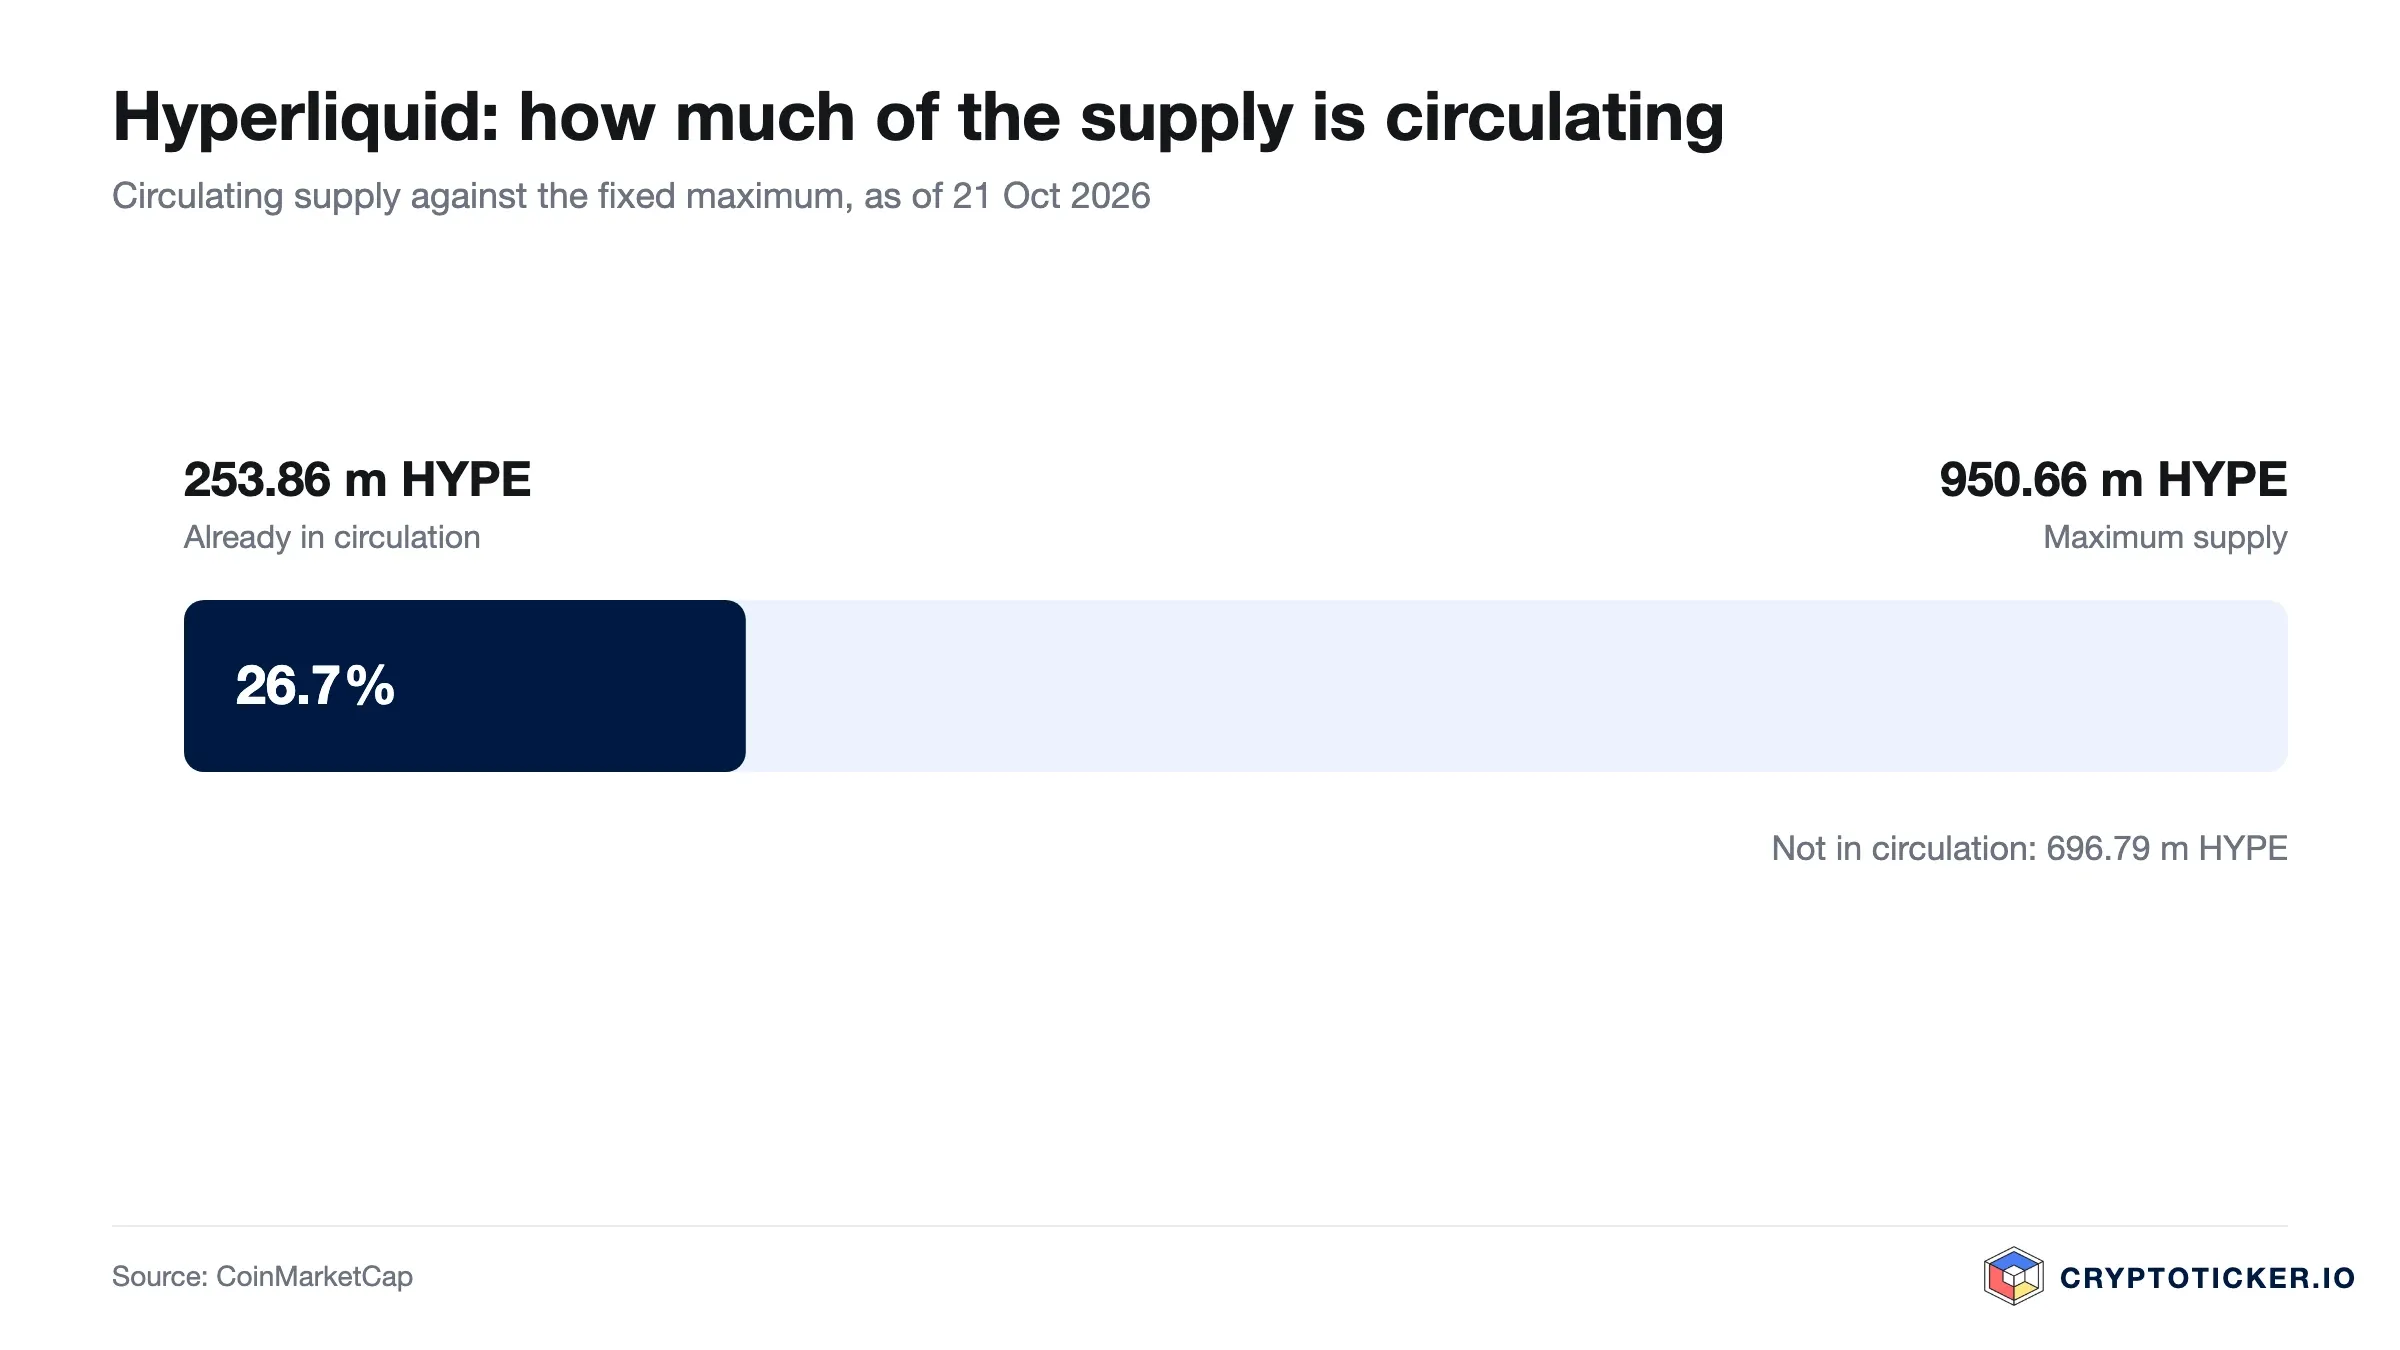
The supply mechanics are the most important number here that is not a price. Circulating supply stands at 253.86 million HYPE against a maximum of 950.66 million according to CoinMarketCap, so 26.7 per cent of the eventual supply is in the market and 696.79 million HYPE are not. The fully diluted valuation of 77.74 billion dollars is 3.7 times the market capitalisation. October brought the largest team distribution so far: Hyperliquid Labs unstaked 3.75 million HYPE, worth about 330 million dollars at the time, and passed them over the counter to an institutional buyer whose identity, price and any lock-up have not been disclosed.
Against that stands the fee mechanism, which gained a second source in October. Almost all trading fees go to the Assistance Fund, which buys HYPE in the open market, and under the AQAv2 framework about 90 per cent of the cost-adjusted yield on the platform's USDC reserves now flows into the same fund. The first payment came to about 14.58 million dollars, roughly what the trading business earns in protocol revenue in an average week; validators approved the framework on 12 June 2026 with 69.08 per cent support. Our report on the buyback funded by USDC earnings explains the mechanism. Whether that demand outruns the scheduled supply growth remains the central open question, and the price chart cannot answer it.
Regulation is the third structural factor. In February 2026 the European Securities and Markets Authority said that derivatives marketed as perpetual futures are likely to fall under the rules for contracts for difference, which cap leverage for retail clients at 2:1, and on 30 September the Hyperliquid Policy Center asked the European Commission to treat them differently. In the United States the project has moved towards regulated territory of its own: we reported on the pre-IPO futures filing submitted to the SEC. Filings are not approvals, and the outcome is open.
What speaks for buying Hyperliquid at current prices
First, the business now has two revenue streams behind the buyback. According to DefiLlama, fees produced about 71.4 million dollars of protocol revenue in the 30 days to 11 October, and the USDC reserve yield added a first payment of 14.58 million dollars. Under the published 30-day cycle, the next payment is due in early November.
Second, the overextension has fully unwound while the long-term trend holds. The RSI has come back from 76.0 in August to 45.7, and the gap to the 200-day line has almost halved from 40.9 to 22.9 per cent. The 50-day line still sits above the 200-day line, and the lowest October close stayed above the September low. Anyone who waited for a cheaper entry now gets one 15.9 per cent below the highest daily close.
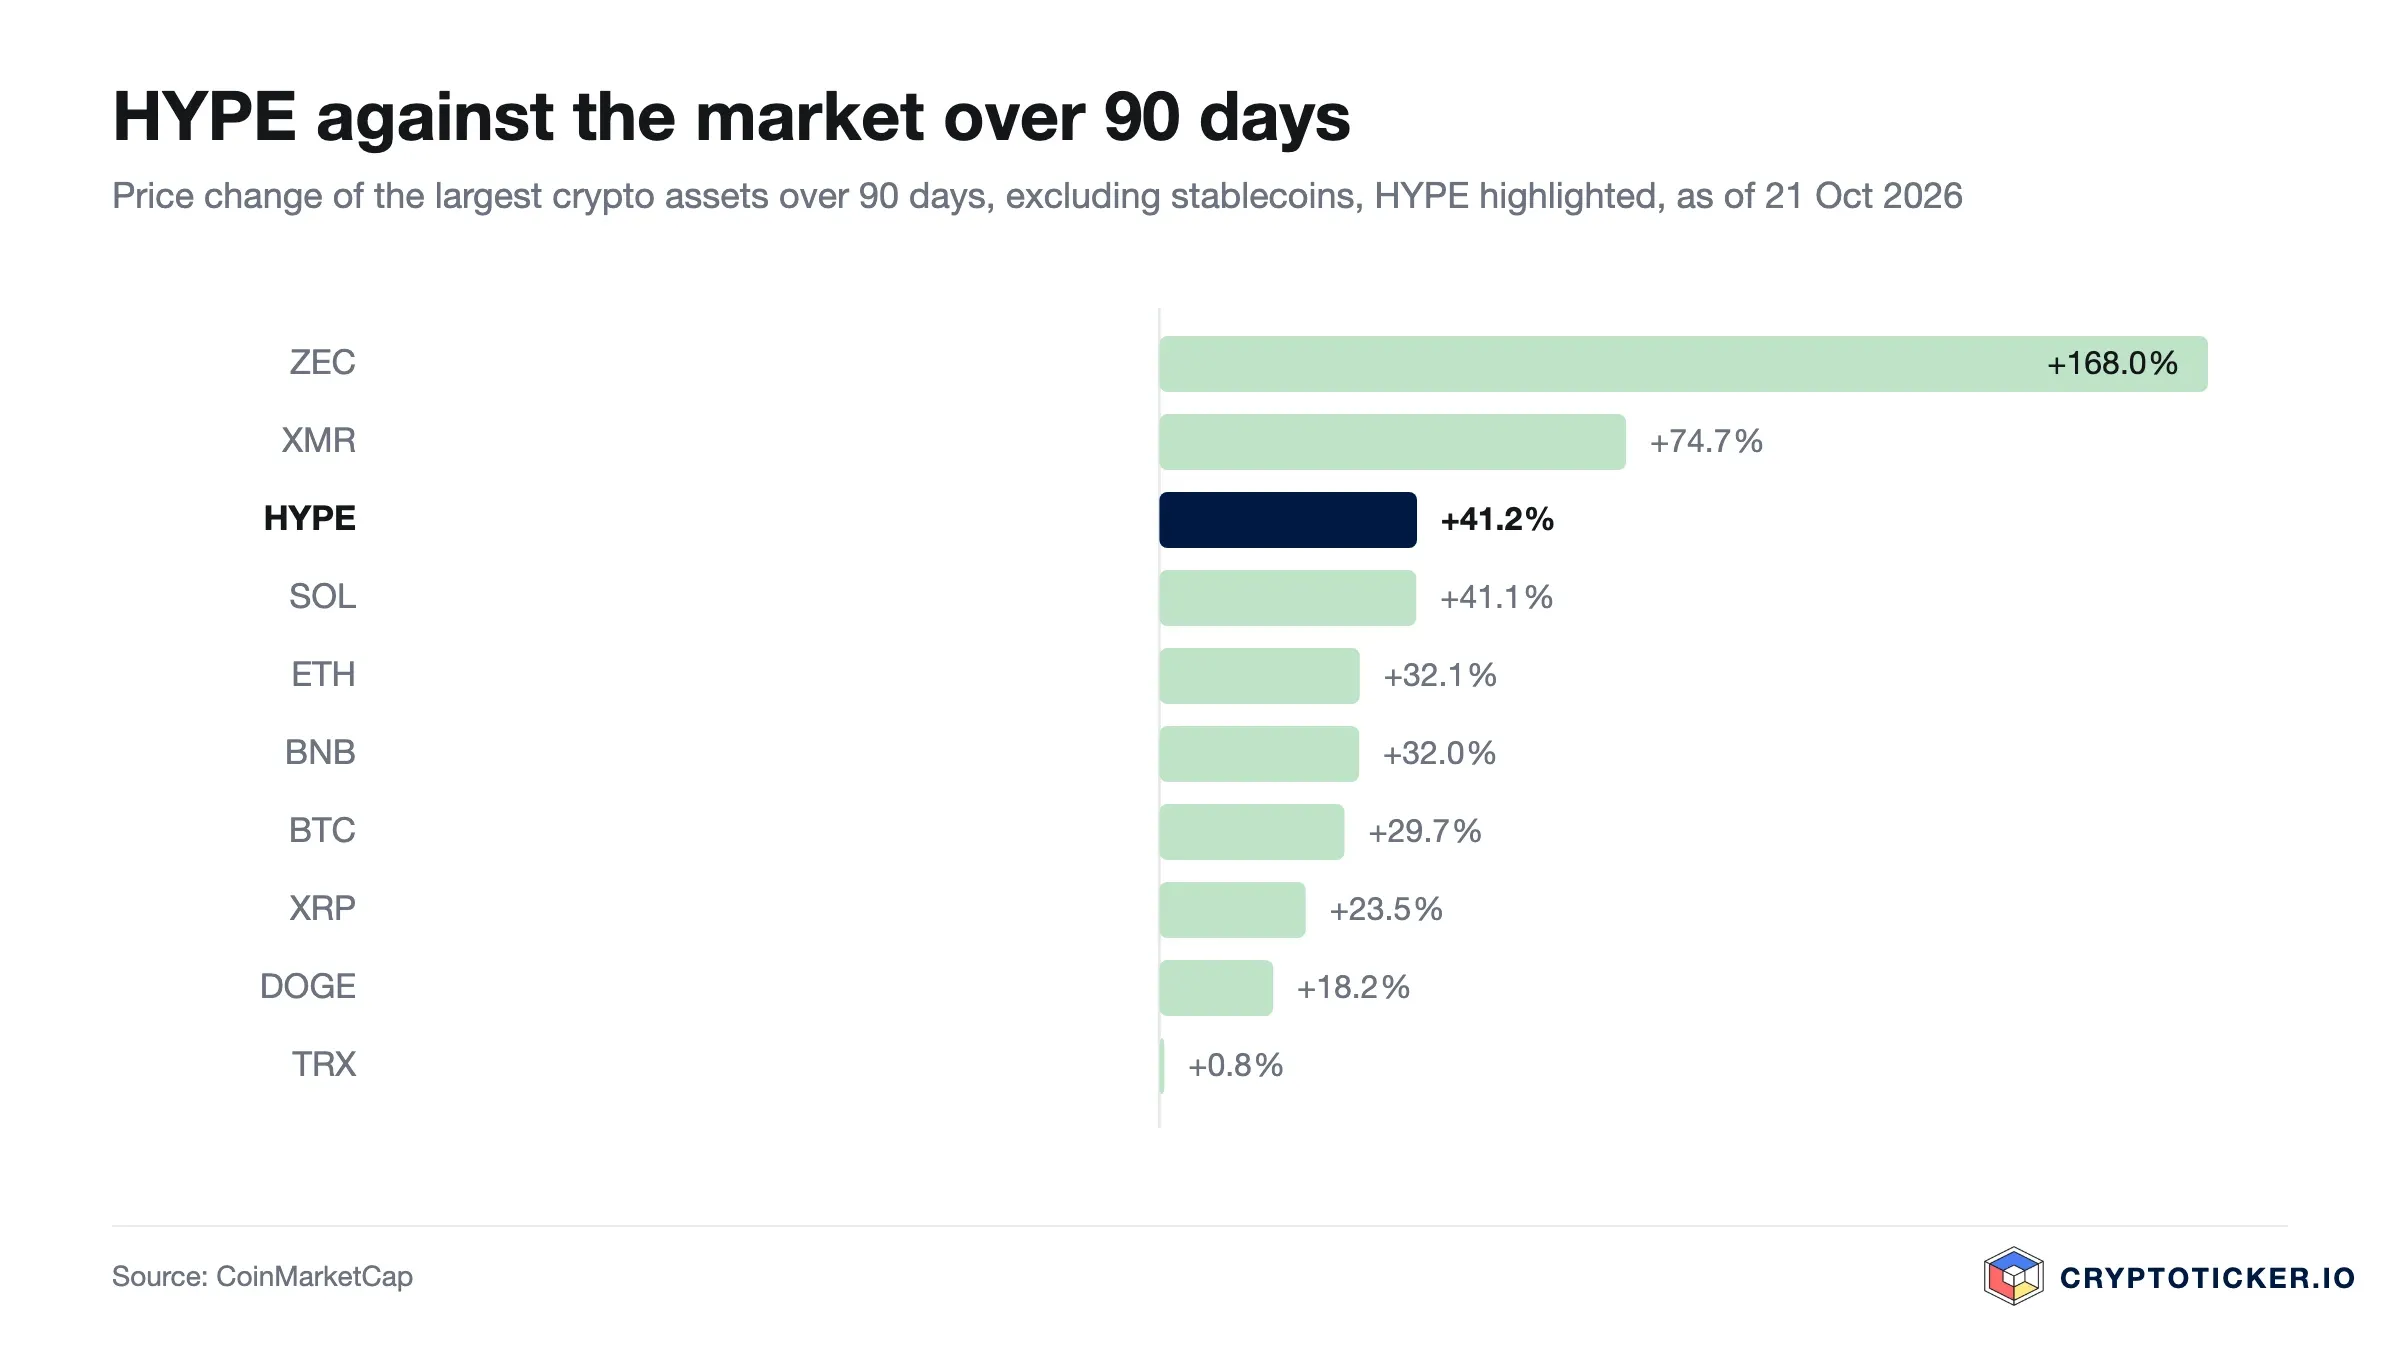
Third, relative strength. Up 41.2 per cent over 90 days, HYPE is ahead of Ether at 32.1 per cent and Bitcoin at 29.7 per cent and just ahead of Solana at 41.1 per cent; among the ten largest crypto assets excluding stablecoins only Zcash and Monero have done better. A place in the top ten at 20.76 billion dollars keeps the token in view of allocators that screen by size.

What speaks against buying Hyperliquid at current prices
First, the short-term trend is broken. HYPE has closed below its 50-day line since 12 October, it is down 12.3 per cent over 30 days, and it trades 15.9 per cent below its highest daily close. Overhead sits the zone between 85 and 97 dollars where much of the September and early October trading took place, and many of the buyers from that zone are now under water.
Second, the supply overhang. With 253.86 million of a maximum 950.66 million HYPE in circulation, the market will have to absorb a multiple of today's float over the coming years. Team distributions continue monthly, although public unlock calendars disagree on dates and amounts. Fee-funded buying works against that but does not offset large tranches: in the week before 6 October the Assistance Fund bought back 11.81 million dollars of HYPE, about 3.6 per cent of the value of the October team tranche.
Third, leverage on the exchange's own token. On 13 October Hyperliquid carried 1.66 billion dollars of open positions on HYPE, almost three times the daily turnover in that market. That amplifies moves in both directions: on 13 October HYPE fell 5.9 per cent in 24 hours while Bitcoin lost 0.8 per cent. With the Federal Reserve meeting on 27 and 28 October and US consumer prices up 3.7 per cent in September, the macro calendar offers no shelter.
How to buy Hyperliquid at current prices
Availability is the first obstacle. HYPE is not listed everywhere, and the venues that do list it differ widely in fees and in the protections they offer. Regulated European exchanges are the straightforward route for most buyers; our exchange comparison and the narrower list of regulated exchanges show where the differences sit. Among individual venues we have reviewed Kraken and Bitpanda.
Costs come in three layers, and only the first is advertised: the trading fee is visible, the spread between bid and ask is not, and the withdrawal fee applies only if you move the token off the exchange. In the week to 20 October HYPE's daily ranges ran between 3.3 and 6.3 per cent, so a market order can fill noticeably away from the quoted price; a limit order fixes the most you are willing to pay.
Custody is the decision that follows. Leaving the token on the exchange keeps it available for sale; moving it to a hardware wallet removes the exchange as a point of failure and adds the burden of keeping a recovery phrase safe for as long as you hold. Our hardware wallet comparison sets out what the devices actually protect against. Whichever route you choose, verify current fees with the provider before you buy.
So is Hyperliquid a good buy at current prices?
On a short horizon, a buyer at 81.78 dollars steps into a broken short-term trend. The overbought reading is gone, but HYPE has not regained its 50-day line since 12 October. The October low at 76.16 dollars is 6.9 per cent below the price, the highest daily close of 97.18 dollars 18.8 per cent above it. Buying now is a bet that the 76 to 77 dollar zone holds a second time, and the Federal Reserve meeting on 27 and 28 October is the next test on the calendar.
On a longer horizon the question is still the supply rather than the chart. The long-term test we named in September, exchange turnover falling over two or more consecutive quarters while circulating supply keeps rising, cannot be settled before the year is out. October points in that direction on both counts so far: the 30-day volume mean is down about 23 per cent, and circulating supply has grown from 251.13 to 253.86 million HYPE. Against that, the buyback now draws on reserve yield as well as fees.
This assessment would count as refuted by one of three things. First, a daily close below 76 dollars, which would break the sequence of higher lows since January and make the 200-day line at 66.55 dollars the next test. Second, a USDC yield payment in early November below 10 million dollars while trading volume keeps falling, which would weaken the second pillar of demand. Third, in the other direction, a daily close above 86.63 dollars, the last close before the break of 12 October, which would mark the drop below the 50-day line as a false signal.
Buying Hyperliquid: what to take away
- The short-term trend is broken, the long-term one is not. At 81.78 dollars the price sits 1.2 per cent below the 50-day line at 82.76 dollars but 22.9 per cent above the 200-day line at 66.55 dollars, with an RSI of 45.7. The longer-dated scenarios are set out in our Hyperliquid price prediction.
- Supply is still the decisive variable. With 253.86 million of a maximum 950.66 million HYPE in circulation, buybacks funded by fees and now by USDC reserve yield have to outrun a growing float, and that contest is why the project sits in our perpetual DEX comparison.
- Where you buy changes the outcome more than timing does for most buyers. Fees, spreads and custody differ sharply between venues; the regulated exchange comparison settles that before the order rather than after it.
Disclosure: Some of the providers mentioned in this article work with us through affiliate programmes. This has no influence on the price analysis or on the assessment of the chart situation; the price data comes from a public market data source and can be verified there.
(As of 22 October 2026, first version of 29 September 2026. This article is not investment advice. Prices, fees and terms change; check them with the provider yourself before every purchase. Crypto assets are subject to high price volatility, and a total loss is possible.)
Transparency note: This article was produced with the assistance of artificial intelligence and reviewed by our editorial team before publication. All figures and claims were checked against the primary sources linked in the text. The feature image was generated with AI.
Related articles
- Hyperliquid Price Explodes 22%: Here Is the Next Target
- Hyperliquid Price Analysis: Will HYPE Break Resistance at $50?
- Hyperliquid Price Surges: Why HYPE is Defying the 2026 Crypto Bear Market
- HYPE Outperformed Bitcoin and Ethereum in 2026...Here's Why
- XRP Price Drops Below $1.50: Where Is Ripple Heading This Week?
Which topics should we dive deeper into?
Select what genuinely interests you. Your picks feed directly into our editorial planning.
Crypto news that's actually worth your time.
Weekly. 60 seconds. Carefully curated by our editors: no hype, no promo flood, no spam.

August 27, 2026 11:25 AM

Is Pump.fun a Good Buy at Current Prices?
PUMP now sits only just above its 50-day average and still trades below its twelve-month high. We check with our own price data what argues for and against buying Pump.fun at the current price.
August 27, 2026 6:38 AM

Is NEAR Protocol a Good Buy at Current Prices?
NEAR has nearly tripled since August, and the trend break we defined back then has happened. What ETF buying, leverage and issuance mean now: is NEAR Protocol a good buy at current prices?
August 27, 2026 2:21 AM

Is SUI a Good Buy at Current Prices?
SUI is holding its 200-day moving average and trades 51 percent above its twelve-month low, with the 50-day line now above the 200-day. We check whether the coin is a good buy at current prices.

May 18, 2026 1:07 PM

Is Solana a Good Buy in 2026? SOL Price Analysis and Potential ROI
Solana (SOL) trades at $104.40 after clearing the $100 resistance. Here's how SOL's potential returns stack up against BTC, ETH, and XRP.
May 13, 2026 11:02 AM

Is PEPE Coin worth Buying in 2026?
PEPE still holds both its 50 day and its 200 day average, while trading volume has slipped back below its yearly norm. What that means for anyone buying at current prices, and the two levels that settle it.

October 3, 2026 7:13 AM

Hyperliquid Price Prediction: Team Hands 3.75 Million HYPE to a Single Large Investor
Hyperliquid Labs is unstaking 3.75 million HYPE, around $329 million, and selling them over the counter to a single investor. The price stands 10 percent below the record of September 23. What the sale means and which levels count.

June 15, 2026 3:48 PM

Hyperliquid Price Prediction: HYPE Becomes a Top 10 Contender as Market Cap Surges Past $16B
Hyperliquid price prediction as HYPE surges near the top 10 with a market cap above $16B. Can HYPE continue its rally toward $70, $75 and $80?
September 23, 2024 8:44 AM
Is it a Good Idea to Buy XRP below $0.60?
With recent XRP price drops positioning it below the $0.60 mark, investors are left pondering. Is it a good idea to buy XRP below $0.60?
May 15, 2026 9:47 AM

Top 10 Altcoins to Buy in May 2026 as Bitcoin Recovers
Here are the top 10 altcoins to buy in May 2026 as Bitcoin rebounds near $80K and market momentum shifts.
June 10, 2025 12:17 PM

Hyperliquid Hits New ATH Today: What's the Hype about HYPE?
Hyperliquid (HYPE) just hit a new all-time high, and traders are piling in. But what's fueling this rally, and is it sustainable? We break down everything from whale activity to tokenomics.
April 24, 2026 3:29 PM
XRP Price Prediction: Why Ripple is Stuck in a Sideways Grind
XRP price remains stagnant despite regulatory wins. This XRP price prediction analyzes the technical chart and identifies the key breakout levels for 2026.
July 22, 2025 9:28 AM
XRP Price Prediction: Is Now the Right Time to Buy XRP After the Dip?
XRP price pulled back -2.6% in the last 24 hours following a sharp +22% weekly surge. Should you buy the dip or wait for a better entry?
September 18, 2026 10:20 PM

Hyperliquid at a Record High: What Is Behind the HYPE Jump Above $90 and What to Check Before Buying
HYPE, the token of the trading platform Hyperliquid, has set a new all-time high at $92.56. The trigger is a new lending function. What is behind it, what risks the rise brings and what you should check from Germany before buying.
July 7, 2024 3:21 PM
XRP, DOGE, and ADA Price Prediction: A Fast Recovery BUT How Long Lasting?
The potential turnaround for XRP, Dogecoin, and Cardano as key metrics indicates a buying opportunity amidst the current market downturn. Here is the latest XRP, DOGE, and ADA price prediction and analysis for a better understanding.
April 6, 2026 6:24 PM

Ethereum Price Analysis: ETH Consolidates Between $1,800 and $2,100, What’s Next?
Ethereum price is stuck in a tight range between $1,800 and $2,100. Analysts warn of a decisive breakout or breakdown as volatility reaches a boiling point.
July 21, 2025 5:00 AM

Cardano Price Prediction: ADA Finally Wakes Up After Bitcoin ATH
Cardano has been lagging — until now. While Bitcoin topped out weeks ago, ADA is just starting to move. What’s next for the ADA price?
October 21, 2026 12:33 AM

Is Worldcoin a Good Buy at Current Prices?
Worldcoin has reclaimed both of its moving averages, and the 50-day line has crossed above the 200-day line for the first time this year. Whether that makes WLD a buy depends on the locked supply and on whether demand holds.
September 28, 2026 4:28 AM

Is Quant a Good Buy at the Current Price?
Quant climbed as high as 357 dollars after the bank mandate and has since fallen back sharply. Is QNT a good buy at the current price? We check the chart, volume, the banks' timetable and the token's role with our own data.
September 20, 2026 9:21 AM

Is Ethena a Good Buy at Current Prices?
Ethena has rebounded hard off its twelve-month low and still trades far below its high. Is ENA a good buy at current prices? We check the chart, the supply schedule and the source of the yield with our own price data.
March 12, 2026 2:52 PM
Ethereum Price Stabilizes Above $1,900: Is the Path to $3,000 Now Clear?
Ethereum price shows resilience above $1,900. Analyzing on-chain data and technical charts suggests a potential recovery toward the $3,000 psychological level.
January 26, 2026 10:50 AM

Bitcoin Price Prediction: BTC Breaches $88K Support and Faces Potential Downside
Bitcoin has dropped below the critical $88,000 support level on January 26, 2026. Market indicators suggest a risk of further declines amid global macro uncertainty.
August 27, 2026 6:23 AM

Is Bittensor a Good Buy at Current Prices?
Bittensor has passed the trend test we set in August: a weekly close above the 200-day average and a moving-average crossover in September. What the correction since the peak means: is Bittensor a good buy at current prices?
August 27, 2026 4:31 AM

Is AAVE a Good Buy at Current Prices?
AAVE has worked its way back above both the 200-day and the 50-day moving average, yet still trades far below its twelve-month high. Using our own price data, we examine what speaks for and against an entry at current prices.
August 27, 2026 3:39 AM

Is Cronos a Good Buy at Current Prices?
Cronos has reclaimed its 200-day line for the first time since the spring, and the RSI is back out of overbought. We weigh what speaks for and against buying CRO at the current price.
August 27, 2026 3:24 AM

Is Hedera a Good Buy at Current Prices?
Hedera met our trend-reversal test in September, then gave back the entire IBM jump. What higher lows, HashPack's stock tokens and Hitachi's exit from the council mean now: is Hedera a good buy at current prices?
August 26, 2026 4:21 AM

Is Uniswap a Good Buy at Current Prices?
Uniswap has gained about three quarters since August, and the trend test we set back then has been passed. What the fee switch, CME futures and the correction since September mean now: is Uniswap a good buy at current prices?

More from CryptoTicker