XRP Price Prediction: Why Ripple is Stuck in a Sideways Grind
XRP price remains stagnant despite regulatory wins. This XRP price prediction analyzes the technical chart and identifies the key breakout levels for 2026.


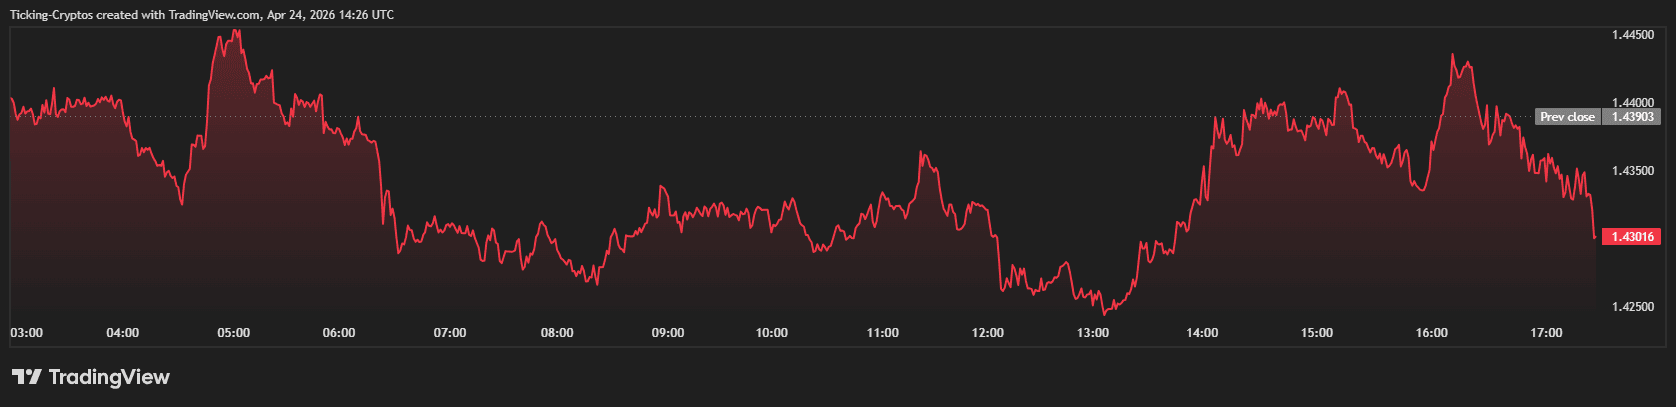
Ripple’s native token continues to trade within a frustratingly narrow range. As of April 24, 2026, the digital asset is hovering around the $1.43 mark, showing a lack of momentum that has characterized its performance for months.
Despite a massive legal victory in late 2025 and a joint SEC-CFTC classification as a "digital commodity" in March 2026, the expected "moon mission" has yet to materialize. Instead, XRP is currently in a "coiled spring" phase, waiting for a catalyst to break its structural handcuffs.
Ripple Price Today: (April 24, 2026)
- 24-Hour Change: -0.37%
- 7-Day Change: -1.35%
- 30-Day Change: +1.30%
- Year-to-Date (YTD): -44.78%
The Sideways Grind: Why Isn't XRP Moving?
The primary reason for the stagnant price action is a fundamental tension between institutional adoption and retail exhaustion. While Ripple has successfully launched its RLUSD stablecoin and expanded its cross-chain utility to Cardano and Ethereum via Wanchain, the market is currently "pricing in" these developments slowly.
Furthermore, a significant portion of the YTD decline (-44.78%) reflects a cooling off from the speculative highs of 2025. Investors are now looking for the CLARITY Act markup vote in late April to provide the next major legislative leg up. Without a fresh influx of retail FOMO, the price is largely being sustained by steady, yet quiet, institutional ETF inflows.
 Crypto taxes made simple: Compare the top-rated tools for 100% compliance and efficiency
XRP Price Analysis: The Breakout Levels
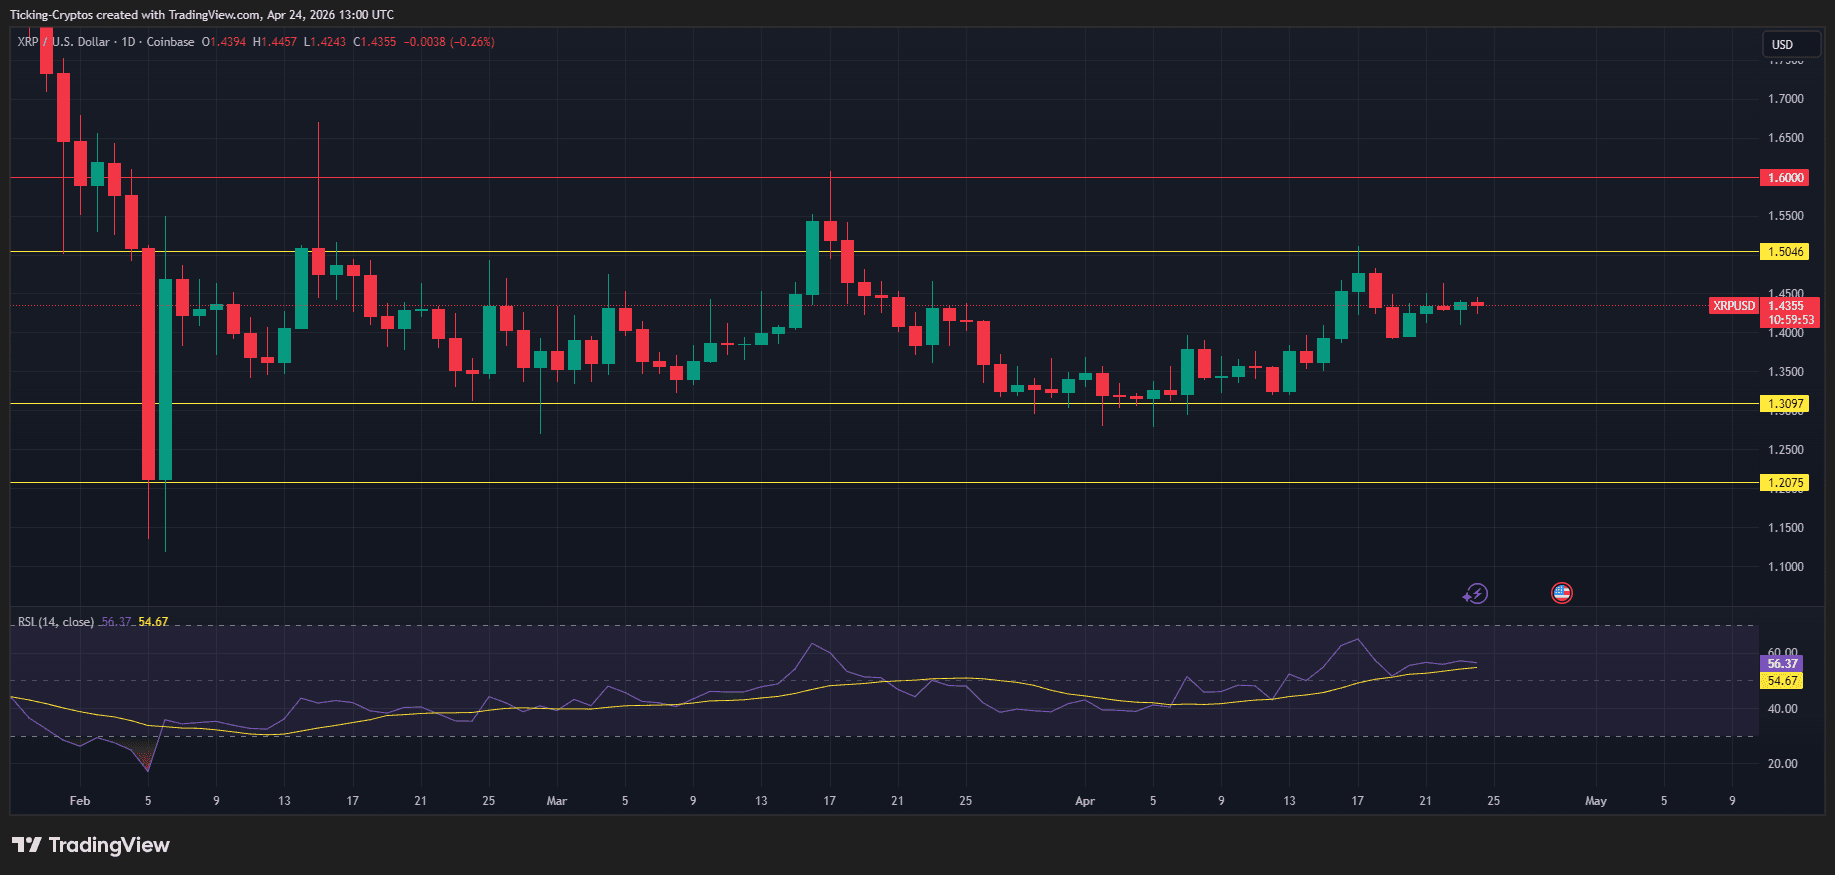
Looking at the 1D chart, $XRP is currently squeezed between very clearly defined horizontal boundaries. The price action is oscillating with low volatility, as evidenced by the Relative Strength Index (RSI) sitting at a neutral 54.67.
The Resistance: Higher Breakout Levels
To confirm a bullish reversal, XRP needs to clear two specific hurdles:
- Immediate Resistance ($1.4355 - $1.45): This is the current local ceiling. A daily close above this level is required to shift the short-term bias.
- Major Target ($1.5046): This level (highlighted in yellow on the chart) represents a psychological and structural barrier. A breakout here would likely trigger a fast move toward the $1.60 red resistance line, which has rejected price multiple times in Q1.
The Support: Lower Breakdown Levels
On the flip side, if the market remains bearish or the CLARITY Act faces delays:
- Primary Support ($1.3097): This is the most critical floor. As seen on the chart, XRP has consistently found buyers at this level since March.
- Emergency Support ($1.2075): If $1.30 fails, the next stop is the $1.20 zone. A drop below this level would invalidate the current consolidation and likely lead to a retest of the yearly lows.
How to Trade XRP Today?
For those looking to trade these levels, the current environment favors a "range-bound" strategy rather than a "trend-following" one. Buying near the $1.31 support and taking profits near $1.50 has been the most consistent play for the last 60 days.