
Is Pump.fun a Good Buy at Current Prices?
As of 13 November 2026: PUMP has fallen below its 50-day average and sits just above its 200-day line. We check with our own price data what that and the supply overhang mean for buying Pump.fun at the current price.

Which topics should we dive deeper into?
Select what genuinely interests you. Your picks feed directly into our editorial planning.
Crypto news that's actually worth your time.
Weekly. 60 seconds. Carefully curated by our editors: no hype, no promo flood, no spam.
As of 13 November 2026: Pump.fun with updated figures
Pump.fun closed at $0.003482 on 12 November 2026, 27.1 percent below the $0.004774 on which the analysis below, dated 21 October 2026, is based. The figures in this section are daily closing prices from CoinGecko; cryptoticker.io calculated the moving averages and the RSI from them.
| Metric | 12 November 2026 |
|---|---|
| Closing price | $0.003482 |
| 50-day average | $0.004250 |
| 200-day average | $0.003441 |
| RSI (14 days) | 36.3 |
| Change over 30 days | −30.6% |
| Change over 90 days | +22.6% |
| Twelve-month high | $0.006518 (4 October 2026) |
| Twelve-month low | $0.001199 (25 June 2026) |
| Daily trading volume (30-day average) | $144 million |
That puts Pump.fun 18.1 percent below its 50-day average, but 1.2 percent above its 200-day average. The 14-day relative strength index stands at 36.3, in neutral territory between 30 and 70. Trading volume averaged around $144 million a day over the past 30 days, below the 90-day average of around $213 million.
The analysis of 21 October 2026 named two tests. The first, a daily close below the 50-day average of $0.004655 at the time, has been triggered: since 22 October PUMP has closed below it every single day, 22 consecutive closes. By that standard the October decline was not over. The second, a retest of the twelve-month low of $0.001199, has not occurred: the lowest close since the analysis was $0.003469 on 11 November, still above the 200-day average of $0.003331 at the time. Today's 200-day average of $0.003441 sits only just below the price, and trading volume of around $144 million a day has fallen well below the 271 million dollars cited back then. The positive reading has thus lost its first support line; whether the recovery structure holds will now be decided at the 200-day line.
The sections below reflect the situation as of 21 October 2026.
Pump.fun (PUMP) changes hands at $0.004774 at the time of writing. That is roughly 26.8 percent below the twelve-month high of $0.006518 set on 5 October 2026, and almost four times the twelve-month low of $0.001199 from 26 June 2026. After a gain of 150 percent across ninety days but a loss of 4.8 percent in the past seven, the question facing anyone looking at the token today differs from the one that applied in August: is Pump.fun a good buy at current prices, or does the price already reflect what the platform delivers?
Figures as of 21 October 2026. Prices, averages and the relative strength index are calculated from daily closes across 365 days.
Advertisement: Crypto futures trading: Bitget offers leverage of up to 100x. Leverage can lead to high losses. Our exchange comparison shows more platforms.
Pump.fun price analysis: where the PUMP price stands and which levels matter
At $0.004774 the token holds a market capitalisation of about 2.21 billion dollars and ranks 49th by that measure. Both averages that define the medium-term picture still sit below that quote, but no longer far below: the 200-day average at $0.003331, the 50-day average at $0.004655. Price is therefore around 43 percent above its 200-day line and only 2.6 percent above its 50-day line, a configuration that says the advance has stalled rather than accelerated.
Three price zones organise the chart. The upper reference is the twelve-month high of $0.006518 from 5 October 2026, roughly 26.8 percent away. The current zone runs between the round $0.004 mark and the $0.005 area. Beneath that, the first structural floor is the 50-day average at $0.004655, and below it the 200-day average at $0.003331 marks the boundary of the trend that began at the June low of $0.001199.
The narrow gap between the current quote and the shorter line is the central fact of this analysis. A pullback that returns the token to its 50-day average would cost only 2.6 percent from today's level; the next line below costs 30 percent. That is arithmetic rather than forecast, and it defines the decision an entry at $0.004774 faces.
Is the Pump.fun downtrend broken or only interrupted?
From the September 2025 high to the June 2026 low of $0.001199, PUMP lost about 86 percent. Since that low the price has recovered roughly 298 percent, and over the full twelve months it stands about 29.1 percent higher than a year ago.
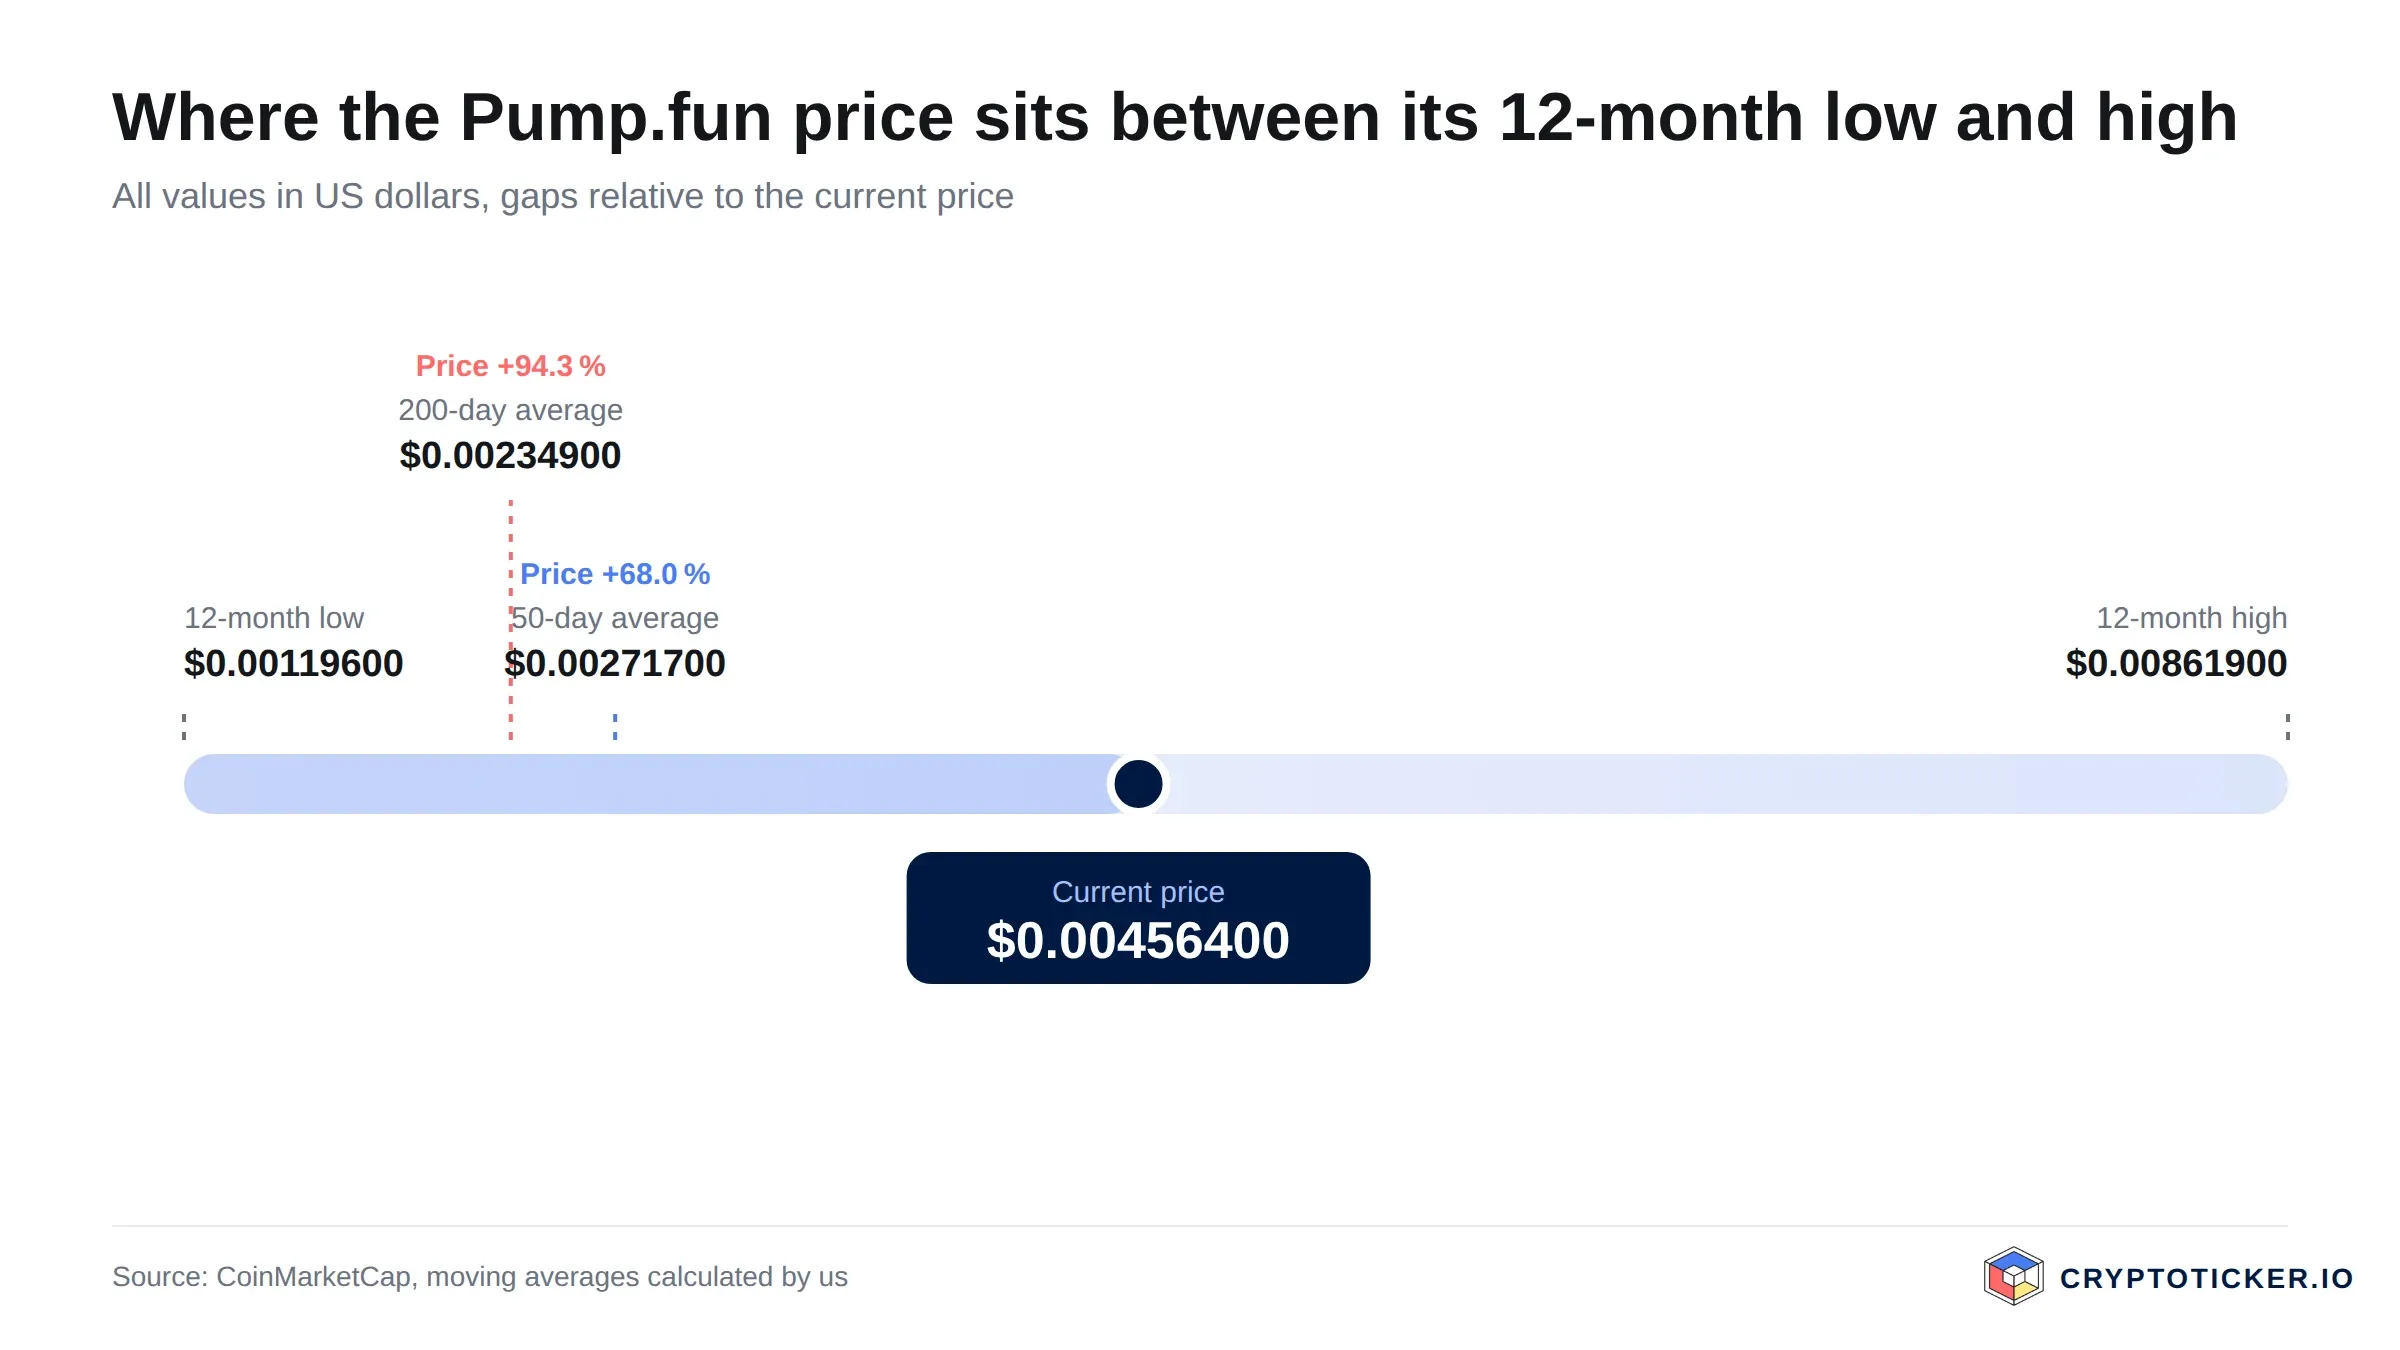
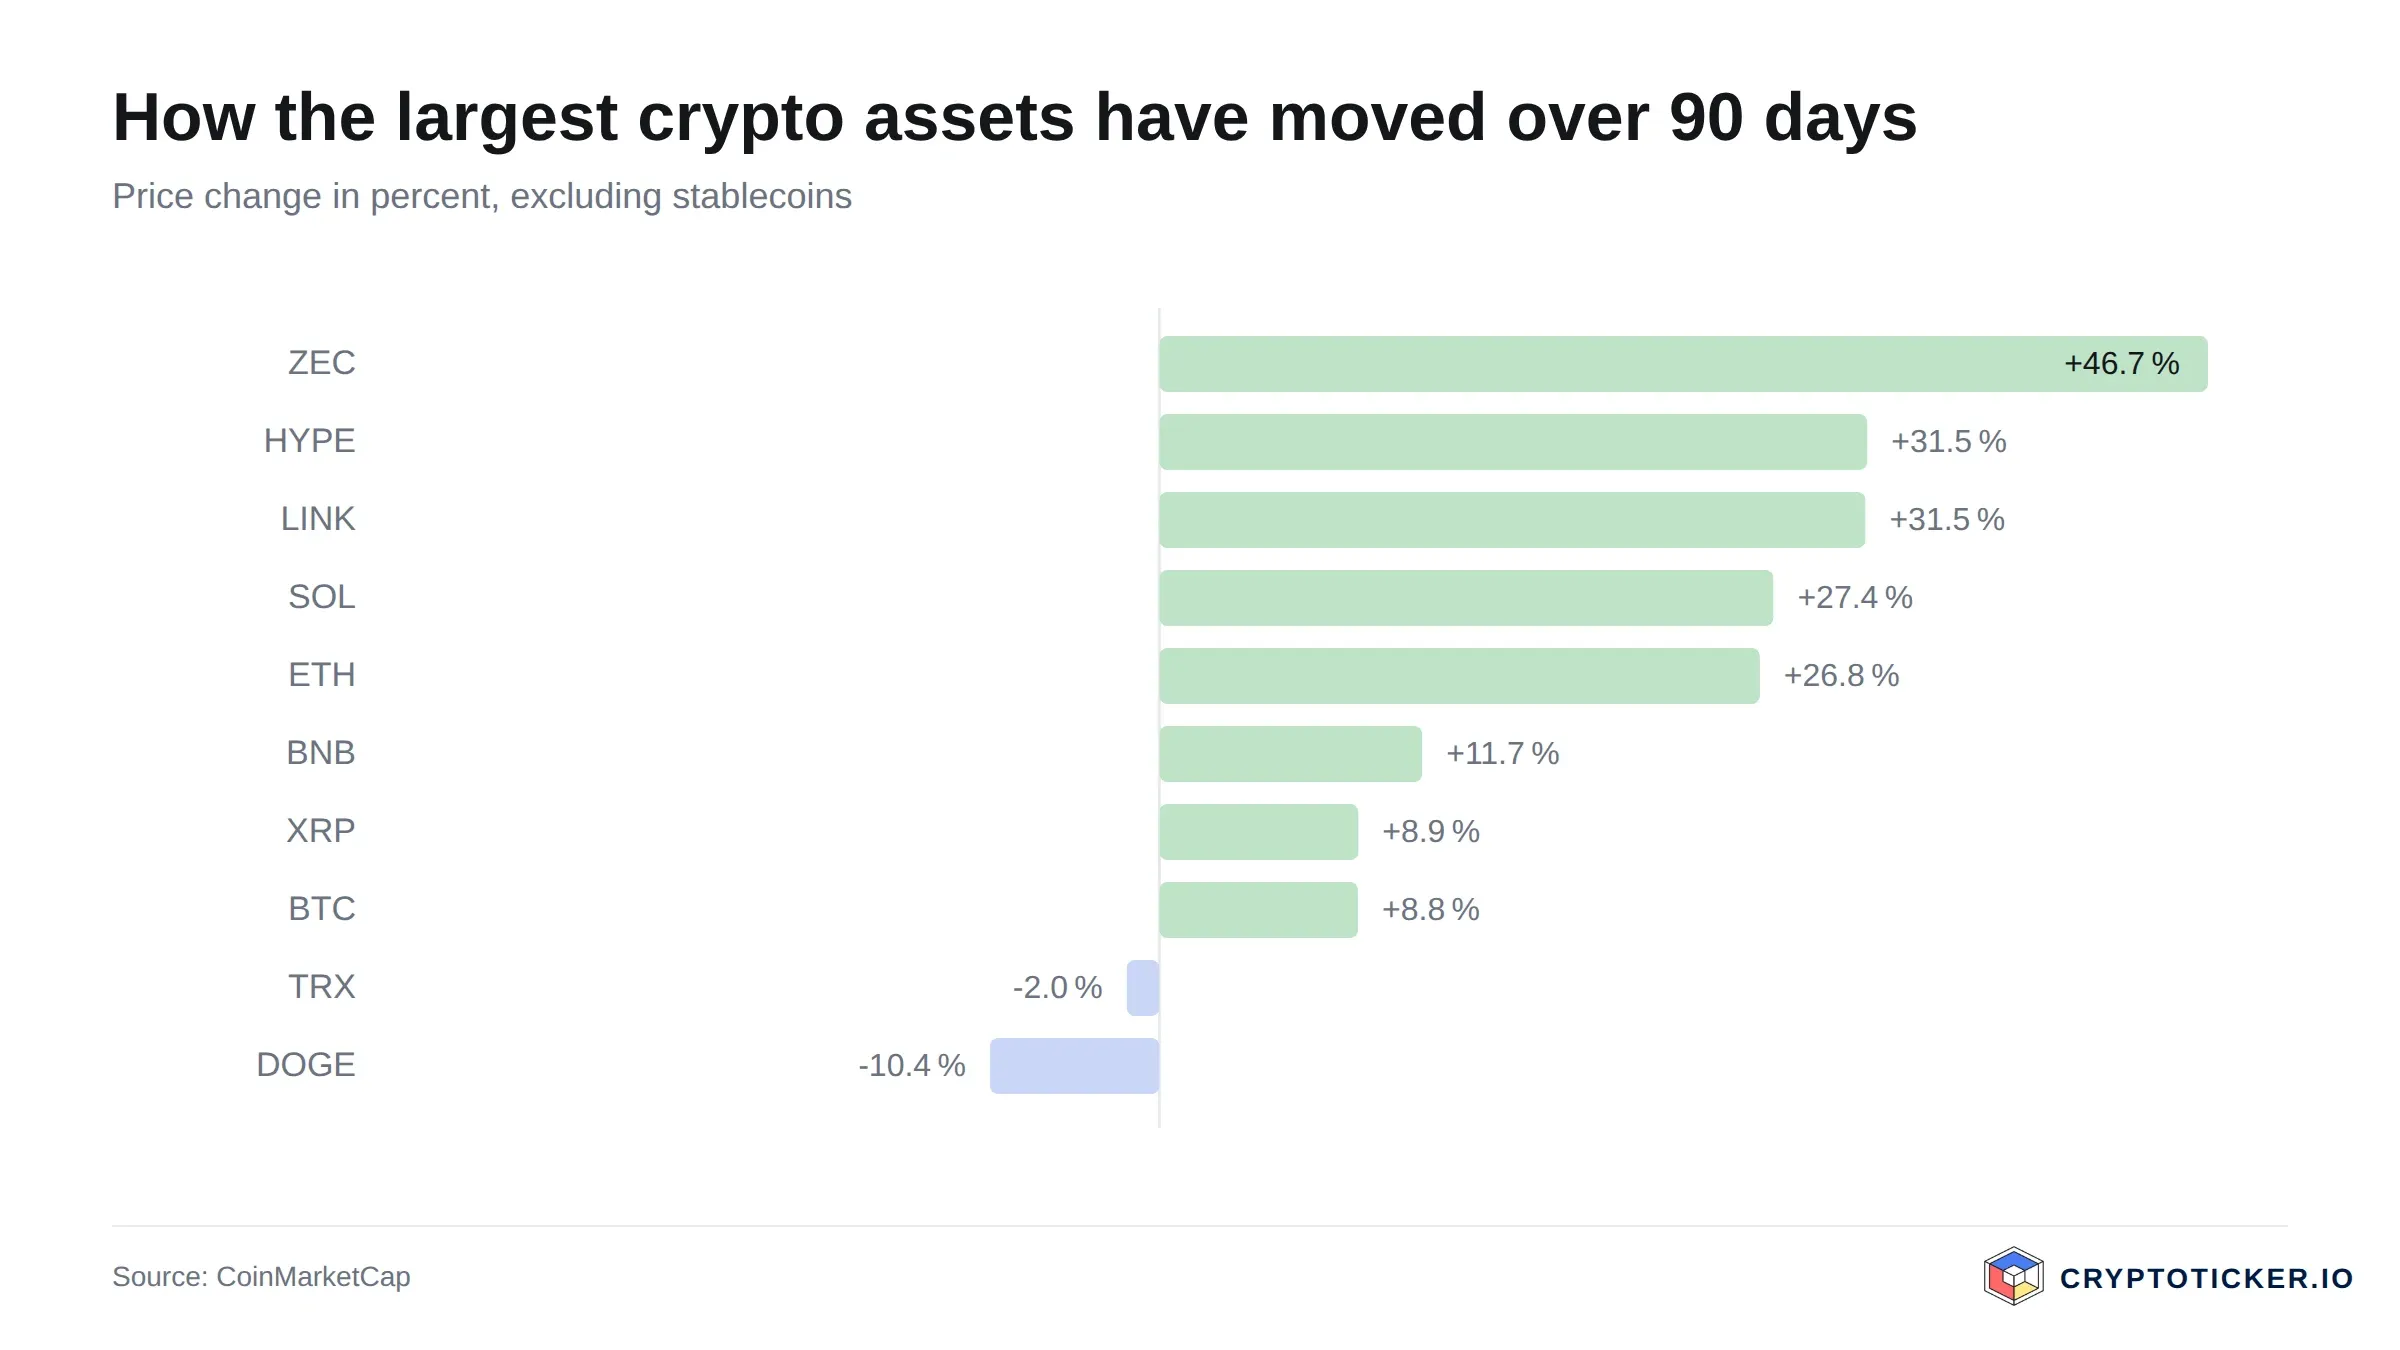
Technically, the downtrend is broken rather than merely interrupted. Price trades above both averages, and the 50-day average at $0.004655 sits above the 200-day average at $0.003331, the sequence trend followers read as a confirmed upward structure. That structure survived the two-week decline from the October high.
Two qualifications belong next to that reading. The token began trading in July 2025, so the entire data set covers a single market cycle. And a broken downtrend is a statement about direction rather than about valuation: the same chart that shows a recovery also shows a token that has given back a quarter of its value since 5 October.
What RSI and moving averages mean for a Pump.fun entry
The 14-day relative strength index stands at 47.9, in the neutral band. At the last update it stood at 70.2, which is conventionally called overbought. That condition has been worked off without the price losing either of its averages, and buyers today are no longer paying the premium that an overheated market demands.
The moving averages tell the same story in a different unit. An asset trading 2.6 percent above its 50-day line has returned to its own short-term mean, and the practical consequence for a buyer has reversed: the level where support would first be tested is no longer 40 percent away but 2.6 percent, at $0.004655, with $0.003331 the next line below.
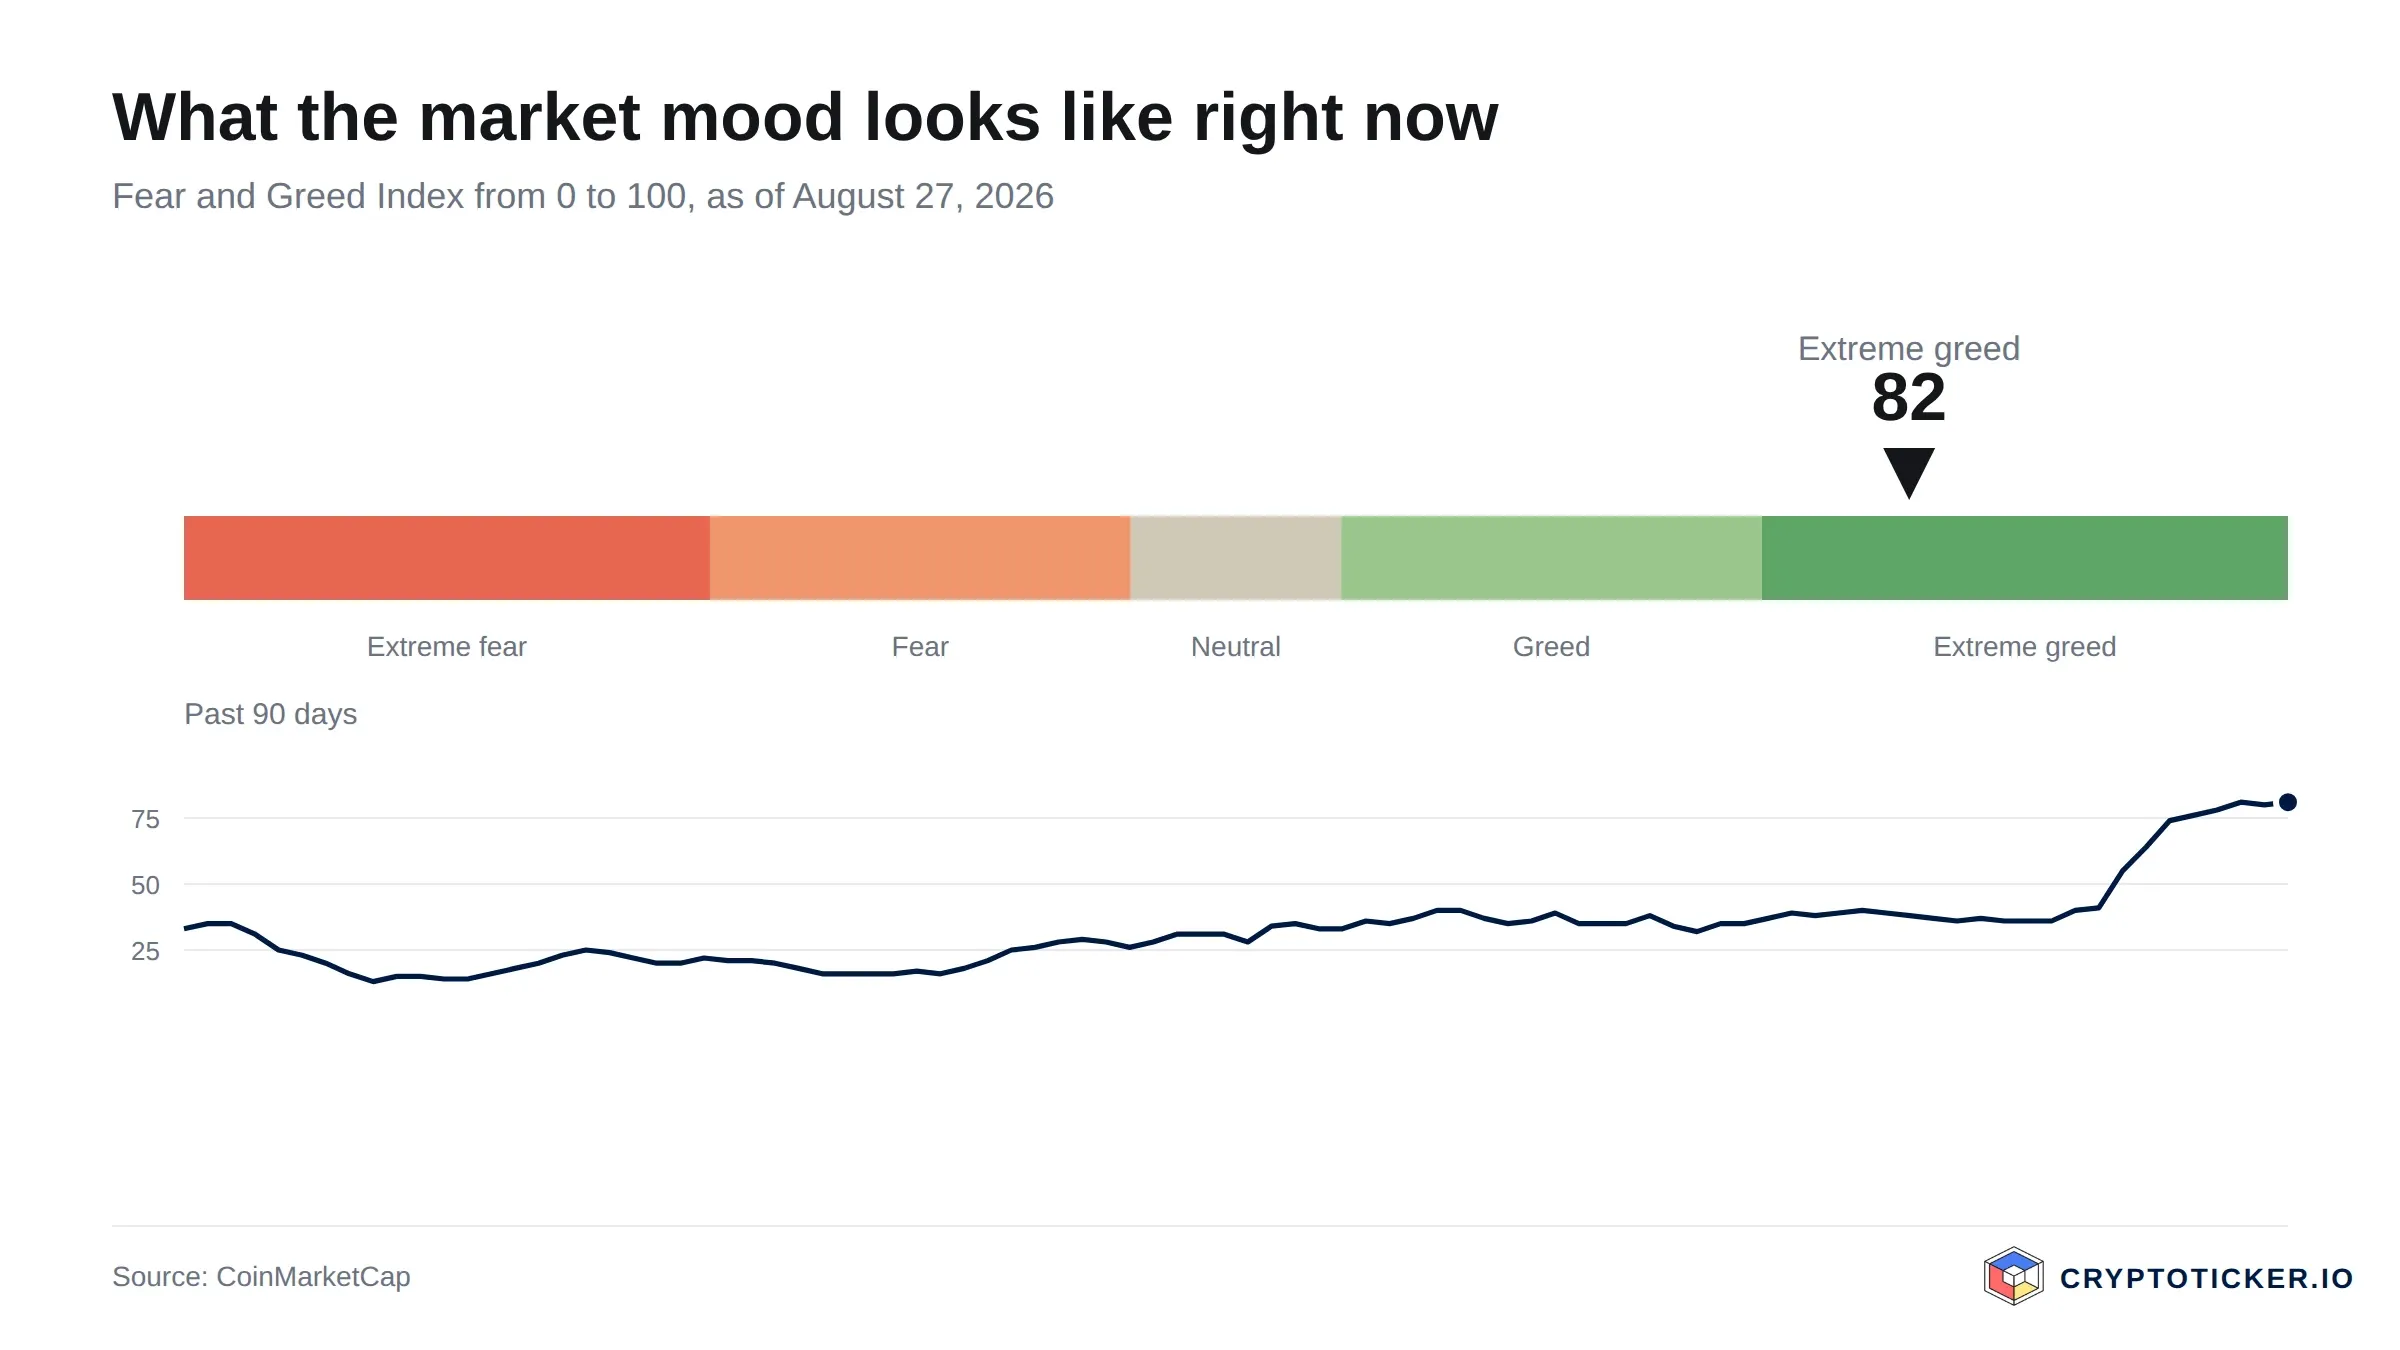
Broader sentiment points the same way. The Fear and Greed reading stood at 63 on 21 October 2026, in the greed band, after 80 and extreme greed at the last update. Positioning has cooled without turning to fear. The longer-dated view sits in our Pump.fun price prediction.
What trading volume reveals about Pump.fun demand
Turnover in PUMP amounts to about 189 million dollars over 24 hours, against a market capitalisation of roughly 2.21 billion dollars. Close to 8.6 percent of the float trading in a single day is still high in absolute terms and typical for this segment.
The trend in volume matters more than the level. Average daily turnover over the past 30 days sits near 271 million dollars, while the 90-day average is about 203 million. Activity has contracted faster than the price: current turnover runs 30 percent below the monthly average and 7 percent below the quarterly one. Advances on shrinking volume are the ones that tend to fail, and this advance is no longer being carried by expanding trade.
One detail argues against panic. The price has fallen about a quarter since the October high, and turnover has held close to its 90-day average rather than collapsing with it. Falling prices on evaporating volume are the harder signal; buyers at lower levels are still present here.
Which structural factors speak for Pump.fun: supply mechanics, usage and regulation
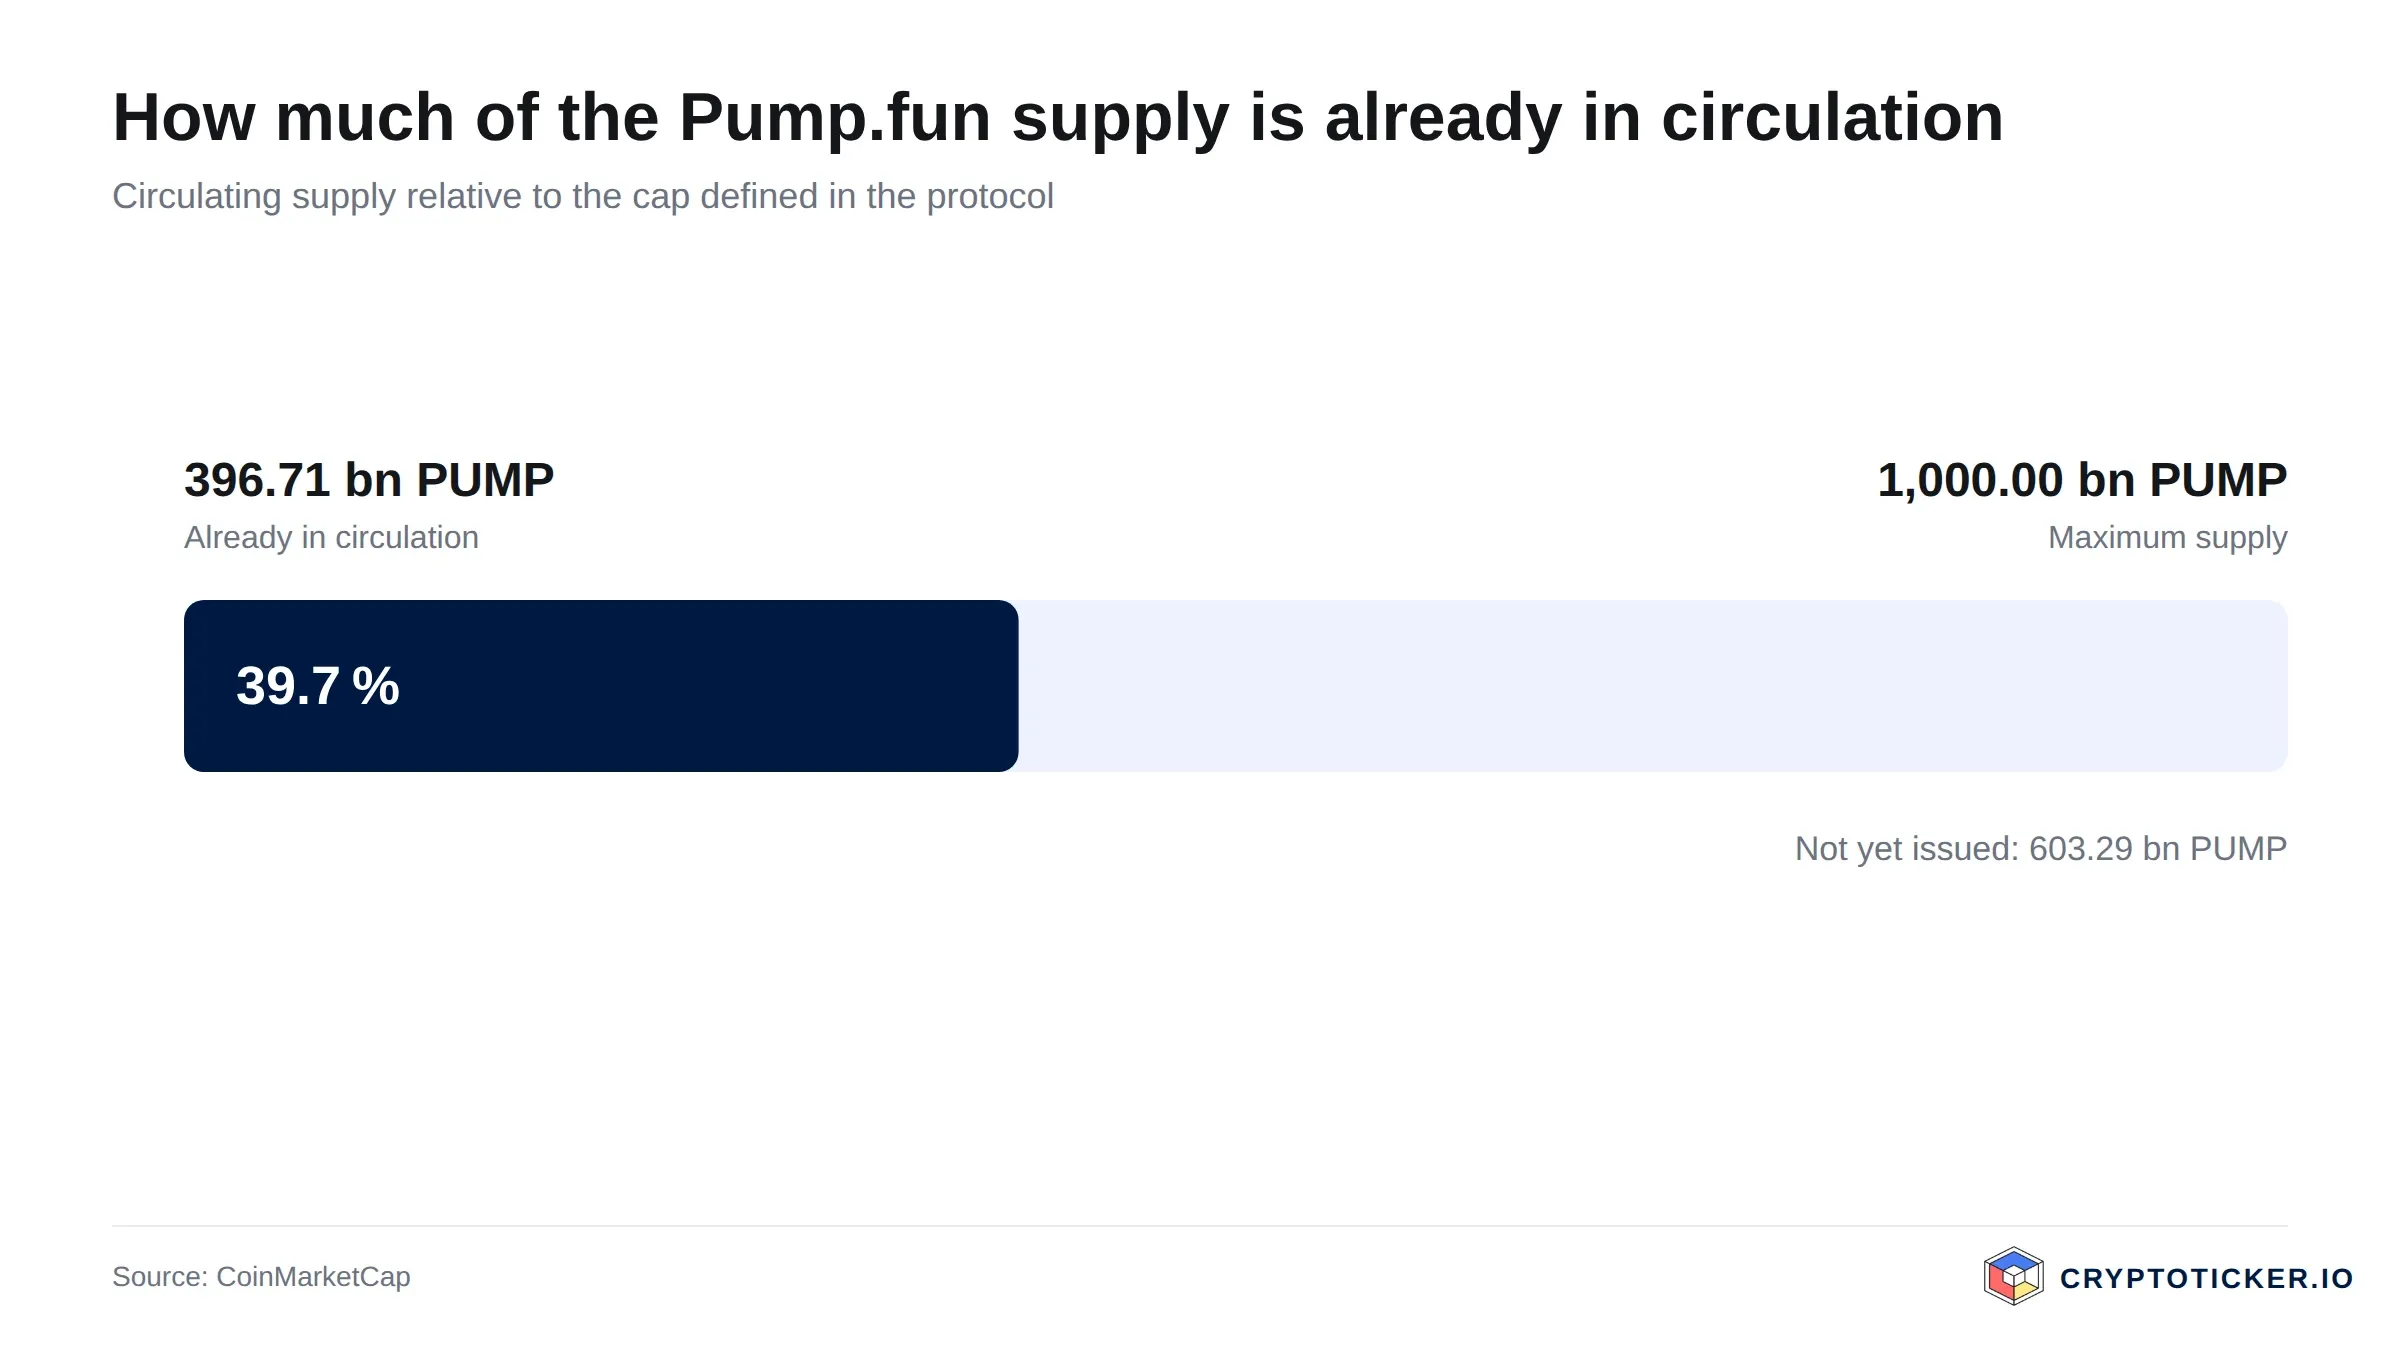
Supply is the first structural fact, and it cuts both ways. Of a maximum supply of 1,000,000,000,000 tokens, about 461,894,027,046 circulate today, close to 46 percent. That is roughly 65 billion tokens more than at the last update, while the price stands about where it stood then. Every market capitalisation figure quoted for PUMP therefore describes a minority of the eventual float, and the tokens still outside circulation are a supply overhang that a rising price does nothing to remove.
Usage is the second. Pump.fun operates as a token launch platform on Solana, and its revenue comes from fees charged on token creation and on trading activity across the platform. That gives the token an anchor that pure memecoins lack: platform activity is measurable, and it rises and falls with speculative appetite across the Solana ecosystem. It also makes PUMP a leveraged expression of that appetite rather than an independent one. The infrastructure it depends on is documented in the Solana developer documentation.
Regulation is the third. In the European Union, crypto asset service providers operate under the MiCA framework, and the classification of platform tokens carrying fee-linked value remains an area of active supervisory attention. The European Securities and Markets Authority publishes its guidance for the sector, and anyone building a position of size should follow that work rather than assume the status quo persists.
What speaks for buying PUMP at current prices
The first argument is trend structure. Price sits above both the 200-day average at $0.003331 and the 50-day average at $0.004655, with the shorter line above the longer one. That held through the October decline, so buyers who work with trend confirmation rather than with bottom fishing still have their signal.
The second is that the premium is gone. The RSI has fallen from 70.2 to 47.9 and sentiment from 80 to 63, so the same exposure now costs 2.6 percent above the 50-day line instead of 68 percent.
The third is the distance to the record. At $0.004774 the token remains about 26.8 percent below its twelve-month high of $0.006518. For anyone who accepts the platform's revenue model as durable, that gap is the part of the case that has not yet been closed by the rally.
 Find a crypto exchange with an EU licence
What speaks against buying Pump.fun at current prices
The first counterargument is how little room is left below. Buying at $0.004774 means sitting 2.6 percent above the 50-day average, so a single weak session puts the price under the line that currently defines the recovery. Over seven days the token is down 4.8 percent, and the direction of the past two weeks has been down, not sideways.
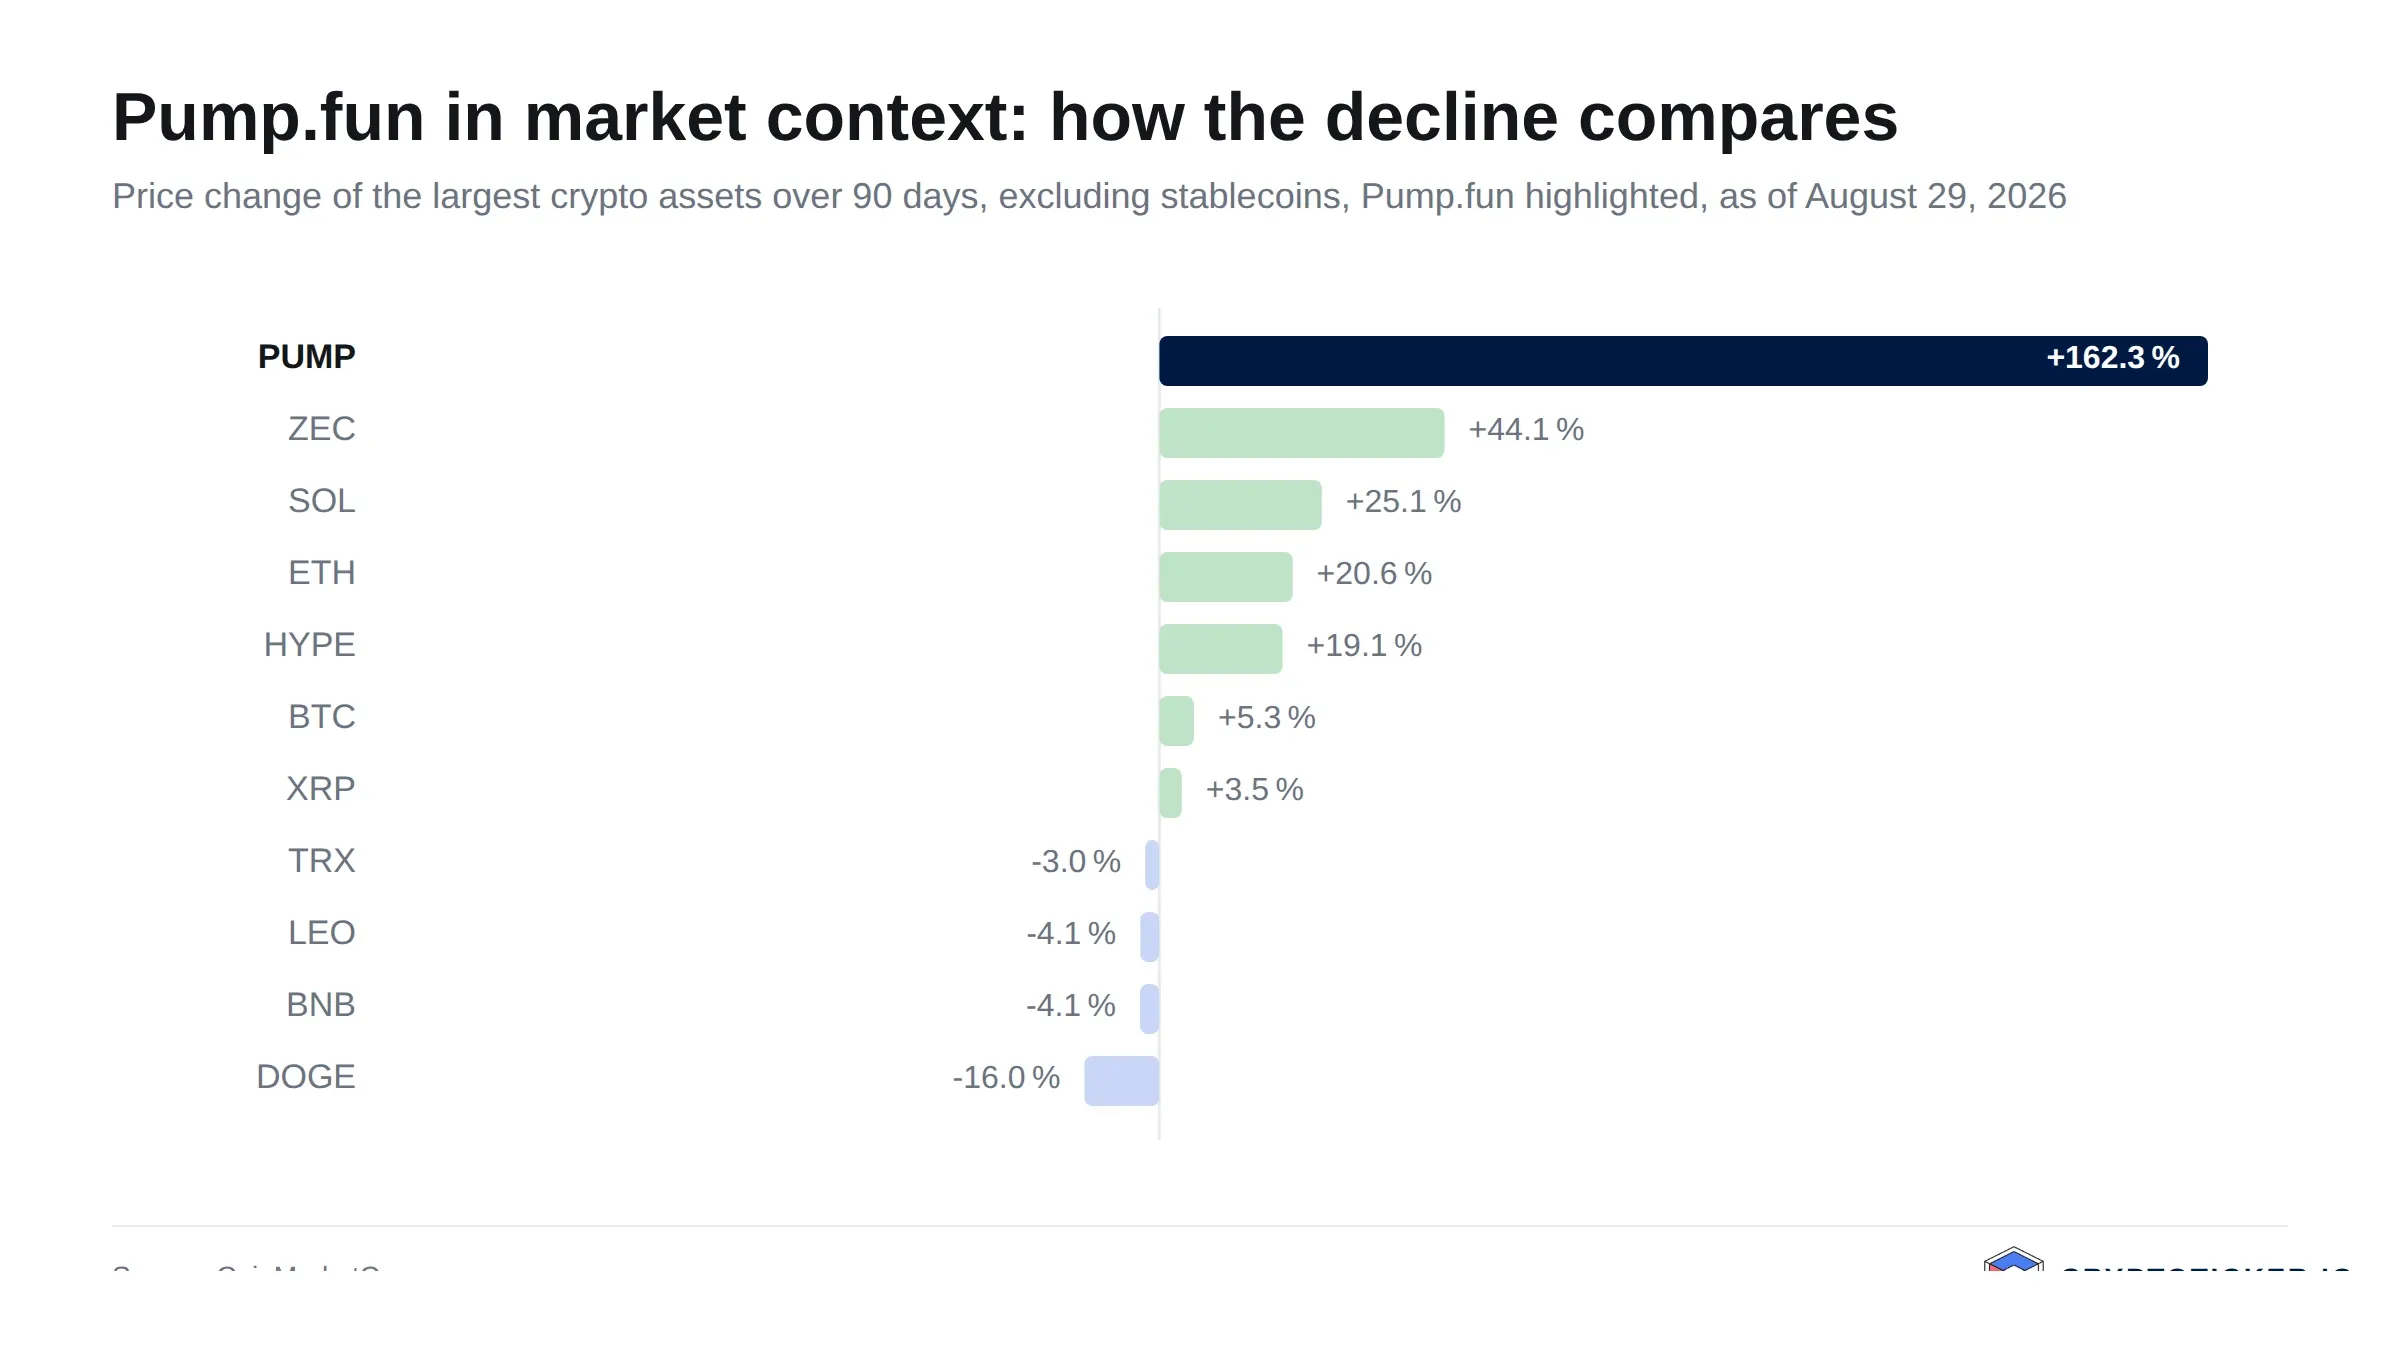
The second is the supply overhang. With around 461,894,027,046 of 1,000,000,000,000 tokens in circulation, roughly 54 percent of the eventual supply has yet to reach the market, and about 65 billion tokens have entered it since the last update without the price advancing. Tokens that enter circulation later meet whatever demand exists at that moment, and schedules of this kind have repeatedly capped recoveries in comparable assets.
The third is the thinness of the record. The price history covers a single cycle, from the July 2025 launch through the September 2025 high, the June 2026 low of $0.001199, the recovery into October and the current decline. There is no second cycle against which to test how platform revenue behaves when speculative activity contracts for a prolonged period, and the concentration of that revenue in one ecosystem is a risk no chart displays.
How to buy Pump.fun (PUMP) at the current price: costs, custody and providers
PUMP is listed on a smaller set of venues than the large caps, so the first practical step is checking availability rather than fees. Where the token is offered, the cost consists of the trading fee, typically between 0.1 and 1.5 percent depending on venue and order type, and the spread, which in less liquid pairs frequently exceeds the visible fee. Limit orders are the standard defence against the second cost. Our exchange comparison sets the fee models side by side, and the reports on Kraken and Bitvavo cover deposit routes and account requirements.
Custody is the second decision. Positions held for months belong in wallets whose keys the holder controls, and the options are compared in our hardware wallet comparison. Leaving the token on the venue substitutes counterparty risk for key-management risk. For derivative exposure, our comparison of perpetual DEX platforms is the relevant reference.
Position sizing is the third. A token that has gained 150 percent in ninety days, given back a quarter of that in two weeks and lost 86 percent in the nine months before belongs, if at all, in the part of a portfolio whose complete loss would not change the plan.
Is Pump.fun a good buy at current prices, short term and long term
Update of 13 November 2026: this assessment reflects the situation as of 21 October 2026. The first test has been triggered: since 22 October PUMP has closed below the 50-day average of $0.004655 at the time, most recently at $0.003482; the twelve-month low of $0.001199, however, has not been retested. The current assessment is in the section “As of 13 November 2026” at the top of the article.
Short term, the reasoning has turned. The last update described a strong trend at a stretched price and named the 50-day average as the nearest reference for a failed continuation. The price has now arrived there: at $0.004774 it stands 2.6 percent above that line at $0.004655, with an RSI of 47.9 and sentiment at 63. The question is no longer whether the entry is too expensive but whether this line holds.
Long term, the case rests on a question no chart answers: whether fee revenue from token launches on Solana proves durable across a full cycle rather than only in a phase of high speculative activity. If it does, the 26.8 percent discount to the twelve-month high of $0.006518 is the relevant framing. If it does not, the June low of $0.001199 shows what this token does when that activity dries up.
This is an assessment, not a recommendation, and it can be falsified. The constructive reading would be wrong if the price closed back below the 50-day average at $0.004655 and then below the 200-day average at $0.003331, or if further supply entering circulation coincided with a persistent decline in platform activity. The cautious reading would be wrong if the token consolidated above the $0.004655 line for several weeks while daily turnover returned above its 30-day average of 271 million dollars.
Buying Pump.fun (PUMP): What to Take Away
- At $0.004774 the token trades 2.6 percent above its 50-day average and about 26.8 percent below its twelve-month high of $0.006518, so the decision now sits at a line rather than at a premium. The longer-dated view sits in our Pump.fun price prediction.
- The supply schedule matters more than the chart: roughly 54 percent of the maximum supply has yet to circulate, which is the structural difference between this token and the large caps examined in our analysis of whether Bitcoin is a good buy at current prices.
- PUMP is a leveraged expression of speculative activity on Solana, so the ecosystem view belongs with the token view, as set out in our assessment of whether Solana is a good buy at current prices.
Disclosure: Some of the providers mentioned in this article work with us through partner programmes. This has no influence on the price analysis or on the assessment of the chart situation; the price data comes from a public market data source and can be verified there.
(As of 13 November 2026; analysis as of 21 October 2026. This article is not investment advice. Prices, fees and terms change; check them with the provider before every purchase. Crypto assets are subject to high price volatility and a total loss is possible.)
Partner links: some links on this page are partner links. If you become a customer through one of them, we may earn a commission at no extra cost to you. Selection, ratings and ranking are decided independently by our editorial team. Ethics and Independence · Ownership and Funding
Transparency note: This article was produced with the assistance of artificial intelligence and reviewed by our editorial team before publication. All figures and claims were checked against the primary sources linked in the text. The feature image was generated with AI.
For later? Save this article and find it again in your profile.
Related articles
- Is Jupiter a Good Buy at Current Prices?
- Ethereum Price Crashes Below $2,000: How Low Can ETH Go?
- Will Bitcoin Go Back Up? Three Scenarios to Year-End: $70,000, $80,000 or $100,000
- Is Aerodrome Finance a Good Buy at Current Prices?
- Solana Price Below $95: Record ETF Outflows and Whale Selling Push SOL to a 7-Month Low
Which topics should we dive deeper into?
Select what genuinely interests you. Your picks feed directly into our editorial planning.
Crypto news that's actually worth your time.
Weekly. 60 seconds. Carefully curated by our editors: no hype, no promo flood, no spam.

November 3, 2026 8:59 AM
Ethereum Price Below $2,300: Is $2,000 Next or Is This the Bottom?
Ethereum price slips toward $2,250 as $3 billion leaves DeFi. Whales are buying the dip. Does ETH hold $2,200 or test $2,000 next?

October 28, 2026 6:40 AM
Is Morpho a Good Buy at Current Prices?
Morpho trades around a quarter below its twelve-month high while still holding above its long-term average. What argues for and against buying into the DeFi lending token at this level.
October 27, 2026 11:25 PM

Is Arbitrum a Good Buy at Current Prices?
Arbitrum sits well below its twelve-month high and above its long-term average. We check what argues for and against buying ARB at this level, and which condition would prove the recovery wrong.
October 27, 2026 7:27 AM

Is Venice Token a Good Buy at Current Prices?
Venice Token has multiplied within twelve months and has been correcting since its September high. We check the chart, the supply and the risks of VVV against the question of whether the token is a good buy at the current price.
October 26, 2026 11:22 PM

Is Sky a Good Buy at Current Prices?
Sky is the renamed MakerDAO, and its governance token is tied to the earnings of a lending protocol with its own stablecoin. Is SKY a good buy at current prices? We weigh the chart position, the savings rate, supply mechanics and the open question of European regulation.
October 21, 2026 12:33 AM
Is Worldcoin a Good Buy at Current Prices?
As of November 11, 2026: Worldcoin has fallen below both moving averages and the marks of the October analysis, while the twelve-month low holds. What chart, supply and World ID now mean for buying WLD.
October 10, 2026 10:44 AM
Top 3 Coins to Watch Next Week: These Altcoins Could Explode
Twelve of the top 17 coins closed the week in the red. These three didn't. Here are the altcoins to watch next week and the catalysts behind them.
October 9, 2026 1:06 PM

Ethereum Price Under $2,500: Is ETH a Good Buy Right Now?
Ethereum has slipped below $2,500 and the question in every chat group is the same: buy the dip, or stay out? Here is what is driving the price, what the near-term levels are, and what the long-term forecasts actually assume.
October 7, 2026 8:42 PM
Can XRP Price Reach $10? Here Is What the Math Says
XRP trades near $1.42 after losing $1.50. We check the $10 forecasts, the charts and the market cap math to see if XRP can really reach $10.
October 3, 2026 11:01 AM

XRP Price Prediction: Can XRP Hit $3 Soon If the Bull Market Returns?
XRP is stuck near $1.50 in a falling wedge. Our XRP price prediction maps the path to $2, $2.75 and $3 if the crypto bull market comes back.

October 1, 2026 4:13 AM
Pump.fun (PUMP): A Sixth of All Tokens Burned, Price Up 50 Percent in a Week
Pump.fun has now destroyed almost 17 percent of its maximum supply, and the PUMP price rose by half in seven days. On top of that came a clarification from the US Securities and Exchange Commission on buyback programs that frees up less than many headlines claim. Here are the week's figures, the levels and what investors in Germany should check.
September 28, 2026 9:47 AM
XRP Price Drops Below $1.50: Where Is Ripple Heading This Week?
XRP price slips under $1.50 after a red weekend. Here is the XRP price analysis with the higher and lower targets that matter this week.
September 28, 2026 4:28 AM

Is Quant a Good Buy at the Current Price?
As of 13 November 2026: Quant has broken below its October low of 182 dollars and trades below its 50-day average, but well above its 200-day line. We check with our own price data what that means for buying at the current price.
September 20, 2026 9:21 AM

Is Ethena a Good Buy at Current Prices?
As of November 11, 2026: Ethena has fallen below both moving averages, while the zone around $0.13 to $0.14 holds. Is ENA a good buy at current prices? We examine chart, supply and the revenue question.

September 1, 2026 11:14 AM
XRP Price Falls 8% in a Week: Is This Dip Actually Worth Buying?
XRP gave back 8% this week after a violent August melt-up. Here is what really drove that rally, what the chart says now, and what buying here depends on.
August 31, 2026 11:20 PM
Is Mantle a Good Buy at Current Prices?
As of November 11, 2026: Mantle has fallen below both moving averages, while the twelve-month low still holds. We check with our own price data what chart, supply and liquidity mean for buying now.
August 27, 2026 6:38 AM
Is NEAR Protocol a Good Buy at Current Prices?
As of 14 November 2026: NEAR has broken out of its October range to the downside and closes below its 50-day average, but above the 200-day line. We check with our own price data what that means for buying now.
August 27, 2026 6:23 AM
Is Bittensor a Good Buy at Current Prices?
As of 14 November 2026: Bittensor has closed below its October low and both moving averages since late October, putting the trend reversal in question. We check with our own price data what that means for buying.
August 27, 2026 4:31 AM

Is AAVE a Good Buy at Current Prices?
As of November 11, 2026: AAVE has slipped below its 50-day and just below its 200-day average, while the August mark still holds. We check with our own price data what that means for buying at current prices.
August 27, 2026 3:39 AM

Is Cronos a Good Buy at Current Prices?
As of November 11, 2026: Cronos has fallen below both moving averages and trades just above its twelve-month low. We check with our own calculations what speaks for and against buying.
August 27, 2026 3:24 AM
Is Hedera a Good Buy at Current Prices?
As of 14 November 2026: by our yardstick Hedera's bottoming has failed, and it is closing at its lowest level in twelve months. We check with our own price data what that means for buying at the current price.
August 27, 2026 2:21 AM
Is SUI a Good Buy at Current Prices?
SUI is holding its 200-day moving average and trades 51 percent above its twelve-month low, with the 50-day line now above the 200-day. We check whether the coin is a good buy at current prices.
August 26, 2026 4:21 AM

Is Uniswap a Good Buy at Current Prices?
As of 14 November 2026: Uniswap has left its mid-October range to the downside and is sitting on its 200-day average. We check with our own price data what that means for buying at current prices.
August 23, 2026 2:21 PM
Is Hyperliquid a Good Buy at Current Prices?
HYPE slipped below its 50-day average in October, triggering the test we set in September. What buybacks, team sales and leverage mean now: is Hyperliquid a good buy at current prices?


More from CryptoTicker