
Is Arbitrum a Good Buy at Current Prices?
Arbitrum sits well below its twelve-month high and above its long-term average. We check what argues for and against buying ARB at this level, and which condition would prove the recovery wrong.





Which topics should we dive deeper into?
Select what genuinely interests you. Your picks feed directly into our editorial planning.
Crypto news that's actually worth your time.
Weekly. 60 seconds. Carefully curated by our editors: no hype, no promo flood, no spam.
Arbitrum trades at 0.1682 US dollars. That is 49.8 percent below the twelve-month high of 0.3348 dollars, and 131.3 percent above the twelve-month low of 0.0727 dollars, reached in mid-August 2026. Between those two marks lies the question: does the token of the largest Ethereum layer-2 network deserve a place in a portfolio at this price?
The figures below come from our own calculations on the daily closing prices of CoinMarketCap, as of 27 October 2026.
Arbitrum price analysis: where the ARB price stands and which levels matter
At 0.1682 dollars, Arbitrum carries a market capitalisation of about 1.16 billion dollars and ranks 57th among all crypto assets. For a network that settles a large share of all Ethereum layer-2 activity that is a modest valuation: usage ranking and market ranking have drifted apart.
Three levels frame the picture. The 200-day average sits at 0.1430 dollars and currently acts as the floor of the range; the price has held above it since the summer recovery. The 50-day average sits at 0.1758 dollars and acts as the ceiling; the price slipped below it during October. Between 0.1430 and 0.1758 dollars lies a corridor of roughly 23 percent, and Arbitrum has spent the past weeks inside it.
The medium-term direction depends on which edge gives way first. A sustained move above 0.1758 dollars would put the September zone around 0.22 dollars back in play. A close below 0.1430 dollars would remove the only technical support the past three months have built, and the next reference point underneath is the August low of 0.0727 dollars.
The shorter time frames show how uneven the year has been. Over seven days the price has lost 12.26 percent, over thirty days 25.61 percent. Over ninety days, however, Arbitrum is up 114.53 percent, and over twelve months it is down 49.8 percent. Any reading of the trend depends on the window chosen, which is why the averages matter more than any single percentage. Our Arbitrum price prediction works through the longer-dated scenarios.
Is the Arbitrum downtrend broken or only interrupted?
A downtrend is broken when a market stops making lower lows and starts defending a higher one. Arbitrum has done the first part. The August low of 0.0727 dollars ended a decline that ran for most of the first half of 2026, and the recovery that followed more than doubled the price within ninety days. The 200-day average at 0.1430 dollars has since turned from resistance into support, the classic mechanical signature of a trend change.
The second part is missing. Since late September the price has made lower highs again, and the 25.61 percent loss over thirty days has pushed it back under the 50-day average. What this leaves is a stalled recovery rather than a resumed downtrend: the structure above 0.1430 dollars holds, while the momentum that built it has gone.
The honest reading is an interruption rather than a break in either direction. The case rests on one level, 0.1430 dollars, and single-level arguments fail often. The assumption is falsified once weekly closes settle underneath it, not when the price dips through it during one volatile session.
 Compare the best crypto exchanges
What RSI and moving averages mean for an Arbitrum entry
The relative strength index over fourteen days stands at 42.1: the lower half of the neutral band, below the midpoint of 50 and well clear of the oversold threshold of 30. For an entry decision this is the least dramatic reading possible: there is no momentum extreme to lean on in either direction.
The constellation of the two averages says more. With the price at 0.1682 dollars, 17.6 percent above the 200-day average of 0.1430 dollars and 4.3 percent below the 50-day average of 0.1758 dollars, Arbitrum sits in the middle of its own range. The long-term average rising underneath the price is the constructive part; the short-term average above it argues for patience, because a market that cannot reclaim its 50-day line usually needs a fresh reason first.
For position sizing this matters more than any forecast. An entry at 0.1682 dollars carries roughly 15 percent of downside to the 200-day average before the technical case changes, and about 4 percent of upside before the first real resistance. Staggered buying across that corridor expresses the same view with less timing exposure.
What Arbitrum trading volume reveals about demand
Arbitrum turned over about 99 million dollars in the past 24 hours, against a thirty-day average of roughly 190 million dollars. Current activity is running at little more than half the recent norm. Measured against the market capitalisation of 1.16 billion dollars, daily turnover amounts to 8.54 percent.
The direction of the change is the informative part. Falling volume into a falling price is a different signal from falling volume into a rising one. Here the price has lost a quarter of its value over thirty days while turnover has thinned, which suggests an absence of buyers rather than a wave of sellers. Markets that drift down on light volume usually need a catalyst to turn.
Positions in the low five figures can therefore be opened and closed on a major exchange without moving the price, while larger ones need limit orders and patience. Our crypto exchange comparison lists where ARB order books are deepest.
Structural factors that speak for Arbitrum
Three structural features define the investment case, and the first is technical. Arbitrum One is an optimistic rollup: it executes transactions on its own network and posts the compressed results back to Ethereum, which keeps the security assumptions of the main chain while cutting costs sharply. The Arbitrum documentation sets out the Nitro architecture. Ethereum's own roadmap is explicitly built around rollups doing this work, which places Arbitrum inside the plan rather than alongside it.
The second is supply mechanics, and it cuts both ways. Maximum supply is 10 billion ARB and about 6.89 billion are in circulation, so roughly 31 percent of the total has yet to enter the market through DAO treasury allocations and scheduled unlocks. That is a real overhang, though the dilution has a known end point rather than an open-ended emission schedule.
The third is governance and regulation. ARB is the governance token of the Arbitrum DAO, which controls a large treasury and the parameters of the network and its Orbit chains. In the European Union the token trades on venues operating under the MiCA regime, which has given regulated exchanges a clear basis for listing it. The overview of regulated exchanges shows which venues hold the relevant permissions.
Three arguments for buying Arbitrum at current prices
First, the valuation relative to usage. A market capitalisation of 1.16 billion dollars and rank 57 price Arbitrum as a mid-cap token, while the network processes activity associated with far larger valuations. If the market ever prices layer-2 networks on throughput rather than narrative, the gap closes upward.
Second, the technical floor. The price is 17.6 percent above a rising 200-day average at 0.1430 dollars, and that average has absorbed every pullback since August. A buyer at 0.1682 dollars has a defined and nearby level at which the thesis can be judged wrong, a materially better position than buying into open space.
Third, the distance to the old high. At 49.8 percent below 0.3348 dollars, Arbitrum has given back half of a twelve-month range without losing its position in the Ethereum scaling landscape. Recovery to that high would be a doubling, and the 114.53 percent gain over ninety days shows moves of that size remain within this token's normal behaviour.
 Compare the best hardware wallets
Three arguments against buying Arbitrum at current prices
First, the unlock overhang. With about 3.1 billion of 10 billion ARB still outside circulation, the supply side has a known source of new selling for years. Tokens in that position have repeatedly underperformed during recoveries, because every rally meets scheduled supply.
Second, the token captures no network fees. Transactions on Arbitrum are paid for in ETH, not in ARB, so growth in network usage does not translate mechanically into demand for the token. ARB confers governance rights over a treasury and a parameter set, a real asset but a weaker link between adoption and price than fee-paying tokens have. It is the most important point to grasp before treating network statistics as a price argument.
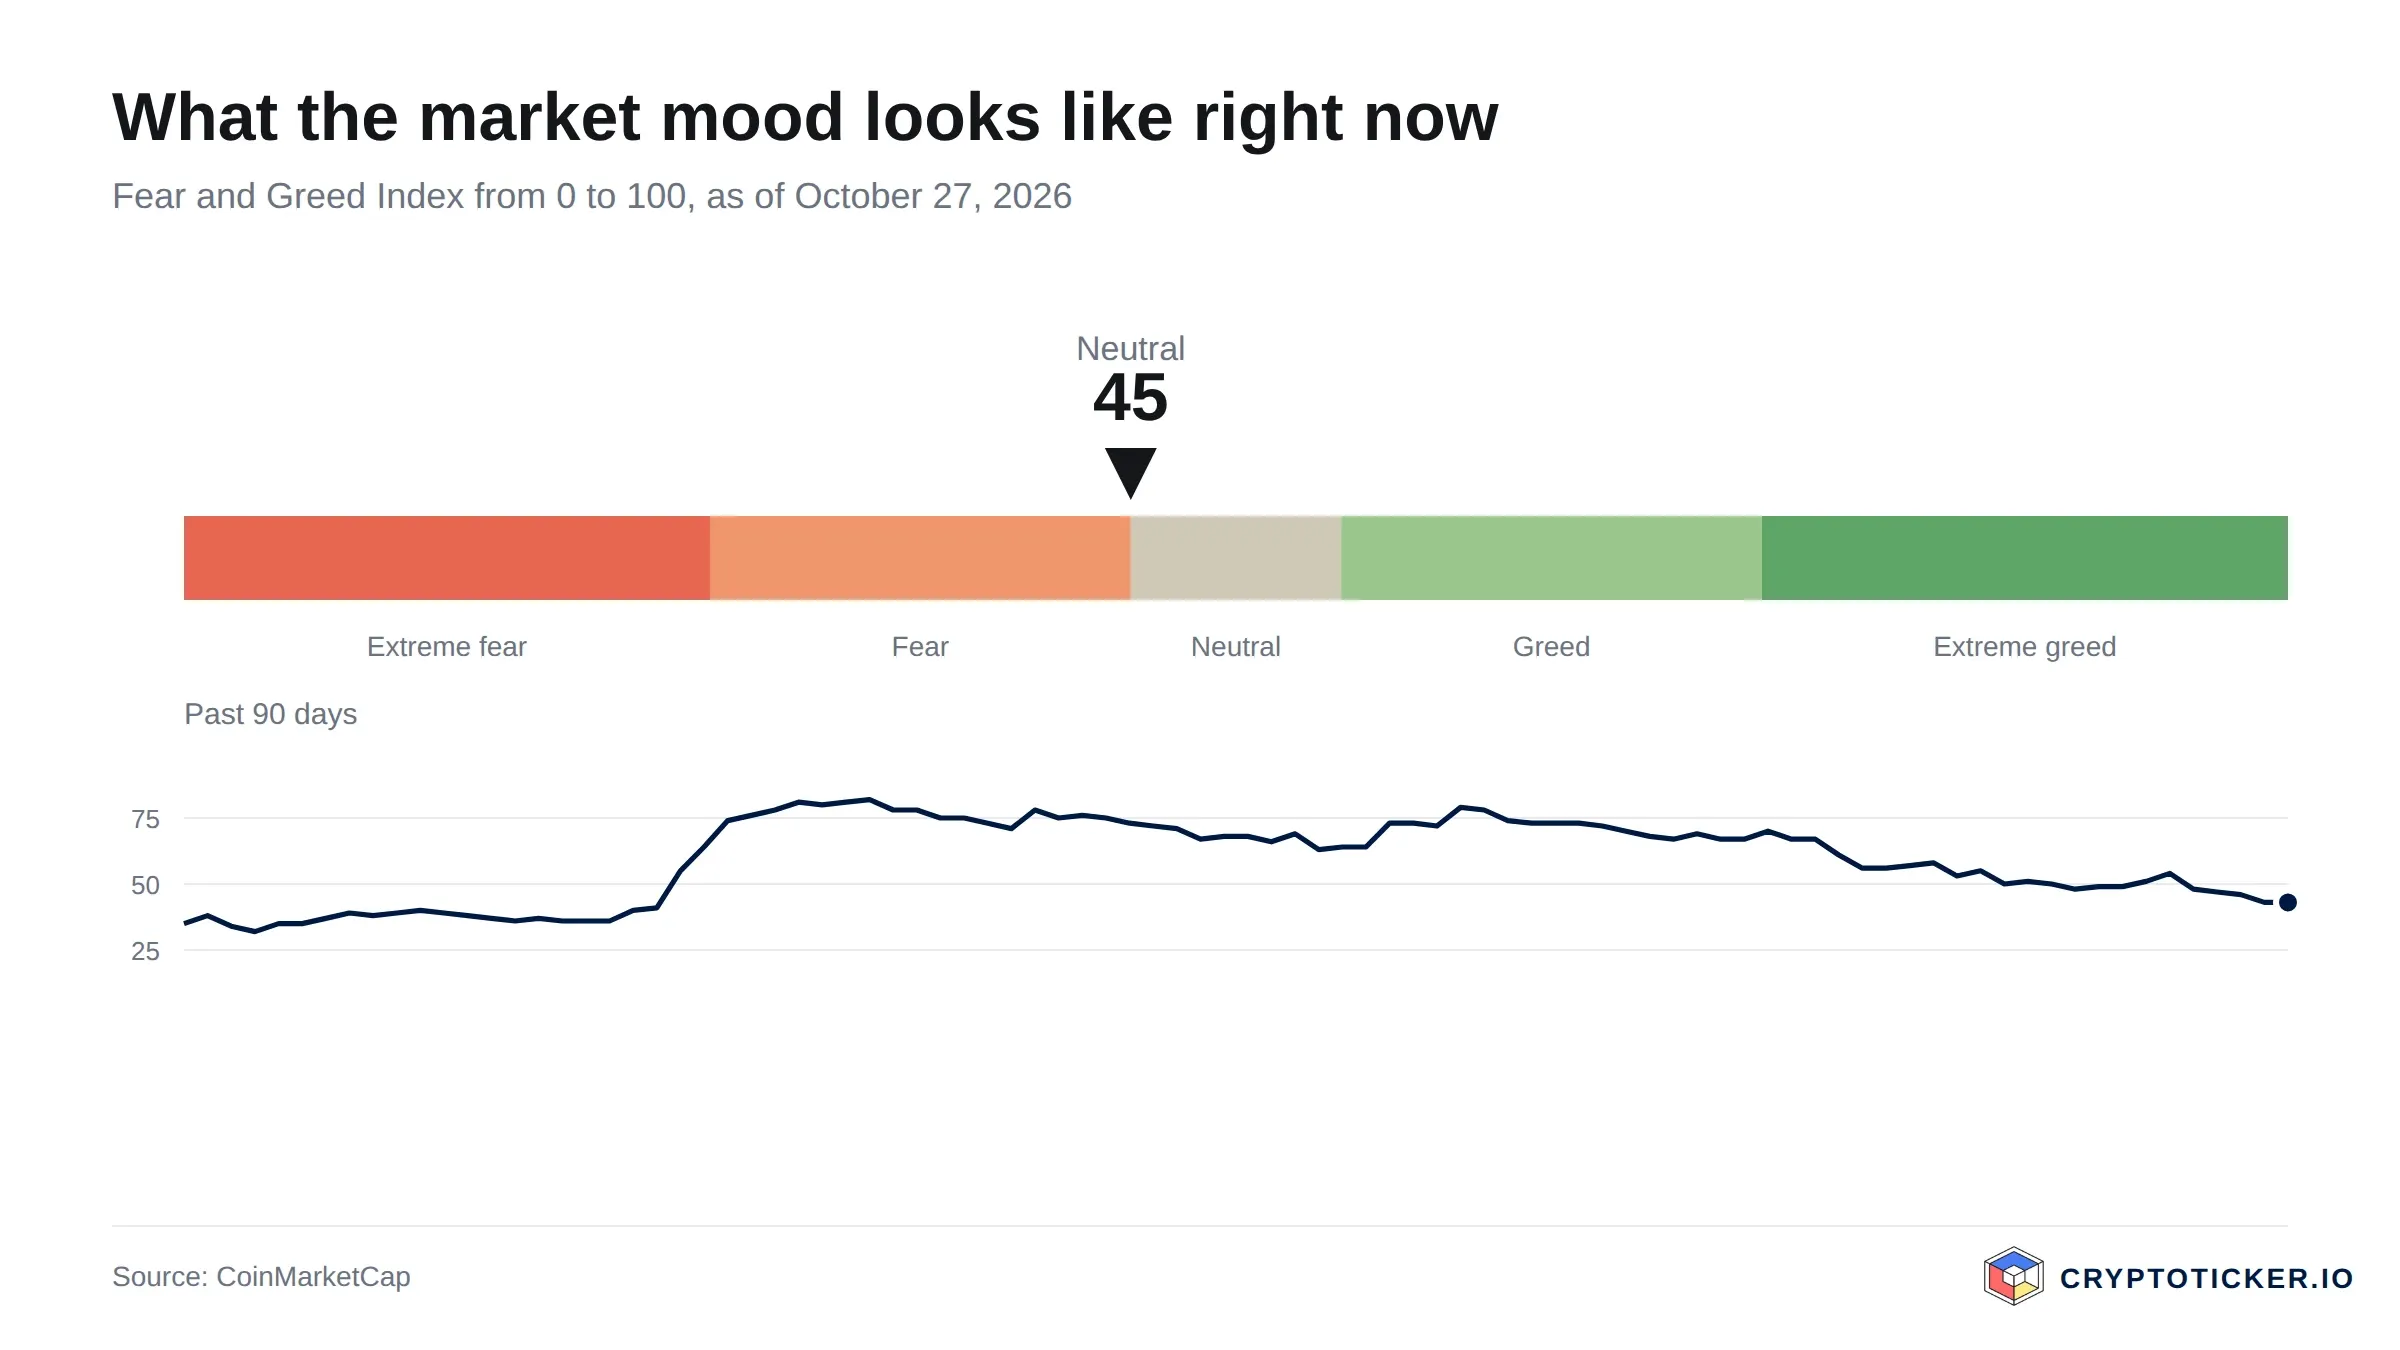
Third, the momentum has turned. A loss of 25.61 percent over thirty days, a price below the 50-day average of 0.1758 dollars, a relative strength index of 42.1 and daily turnover at roughly half its thirty-day average describe a market without buyers rather than one in demand. The wider market reading is neutral at best; the fear and greed index stands at 45.
Buying Arbitrum in Europe: costs, custody and providers
ARB is listed on all the large regulated venues, so the choice is usually decided by fees and custody rather than availability. Spot trading fees at major European exchanges run between roughly 0.1 and 0.5 percent per order depending on venue and volume tier, and instant-buy interfaces cost considerably more than the order book of the same provider. A one percent difference in execution cost is not decisive on its own, but it compounds for anyone buying in instalments.
Custody is the decision with the longer consequences. Leaving ARB on an exchange exposes the holding to that venue's solvency and security; self-custody removes that exposure and adds the obligation to secure a seed phrase properly. The hardware wallet comparison sets out the trade-offs between the common devices, and the Kraken review describes the fee tiers and withdrawal process of one venue where ARB order books are deep. One practical note: ARB exists both on Ethereum and on Arbitrum One, and withdrawing to the wrong network is the most common and most expensive mistake with this token.
So is Arbitrum a good buy at current prices?
For the short term the answer the data supports is no, or at least not yet. The price sits below its 50-day average, momentum has been negative for a month, turnover has halved against its recent norm, and the relative strength index at 42.1 offers no oversold signal to buy against. The short-term case would change if the price reclaimed 0.1758 dollars on rising volume, and it would be clearly wrong if weekly closes slipped under 0.1430 dollars.
For the long term the picture is more favourable, with one condition attached. Arbitrum occupies a structurally important position in the way Ethereum intends to scale, it trades 49.8 percent below its twelve-month high, and it holds above a rising long-term average. The condition is the token's weak link to network revenue: an investor buying ARB is buying governance over a treasury and exposure to a narrative, not a claim on transaction fees. Whoever accepts that as sufficient has a defensible long-term position at 0.1682 dollars. Whoever does not should recognise that network growth alone will not fix it, and that the 31 percent of supply still to unlock works against the price meanwhile.
Neither reading is a recommendation. Both are testable: the short-term thesis fails at 0.1430 dollars, the long-term one fails if a competing scaling approach takes Arbitrum's activity and the token's governance value falls with it.
Buying Arbitrum: Your next three steps
- Compare the range before the price. Note 0.1430 dollars as the lower edge and 0.1758 dollars as the upper edge, then read the longer-dated scenarios in the Arbitrum price prediction and decide which of them you are actually buying.
- Pick the venue by fee tier and permissions, not by interface. The comparison of regulated exchanges shows which providers hold the relevant European permissions and what their spot fees are.
- Settle custody before the first order. The Kraken review covers withdrawal fees and supported networks, and the network choice between Ethereum and Arbitrum One is made at the moment of withdrawal.
Disclosure: Some of the providers mentioned in this article work with us through affiliate programmes. This has no influence on the price analysis or on the assessment of the chart situation; the price data comes from a public market data source and can be verified there.
(Last updated: 27 October 2026. This article is not investment advice. Prices, fees and terms change; check them with the provider before every purchase. Crypto assets are subject to high price volatility, and a total loss is possible.)
Frequently asked questions about Arbitrum
Transparency note: This article was produced with the assistance of artificial intelligence and reviewed by our editorial team before publication. All figures and claims were checked against the primary sources linked in the text. The feature image was generated with AI.
Related articles
Which topics should we dive deeper into?
Select what genuinely interests you. Your picks feed directly into our editorial planning.
Crypto news that's actually worth your time.
Weekly. 60 seconds. Carefully curated by our editors: no hype, no promo flood, no spam.

October 26, 2026 11:22 PM

Is Sky a Good Buy at Current Prices?
Sky is the renamed MakerDAO, and its governance token is tied to the earnings of a lending protocol with its own stablecoin. Is SKY a good buy at current prices? We weigh the chart position, the savings rate, supply mechanics and the open question of European regulation.
August 27, 2026 11:25 AM

Is Pump.fun a Good Buy at Current Prices?
PUMP now sits only just above its 50-day average and still trades below its twelve-month high. We check with our own price data what argues for and against buying Pump.fun at the current price.
August 27, 2026 6:38 AM

Is NEAR Protocol a Good Buy at Current Prices?
NEAR has nearly tripled since August, and the trend break we defined back then has happened. What ETF buying, leverage and issuance mean now: is NEAR Protocol a good buy at current prices?
August 27, 2026 6:23 AM

Is Bittensor a Good Buy at Current Prices?
Bittensor has passed the trend test we set in August: a weekly close above the 200-day average and a moving-average crossover in September. What the correction since the peak means: is Bittensor a good buy at current prices?
August 27, 2026 4:31 AM

Is AAVE a Good Buy at Current Prices?
AAVE has worked its way back above both the 200-day and the 50-day moving average, yet still trades far below its twelve-month high. Using our own price data, we examine what speaks for and against an entry at current prices.
August 27, 2026 3:39 AM

Is Cronos a Good Buy at Current Prices?
Cronos has reclaimed its 200-day line for the first time since the spring, and the RSI is back out of overbought. We weigh what speaks for and against buying CRO at the current price.
August 27, 2026 3:24 AM

Is Hedera a Good Buy at Current Prices?
Hedera met our trend-reversal test in September, then gave back the entire IBM jump. What higher lows, HashPack's stock tokens and Hitachi's exit from the council mean now: is Hedera a good buy at current prices?
August 27, 2026 2:21 AM

Is SUI a Good Buy at Current Prices?
SUI is holding its 200-day moving average and trades 51 percent above its twelve-month low, with the 50-day line now above the 200-day. We check whether the coin is a good buy at current prices.
August 26, 2026 4:21 AM

Is Uniswap a Good Buy at Current Prices?
Uniswap has gained about three quarters since August, and the trend test we set back then has been passed. What the fee switch, CME futures and the correction since September mean now: is Uniswap a good buy at current prices?
August 16, 2026 12:21 PM

Is Toncoin a Good Buy at Current Prices?
Toncoin, now traded as Gram (GRAM), has fallen back below both moving averages and the September breakout has failed. What the Telegram wallet, volume and the base mean now: is Toncoin a good buy at current prices?

May 18, 2026 1:07 PM

Is Solana a Good Buy in 2026? SOL Price Analysis and Potential ROI
Solana (SOL) trades at $101.73 after clearing the $100 resistance. Here's how SOL's potential returns stack up against BTC, ETH, and XRP.
May 13, 2026 11:02 AM

Is PEPE Coin worth Buying in 2026?
PEPE still holds both its 50 day and its 200 day average, while the past month has gone sideways and weekly turnover has picked up again. What that means for anyone buying at current prices, and the two levels that settle it.
September 28, 2026 9:47 AM
XRP Price Drops Below $1.50: Where Is Ripple Heading This Week?
XRP price slips under $1.50 after a red weekend. Here is the XRP price analysis with the higher and lower targets that matter this week.
August 23, 2026 1:16 AM

Is PEPE a Good Buy at the Current Price?
PEPE is holding the 50-day moving average and sits clearly above the 200-day line, with weekly volume picking up again. Is the memecoin a good buy at the current price, or has the rally already run?
August 31, 2026 11:20 PM

Is Mantle a Good Buy at Current Prices?
Mantle has rebounded hard from its summer low but still trades below its 200-day line, and nearly half the eventual supply has yet to reach the market. We weigh what speaks for and against buying MNT at the current price.
August 24, 2026 12:50 AM

Is Bitcoin Cash a Good Buy at Current Prices?
Bitcoin Cash has held its summer gains but the rally has stalled: the price now sits right on its 50-day line with the RSI back to neutral and turnover halved. We work through what speaks for and against buying BCH at current prices.
August 24, 2026 12:34 AM

Is Monero a Good Buy at Current Prices?
Monero broke above the level we named in September as the test for a trend change. What the breakout, an overbought RSI and EU rules mean now: is Monero a good buy at current prices?
August 24, 2026 12:19 AM

Is Zcash a Good Buy at Current Prices?
Zcash has given back part of its September advance and now sits just above its 50-day average. We look at what the trend, the RSI and the turnover actually support, and under which conditions the case for buying ZEC breaks down.
August 23, 2026 2:21 PM

Is Hyperliquid a Good Buy at Current Prices?
HYPE slipped below its 50-day average in October, triggering the test we set in September. What buybacks, team sales and leverage mean now: is Hyperliquid a good buy at current prices?
August 3, 2026 10:41 AM
Is XRP Coin a Good Buy At Current Prices?
XRP trades at $1.29 and has lost both moving averages, with the 50-day EMA dropping back below the 200-day on 18 October. Why the $1.20 shelf now decides where the recovery finds its floor.

June 30, 2025 11:21 AM

ARB Price Prediction: Huge Rally Ahead?
Arbitrum (ARB) is showing fresh signs of a breakout after weeks of sideways action. With RSI ticking up is this the turning point traders have been waiting for?

April 6, 2026 6:24 PM
Ethereum Price Analysis: ETH Consolidates Between $1,800 and $2,100, What’s Next?
Ethereum price is stuck in a tight range between $1,800 and $2,100. Analysts warn of a decisive breakout or breakdown as volatility reaches a boiling point.
February 26, 2026 4:18 PM

Cardano Price Analysis: ADA Jumps 8% as Bulls Eye $0.30 Breakout
Cardano (ADA) surges 8% to $0.29. Analysts eye the $0.30 resistance as a make-or-break point for the next major price move toward $0.35.
July 21, 2025 5:00 AM

Cardano Price Prediction: ADA Finally Wakes Up After Bitcoin ATH
Cardano has been lagging — until now. While Bitcoin topped out weeks ago, ADA is just starting to move. What’s next for the ADA price?
July 23, 2024 10:39 AM

Arbitrum News: ARB Price To Reach $3?
Exciting times for Arbitrum (ARB) as its price shows potential for growth! Market trends suggest ARB could be on track to hit the $3 mark.
More from CryptoTicker