
Is Bitcoin Cash a Good Buy at Current Prices?
Bitcoin Cash has held its summer gains but the rally has stalled: the price now sits right on its 50-day line with the RSI back to neutral and turnover halved. We work through what speaks for and against buying BCH at current prices.




Which topics should we dive deeper into?
Select what genuinely interests you. Your picks feed directly into our editorial planning.
Crypto news that's actually worth your time.
Weekly. 60 seconds. Carefully curated by our editors: no hype, no promo flood, no spam.
Bitcoin Cash trades at 275.46 US dollars on 18 October 2026. That is 57.9 percent below the twelve-month high of 654.84 dollars set on 4 January, and 44.7 percent above the twelve-month low of 190.35 dollars reached on 25 June. The summer rally that put the coin back on watchlists has since flattened out: over the past seven days the price has moved by 0.6 percent, down. The question here is narrower than the enthusiasm: is Bitcoin Cash a good buy at current prices, or has the rally already collected most of the return it had to give?
cryptoticker.io collected the underlying price data on 18 October 2026. The moving averages, the relative strength index and the twelve-month range were calculated in-house from daily closing prices over 365 days using standard formulas — exponential moving averages over 200 and 50 days, RSI over 14 periods. Every figure in this article refers to that measurement, and every figure ages from the moment it is written. Our longer-term view of the coin sits in the Bitcoin Cash price prediction.
Bitcoin Cash price analysis: where BCH stands and which levels matter
Three numbers frame the position. The current Bitcoin Cash price of 275.46 dollars sits 11.2 percent below the 200-day exponential moving average of 310.19 dollars, and 0.4 percent below the 50-day exponential moving average of 276.63 dollars. The coin has therefore given back its short-term advantage and now sits almost exactly on the shorter of its two trend lines, with the longer one still overhead. That is the profile of a market that rallied, stopped, and has not yet decided what comes next.
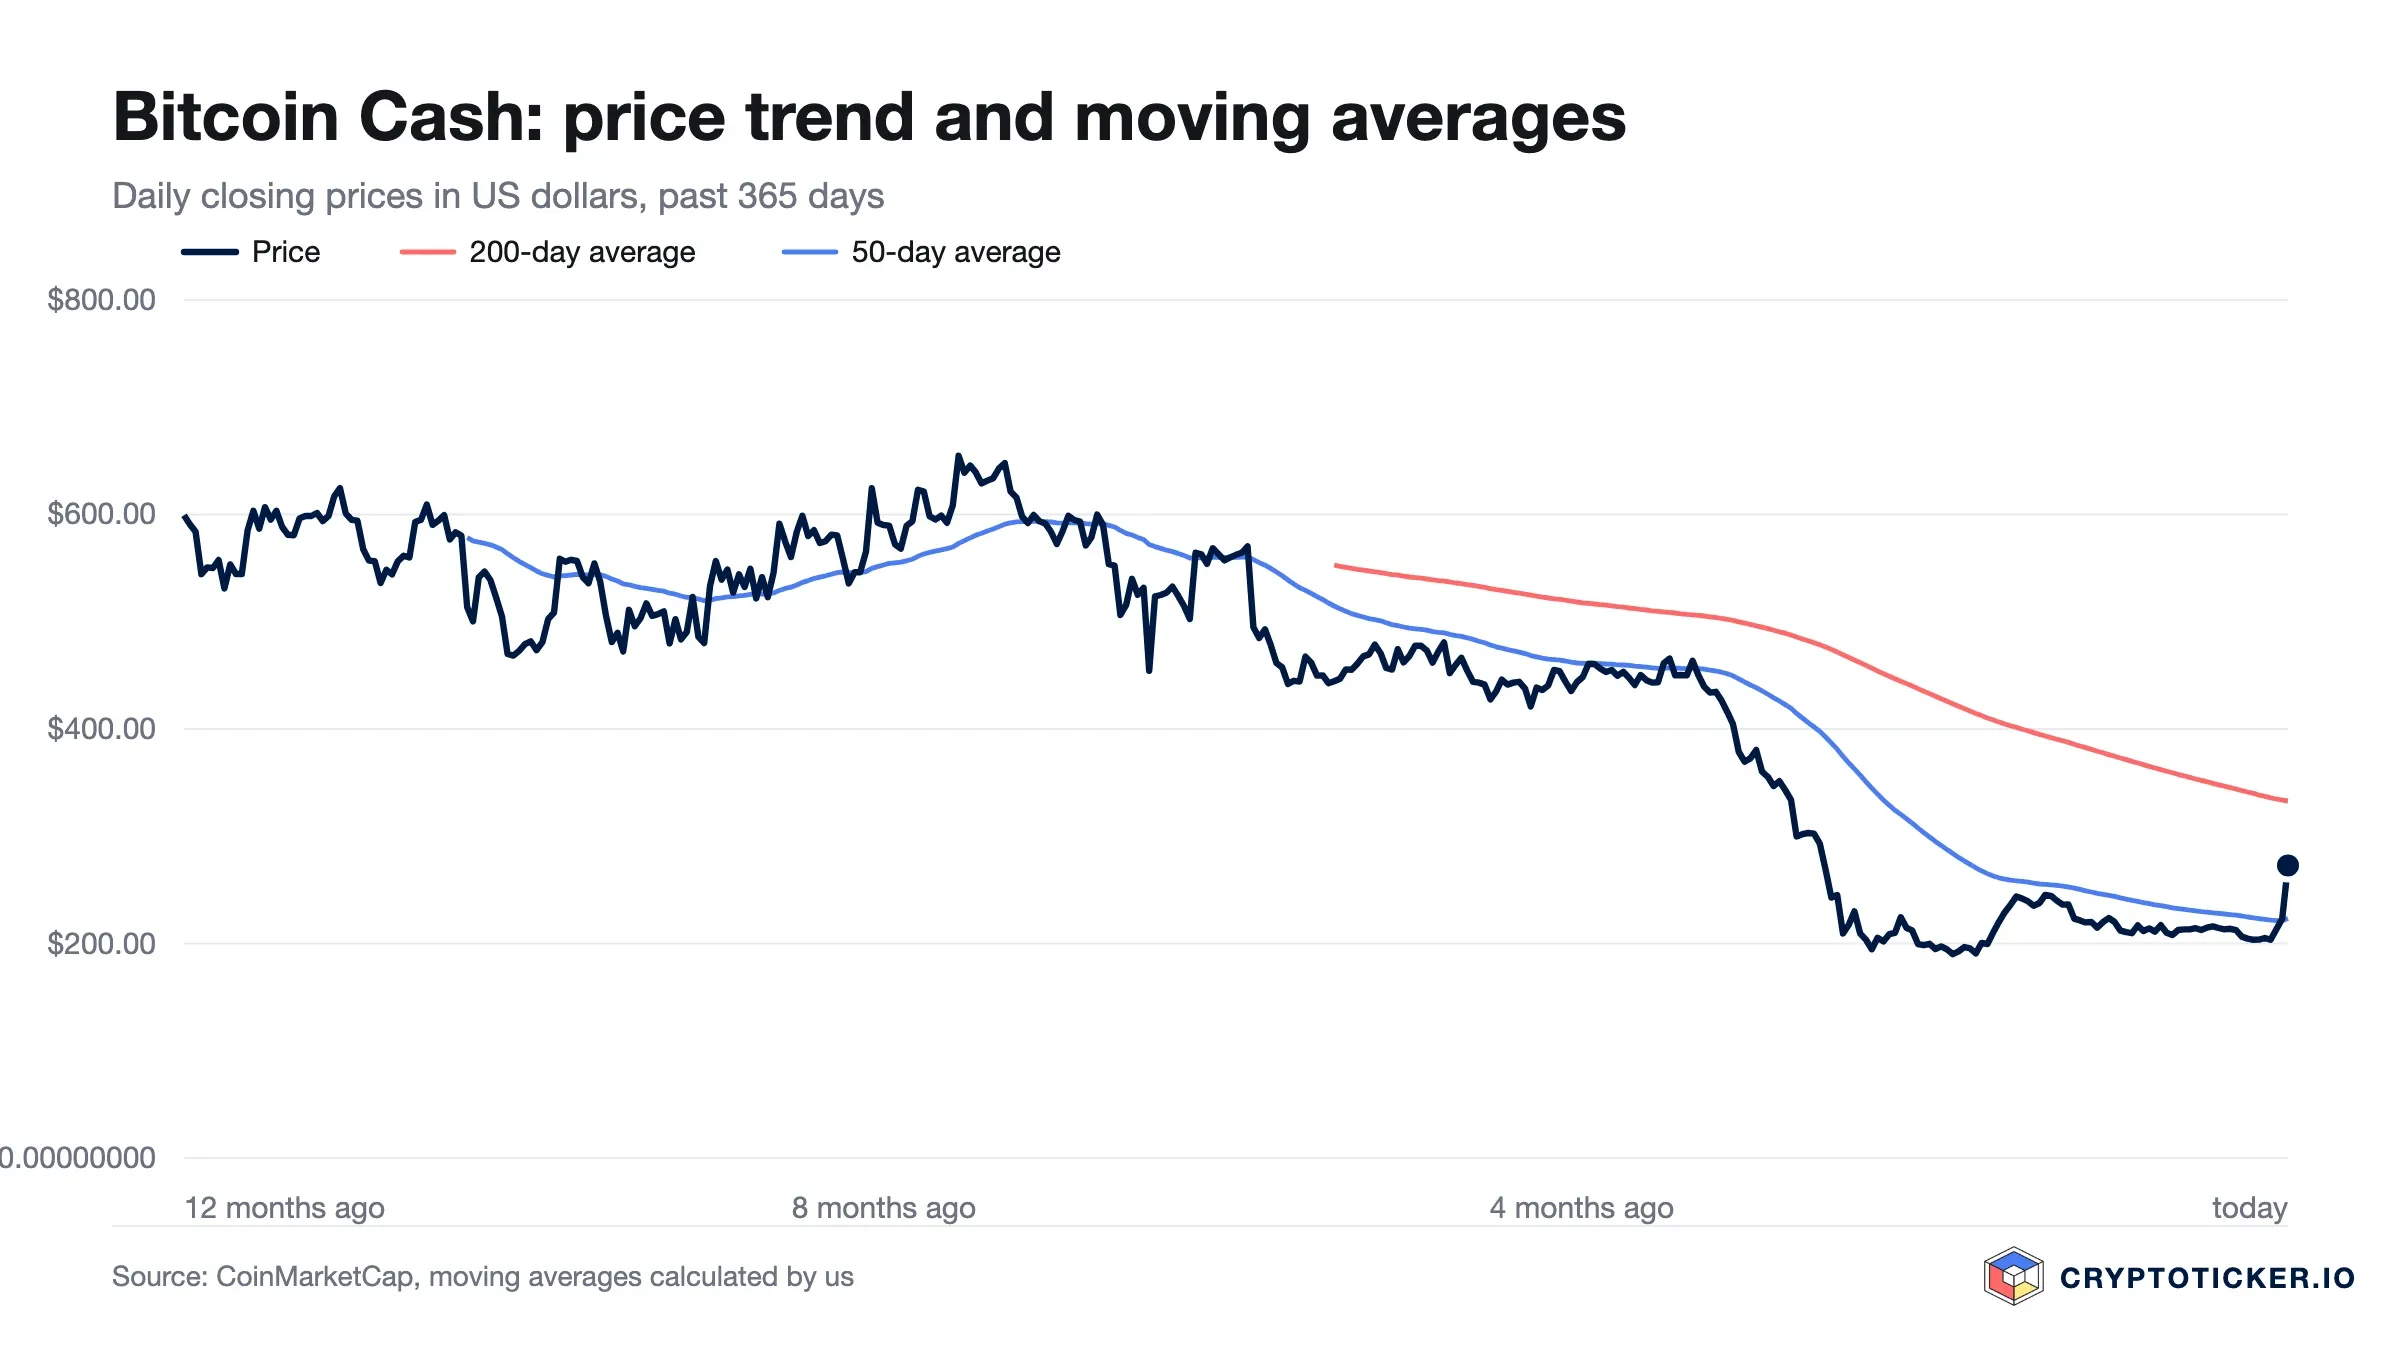
The 277 dollar zone around the 50-day line is the level the price is currently fighting over. Below it, the chart offers little until the June low at 190.35 dollars. Upwards, the 310 dollar zone around the 200-day line is the level that decides whether the summer move was a rebound or a reversal. Between the two lies a gap of roughly 12 percent, far narrower than in August, because the shorter average has caught up with the price rather than the price pulling away from it.
Market capitalisation stands at 5.54 billion dollars, rank 22 in the overall market. Over twelve months the coin has lost 41.2 percent, over 90 days it is up 25.3 percent, over 30 days it is up 7.9 percent. The twelve-month figure is still the heaviest of the three.
Is the Bitcoin Cash downtrend broken or only interrupted?
The honest answer is that it is interrupted, not broken. A downtrend ends technically when the price reclaims the long moving average and holds it, and Bitcoin Cash has not done that. At 275.46 dollars it remains 11.2 percent short of the 200-day average at 310.19 dollars. What has changed since August is the shorter horizon: the 50-day average at 276.63 dollars has caught up with the price, and the coin now trades a fraction below it instead of well above it.
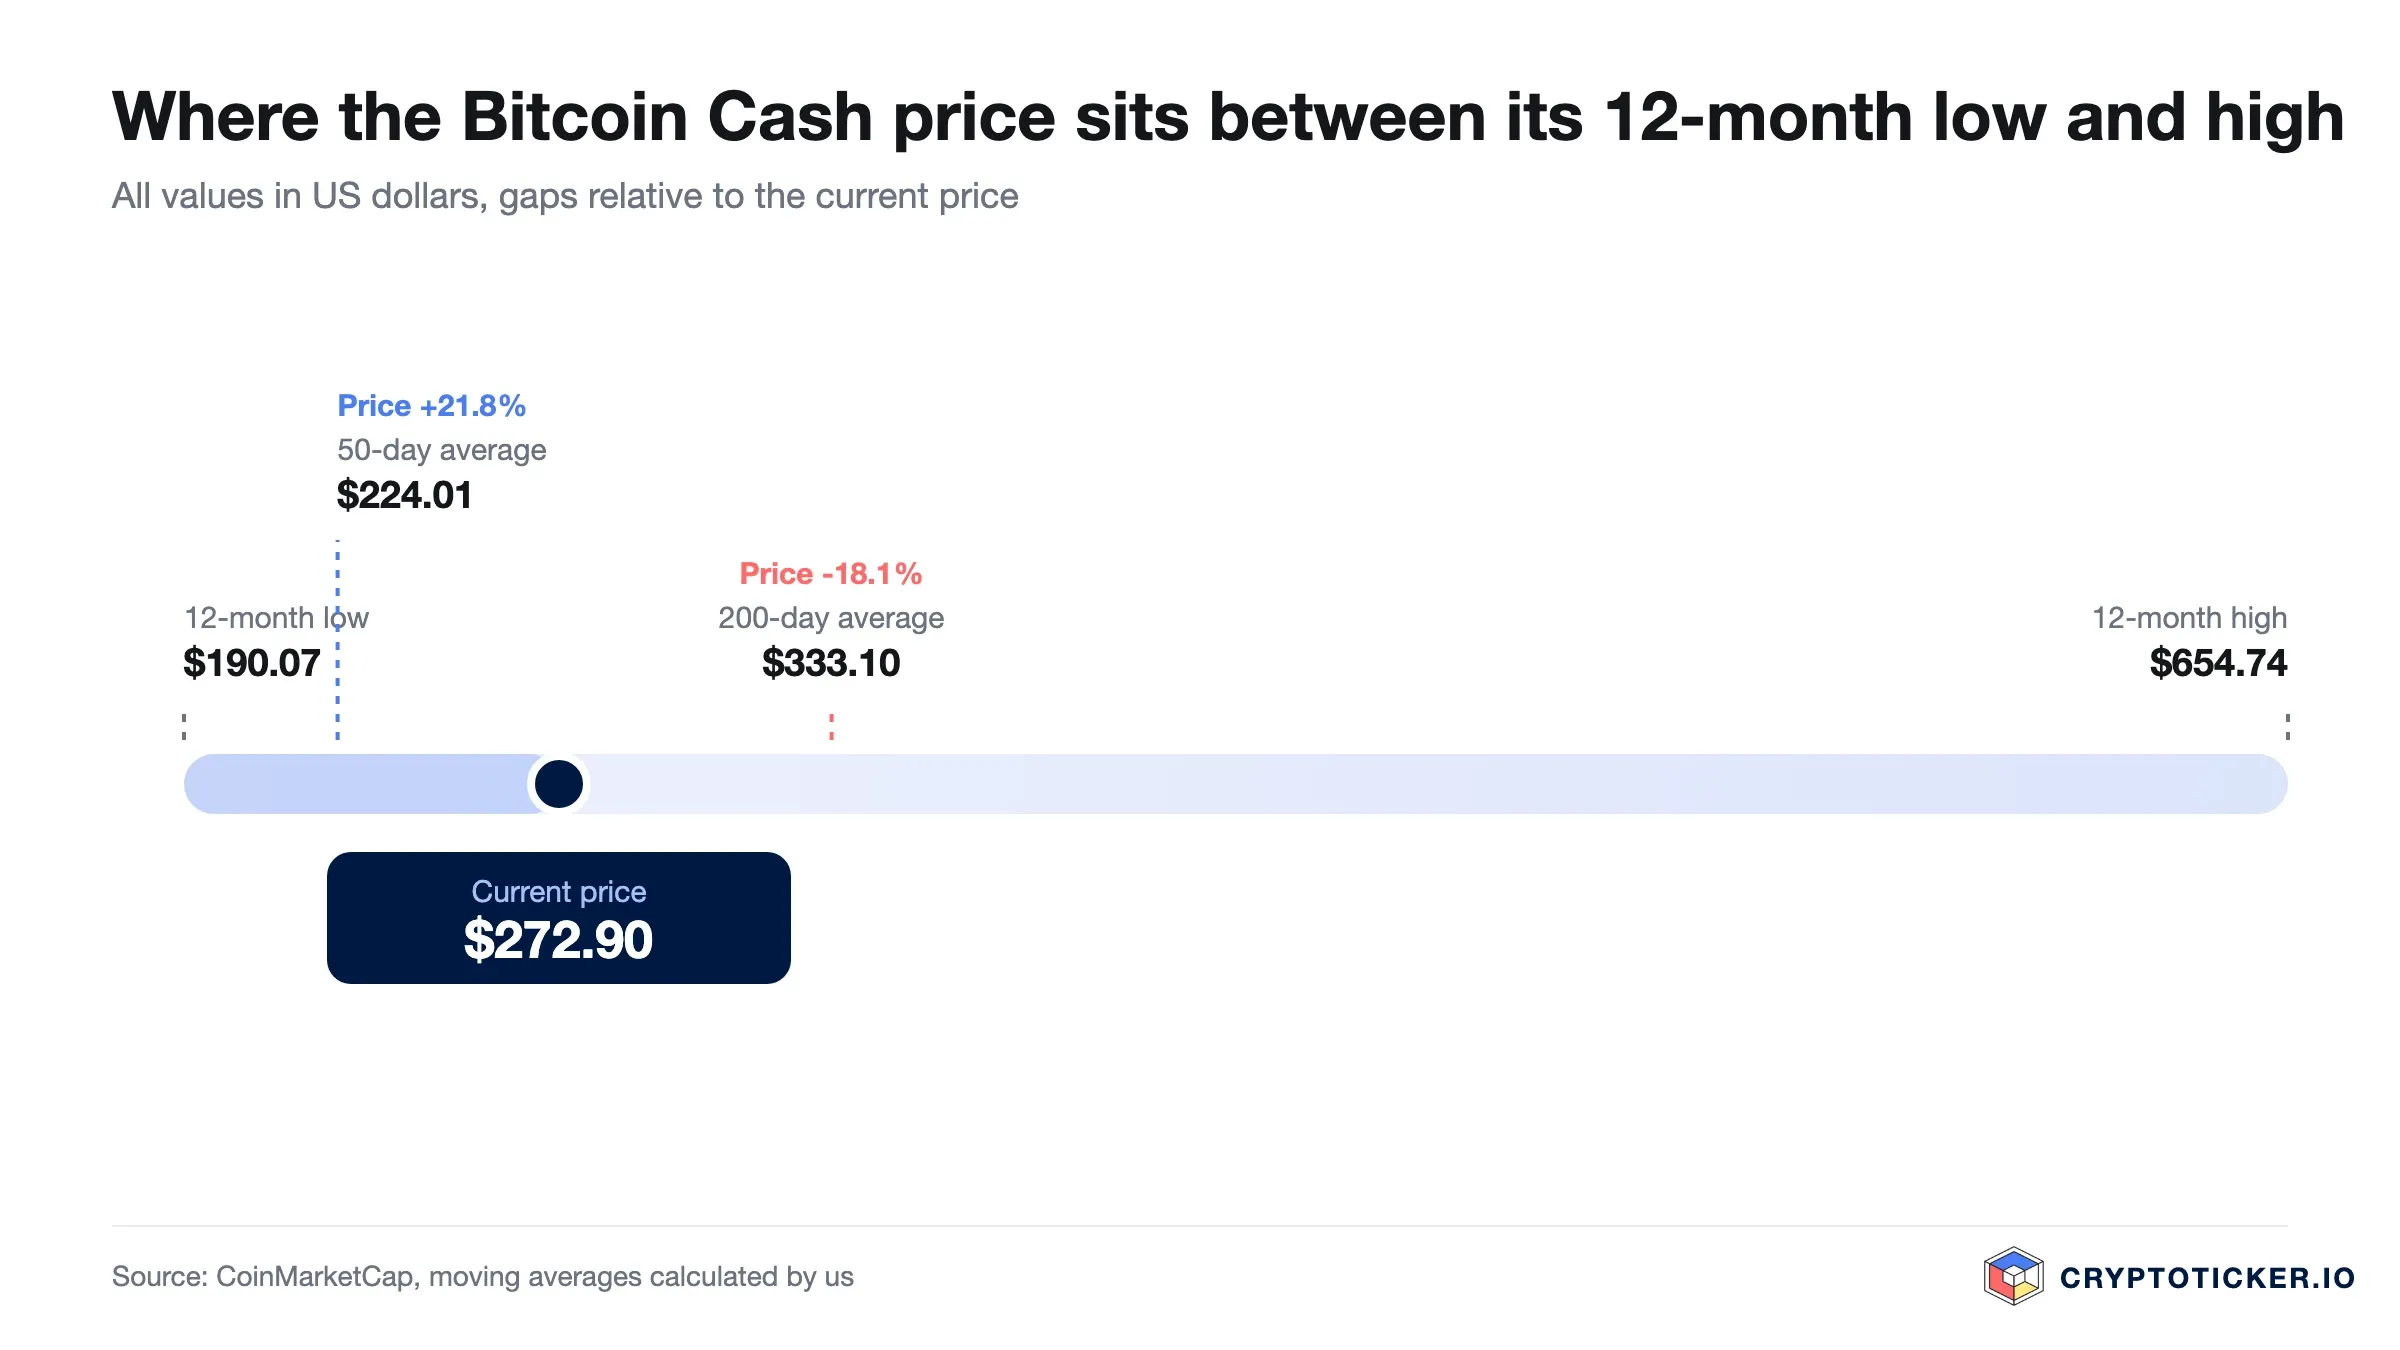
That distinction matters for anyone timing an entry. The June low of 190.35 dollars has held through two separate tests, which gives the floor some credibility. The January high of 654.84 dollars, by contrast, is not a reference point for this cycle in any practical sense; it belongs to a market phase with different liquidity. Between the two, the realistic contest is whether the 310 dollar line gets tested at all now that momentum has faded.
A test of the thesis: if Bitcoin Cash closes clearly below 276.63 dollars for several days and keeps going, the interruption reading is wrong and the downtrend simply resumed. If it closes above 310.19 dollars, the break is real.
What RSI and moving averages mean for a Bitcoin Cash entry
The 14-day relative strength index stands at 45.8. Readings above 70 are conventionally treated as overbought and readings below 30 as oversold; 45.8 sits between the two and carries no signal in either direction. In August the same reading was above 80. The stretch has been worked off, which removes the strongest argument against buying in August without supplying an argument for buying now.
Two readings are defensible. The cautious one notes that the cooling phase arrived as a stall rather than as a sell-off, and that a market which cannot advance on neutral momentum often slips. The constructive one notes that the price held its gains while the indicator reset, which is the healthier of the two ways to cool down. Neither is provable in advance. What can be said is that the current price of 275.46 dollars is neither a discount nor a premium by the measures here — it is 0.4 percent below the shorter average, with the indicator in the middle of its range.
The gap between the averages carries its own information. With the 50-day line at 276.63 dollars still below the 200-day line at 310.19 dollars, the market is working off a long decline, but the two are now 12 percent apart rather than 50. The rally did drag the shorter average up; the question is whether there is enough demand left to do the same to the longer one.
What Bitcoin Cash trading volume reveals about demand
Volume is where the stall shows most clearly. Average daily turnover over the past seven days was 151.9 million dollars, against 273.3 million over 30 days — trading has thinned to roughly half of the monthly pace. In August the ratio pointed the other way, with the seven-day average running well above the monthly one.
The most recent print fits that picture: 123.7 million dollars over the past 24 hours, with the price down 1.0 percent. Rallies that lose their volume before they lose their price are common, and they usually resolve downwards. Bitcoin Cash has now spent several weeks in exactly that condition without resolving either way, which is the detail that separates a considered entry from a late one.
Broader sentiment is no help here either. The Crypto Fear and Greed Index reads 53, in the neutral band. A neutral reading tells you the crowd has no conviction, which is accurate and not actionable.
Which structural factors speak for Bitcoin Cash
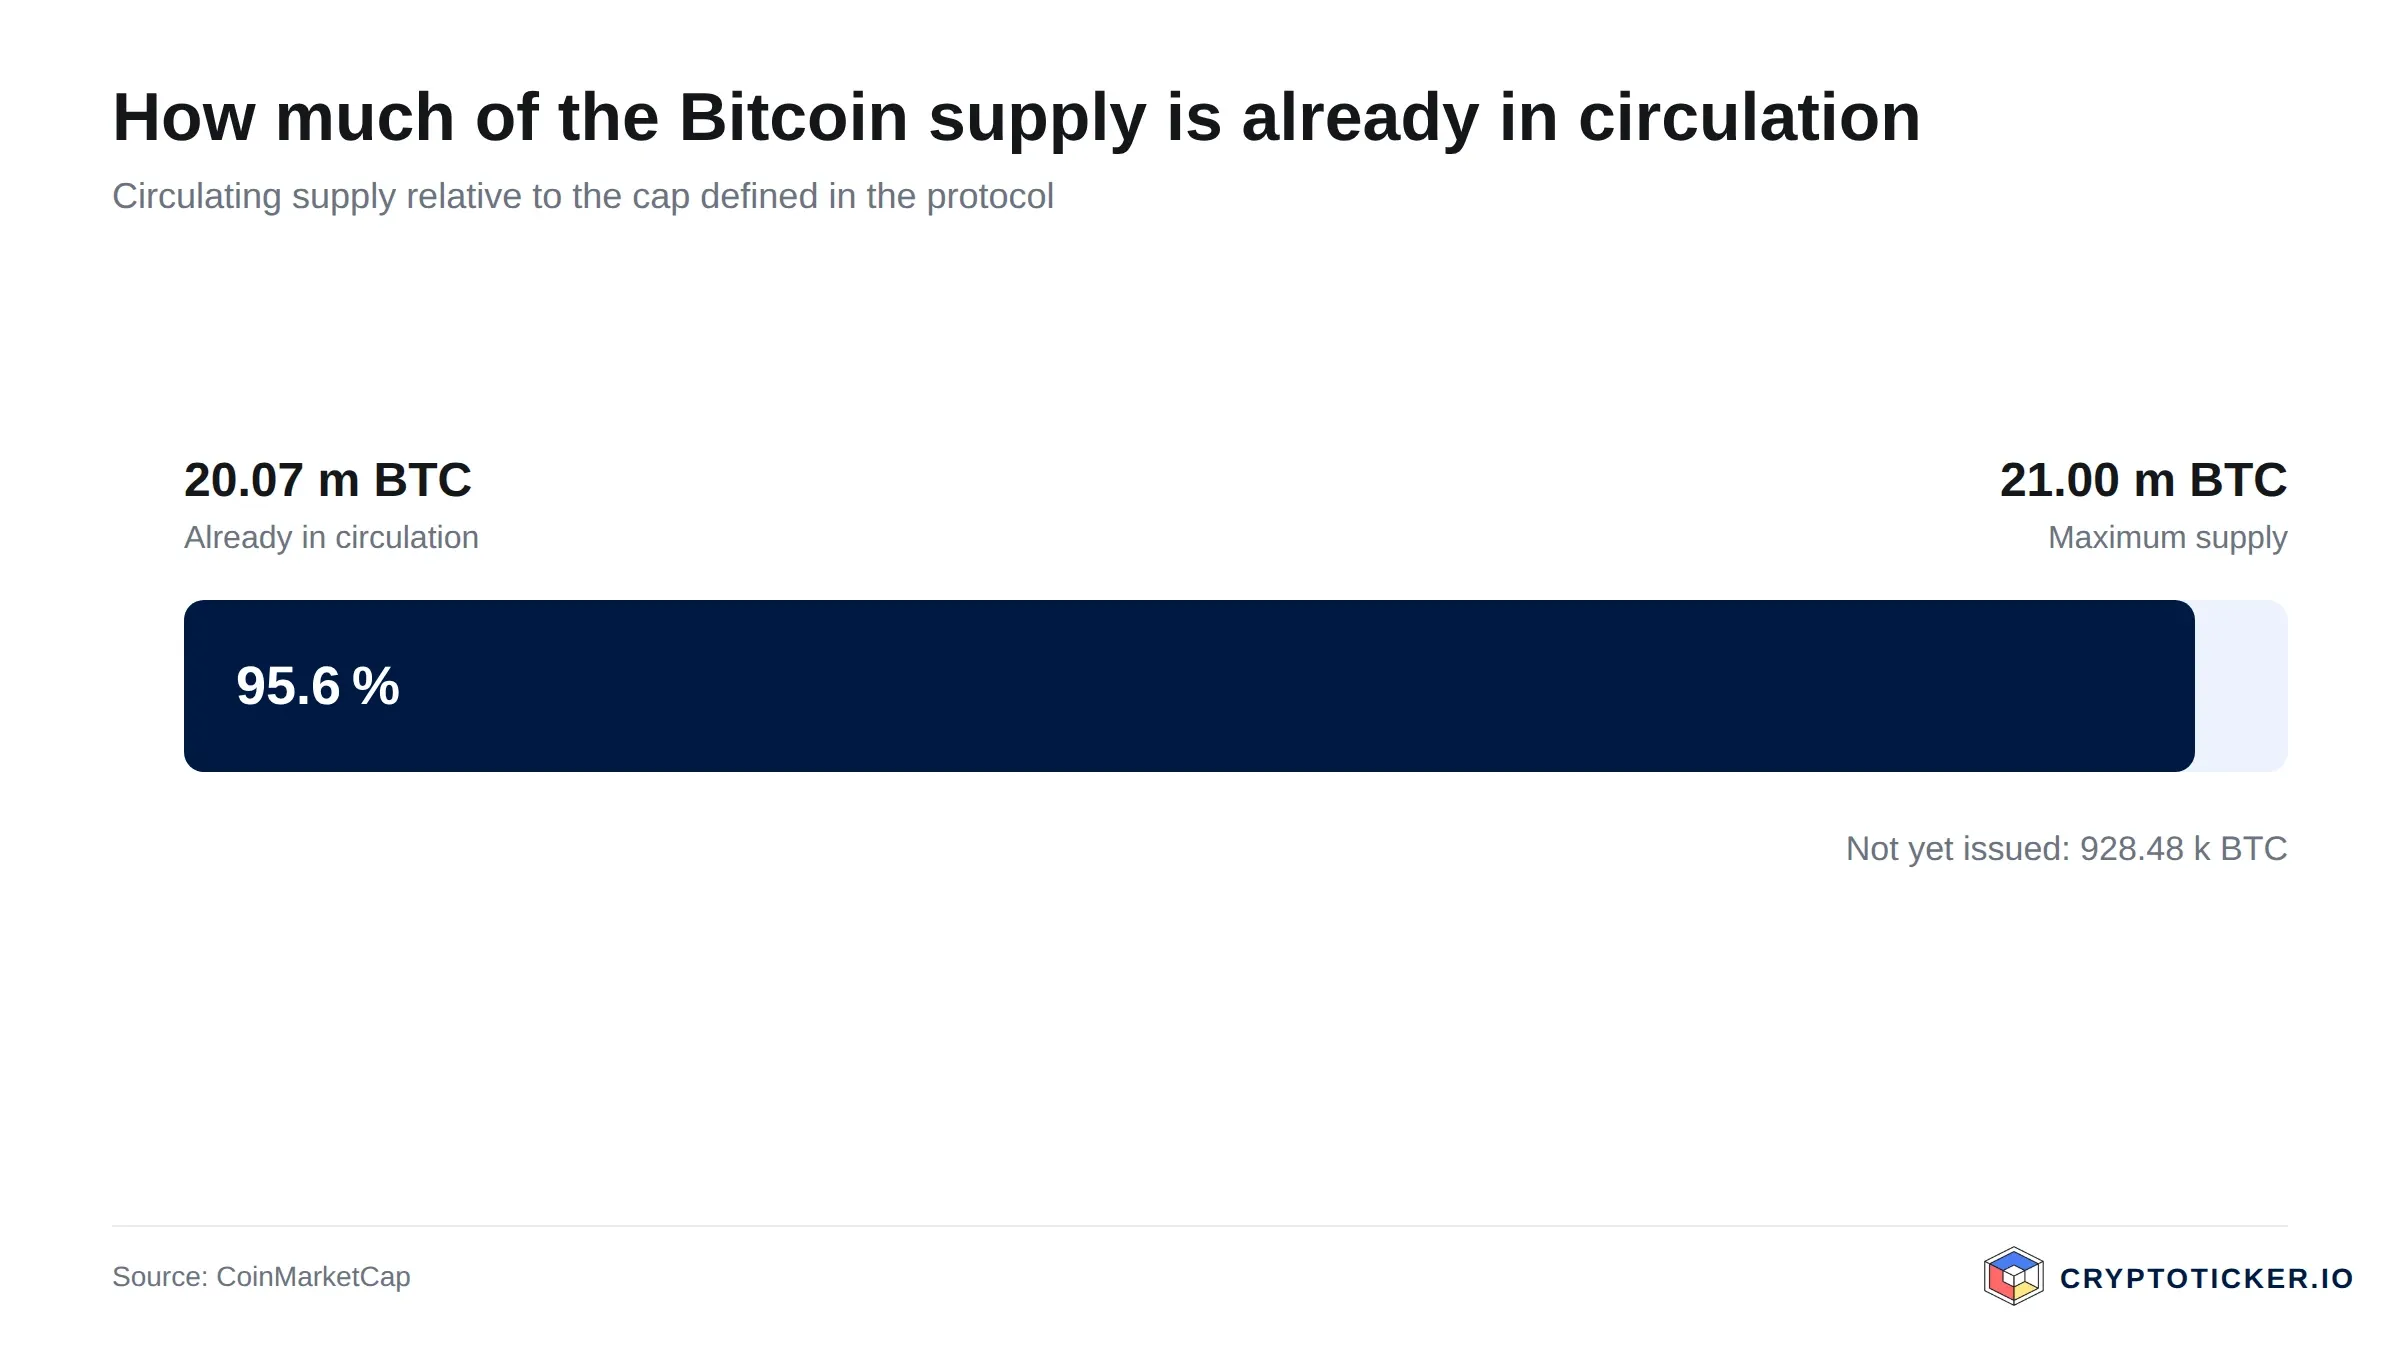
Supply mechanics are the clearest argument. Bitcoin Cash carries a hard cap of 21 million coins, of which 20,104,253 are already in circulation — roughly 95.7 percent of everything that will ever exist. New issuance is a rounding error against turnover, and the halving schedule the coin inherited continues to shrink it. Whatever else moves the price, dilution will not.
The use case is narrower but genuine. Bitcoin Cash is a payment chain, built around cheap on-chain transactions rather than a smart-contract ecosystem, and it remains one of the few crypto assets whose original purpose is described in the Bitcoin whitepaper it forked from. Fees stay low because block space is plentiful, which is the whole design. That gives it a defensible niche and a low ceiling at the same time.
Regulatory positioning helps quietly. As a proof-of-work payment coin with no issuer, no foundation treasury and no staking yield, Bitcoin Cash sits outside most categories European supervisors have been tightening around; the ESMA workstreams focus on intermediaries and issuers rather than assets of this type.
What speaks for buying Bitcoin Cash at current prices
Three arguments hold up to scrutiny.
First, the position relative to the cycle. At 275.46 dollars the coin is still 57.9 percent below its twelve-month high of 654.84 dollars. For a buyer who believes the payment-chain thesis, that is a materially different entry than chasing an asset at its peak.
Second, the gains have held. The coin is 44.7 percent above the floor at 190.35 dollars, it has kept that distance for months, and the 50-day average at 276.63 dollars has risen to meet the price rather than the price falling back to the average. A market that holds a 44 percent recovery through a volume drought is not under distribution.
Third, the supply side is finished arguing. With 95.7 percent of the 21 million cap already issued, the buyer is exposed to demand risk but not to dilution risk. Among mid-cap crypto assets that is rarer than it sounds.
What speaks against buying Bitcoin Cash at current prices
Three arguments cut the other way, and they are not weaker.
First, there is nothing pulling the price up. RSI at 45.8 and a price 0.4 percent below the 50-day average describe a market without direction, and turnover at half the monthly average says the same thing. Buying here means buying a thesis, with no help from momentum.
Second, the long trend is still down. Minus 41.2 percent over twelve months is the actual context, and the 200-day average at 310.19 dollars sits above the price, not below it. The plus 25.3 percent over 90 days does not change that. Every recovery in this coin over the past year has stalled before reclaiming that line, and this one has stalled too.
Third, the demand behind the move has drained away. Turnover over seven days is 44 percent below the thirty-day average while the price holds. That is consistent with a move driven by short-term positioning rather than by durable buying, and that distinction is exactly what a buyer at these levels is exposed to.
How to buy Bitcoin Cash at current prices: costs, custody, providers
Entry costs compound timing risk, and spreads vary widely between venues. Our exchange comparison sets out what the main platforms charge, and the overview of regulated exchanges narrows that to providers under European supervision. For individual venues, our Kraken review and Bitpanda review cover fees and deposit methods.
On custody, the trade-off is straightforward. Coins left on an exchange are convenient and carry counterparty risk; coins moved to self-custody remove that risk and add the risk of losing your own keys. For a position intended to be held through a full cycle rather than traded, a hardware wallet is the standard answer, and Bitcoin Cash is supported by every major device. For a position intended to be exited on a move to the 200-day line, the transfer costs may not be worth it.
One note on sizing: a coin that moved 33 percent in a single week this summer can move that far in either direction again, however quiet the past seven days have been. A position sized for a 20 percent drawdown is not sized for this asset.
So is Bitcoin Cash a good buy at current prices?
Split the question by horizon, because the two answers point in opposite directions.
Short term, the numbers presented here point in no direction at all. An RSI of 45.8, a price 0.4 percent below the 50-day average at 276.63 dollars, and turnover at roughly half the monthly average describe a market that is waiting. The overheating that made August a poor entry is gone; nothing has replaced it with a reason to act. Buyers who need a short-term edge will not find one in this data.
Long term, the case is more balanced. At 275.46 dollars the coin trades 57.9 percent below its twelve-month high of 654.84 dollars and 44.7 percent above its twelve-month low of 190.35 dollars, with a fixed supply of 21 million and a functioning payment niche. Whether that is enough depends on a judgement no chart can settle: whether cheap on-chain payments remain a use case with demand behind them.
The conditions under which this framing is wrong are worth stating plainly. If Bitcoin Cash closes above the 200-day average of 310.19 dollars with turnover recovering towards the thirty-day average of 273.3 million dollars, the trend has changed and the caution above was misplaced. If it loses 276.63 dollars decisively and then approaches 190.35 dollars, the recovery reading fails and the twelve-month downtrend is simply continuing. Both are observable, and neither is a forecast.
Buying Bitcoin Cash: what to take away
- The trend has improved locally, not structurally. Bitcoin Cash at 275.46 dollars sits 0.4 percent below its 50-day average of 276.63 dollars and 11.2 percent below its 200-day average of 310.19 dollars. Our Bitcoin Cash price prediction sets out the longer horizon behind that split.
- The entry point is neither cheap nor expensive by the coin's own measures. An RSI of 45.8 after a flat week gives patient capital nothing to react to. Where you buy still changes the arithmetic, and the comparison of regulated exchanges shows what the spread between venues actually costs.
- Position size and custody carry more of the outcome than timing does. With a twelve-month range from 190.35 to 654.84 dollars, the swing is the asset. A hardware wallet is the standard answer for anything held beyond a trade.
Disclosure: Some of the providers mentioned in this article work with us through partner programmes. This has no influence on the price analysis or on the assessment of the chart situation; the price data comes from a public market data source and can be verified there.
(As of 18 October 2026. This article is not investment advice. Prices, fees and terms change; check them with the provider before every purchase. Crypto assets are subject to high price volatility, and a total loss is possible.)
Transparency note: This article was produced with the assistance of artificial intelligence and reviewed by our editorial team before publication. All figures and claims were checked against the primary sources linked in the text. The feature image was generated with AI.
Related articles
- Bitcoin Cash Falls 5.5 Percent After a 50 Percent Week: Check Your Buy Route, Leverage and Holding Period
- Bitcoin Cash and the CME Futures Launch on October 19: Will the Listing Carry the Price?
- Is it a Good Idea to Buy XRP below $0.60?
- Is Bitcoin Still a Good Investment in October 2026?
- Bitcoin Cash Jumps by Double Digits: What the Grayscale ETF Filing Really Means for You in Germany
Which topics should we dive deeper into?
Select what genuinely interests you. Your picks feed directly into our editorial planning.
Crypto news that's actually worth your time.
Weekly. 60 seconds. Carefully curated by our editors: no hype, no promo flood, no spam.

February 11, 2026 7:05 AM
5 Things to Look for BEFORE Buying Bitcoin
Thinking about entering the crypto market? Discover the 5 essential factors to check before you buy Bitcoin to secure your investment and strategy.
August 21, 2026 6:07 PM
Bitcoin Cash Explodes 29% In A Day: Why BCH Outperformed BTC?
Bitcoin Cash jumped 29.41% to $288, the biggest daily gain of any major coin. The reason has almost nothing to do with Bitcoin Cash itself.

October 16, 2020 1:55 PM
Bitcoin Cash (BCH) Price Analysis – Rejected at the Resistance at ±$265!
The Bitcoin Cash price was able to rise up to the golden ratio at ±$265, where it was strongly rejected! Bitcoin Cash Price Analysis – Rejected at the golden ratio! After the Bitcoin Cash price strongly bounced at the golden […]

September 28, 2026 4:28 AM

Is Quant a Good Buy at the Current Price?
Quant climbed as high as 357 dollars after the bank mandate and has since fallen back sharply. Is QNT a good buy at the current price? We check the chart, volume, the banks' timetable and the token's role with our own data.
September 10, 2024 1:54 PM

Bitcoin Price Analysis: Why Is BTC Price Up TODAY?
Why Bitcoin price surged today, and was it driven by market anticipation of U.S. inflation data and the Trump vs. Harris debate?
August 27, 2026 4:31 AM

Is AAVE a Good Buy at Current Prices?
AAVE has worked its way back above both the 200-day and the 50-day moving average, yet still trades far below its twelve-month high. Using our own price data, we examine what speaks for and against an entry at current prices.
August 27, 2026 3:24 AM

Is Hedera a Good Buy at Current Prices?
Hedera met our trend-reversal test in September, then gave back the entire IBM jump. What higher lows, HashPack's stock tokens and Hitachi's exit from the council mean now: is Hedera a good buy at current prices?
August 27, 2026 2:21 AM

Is SUI a Good Buy at Current Prices?
SUI is holding its 200-day moving average and trades 51 percent above its twelve-month low, with the 50-day line now above the 200-day. We check whether the coin is a good buy at current prices.
August 16, 2026 12:21 PM

Is Toncoin a Good Buy at Current Prices?
Toncoin, now traded as Gram (GRAM), has fallen back below both moving averages and the September breakout has failed. What the Telegram wallet, volume and the base mean now: is Toncoin a good buy at current prices?
May 13, 2026 11:02 AM

Is PEPE Coin worth Buying in 2026?
PEPE still holds both its 50 day and its 200 day average, while trading volume has slipped back below its yearly norm. What that means for anyone buying at current prices, and the two levels that settle it.
May 18, 2026 1:07 PM

Is Solana a Good Buy in 2026? SOL Price Analysis and Potential ROI
Solana (SOL) trades at $104.40 after clearing the $100 resistance. Here's how SOL's potential returns stack up against BTC, ETH, and XRP.
September 28, 2026 9:47 AM
XRP Price Drops Below $1.50: Where Is Ripple Heading This Week?
XRP price slips under $1.50 after a red weekend. Here is the XRP price analysis with the higher and lower targets that matter this week.
July 27, 2024 2:34 PM

Why Is The Crypto Market Up TODAY?
With the Bitcoin 2024 Conference taking place now in Nashville, the crypto market is showing bullish signals, intriguing traders around the future of Bitcoin and Altcoins.
August 23, 2026 1:16 AM

Is PEPE a Good Buy at the Current Price?
PEPE has given up the 50-day moving average but still holds clearly above the 200-day line. Is the memecoin a good buy at the current price, or is the rally already running on thin volume?
August 24, 2026 12:34 AM
Is Monero a Good Buy at Current Prices?
Monero broke above the level we named in September as the test for a trend change. What the breakout, an overbought RSI and EU rules mean now: is Monero a good buy at current prices?
August 24, 2026 12:19 AM

Is Zcash a Good Buy at Current Prices?
Zcash has given back part of its September advance and now sits just above its 50-day average. We look at what the trend, the RSI and the turnover actually support, and under which conditions the case for buying ZEC breaks down.
August 3, 2026 10:41 AM
Is XRP Coin a Good Buy At Current Prices?
XRP trades at $1.33 and has lost both moving averages, with the 50-day EMA dropping back below the 200-day on 18 October. Why the $1.20 shelf now decides where the recovery finds its floor.

March 29, 2026 2:07 PM

Is Ethereum a Good Store of Value?
Is Ethereum a reliable store of value? We analyze ETH price history, the "ultrasound money" narrative, and its long-term potential for 2026 and beyond.
December 10, 2024 12:30 AM

Bitcoin Price Drops Below $100K – Is a Bigger Crash Coming?
Bitcoin has fallen below $100K, triggering a broader market correction of over 8% in the last 24 hours. With profit-taking and large sell-offs hitting the market, could Bitcoin drop to $90K or lower?
August 9, 2024 10:16 AM
Bitcoin Price Prediction: After Breaking The $60k Mark, Can BTC Price Surpass $70k Next?
A huge surge in Bitcoin price is on the horizon with multiple signals waving for investors to grab this opportunity. Explore the potential for BTC price...
March 11, 2026 8:31 AM
Why is Bitcoin Moving Sideways? 3 Reasons for the BTC Price Consolidation
Bitcoin has dropped only 0.9% this month but remains trapped in a range. Here's why BTC is moving sideways and how traders are profiting from 63K to 73K.
June 25, 2024 11:00 PM

How to Buy Bitcoin on Bitget: A Step-by-Step Guide
Want to buy Bitcoin and still confused about which platform to use? Look no further! Check Bitget, and this full guide, step by step...

June 30, 2019 4:08 PM
What Is Bitcoin Cash? The Fork, Block Size and What CME Futures Change
Analysis: What Bitcoin Cash is, how BCH differs from Bitcoin and what CME futures and the ETF filing change, with current figures on block size, fees and usage.
October 9, 2026 10:32 PM

Bitcoin Cash Recovers Only 16 Percent of the Slide, Bitcoin 88 Percent: The Level That Decides
Bitcoin Cash is down 7.3 percent at $273.80 while Bitcoin recovers almost all of the October 8 slide. There is no news specific to BCH, and the exchange ratio against Bitcoin falls by 7.9 percent.
April 2, 2026 2:44 PM

Bitcoin Price Drops Below $66,000 as $251M in Longs Vanish
Bitcoin slumps below the $66,000 mark, triggering over $251 million in liquidations. Technical analysis reveals a bearish trend line and key support levels.

More from CryptoTicker