
Is Hedera a Good Buy at Current Prices?
Hedera met our trend-reversal test in September, then gave back the entire IBM jump. What higher lows, HashPack's stock tokens and Hitachi's exit from the council mean now: is Hedera a good buy at current prices?





Which topics should we dive deeper into?
Select what genuinely interests you. Your picks feed directly into our editorial planning.
Crypto news that's actually worth your time.
Weekly. 60 seconds. Carefully curated by our editors: no hype, no promo flood, no spam.
Hedera (HBAR) changes hands at 0.0851 US dollars in the early hours of Thursday, 22 October 2026, up 1.6 percent over 24 hours. Since our first assessment on 24 August, when HBAR cost 0.0786 dollars, the price has risen 8.2 percent. That small gap hides two eventful months. In late September HBAR jumped on news that a Hedera-based application had been listed in IBM's cloud catalogue, closing at 0.1219 dollars on 28 September after an intraday peak of 0.1306 dollars. By mid-October the whole jump was gone, and since 12 October the price has traded below both of its moving averages again. A market capitalisation of 3.75 billion dollars ranks HBAR 28th, against 24th in August. The question is the same, the starting point is not: is Hedera a good buy at the current price now that the September breakout has failed to hold?
cryptoticker.io collected the underlying price data itself late on 21 October 2026. Source: market data from CoinMarketCap. Method: daily closing prices over the past twelve months plus the current spot quote as the final data point, with the 50-day and 200-day exponential moving averages and the relative strength index derived using the standard formulas, the RSI after Wilder over 14 days. Intraday highs, lows and daily turnover come from CoinMarketCap's daily candles. Wherever we cite a level, it rests on that data set, not on a forecast. The table sets today's readings against those of our first analysis on 24 August.
| Metric | 24 August 2026 | 22 October 2026 |
|---|---|---|
| Price | $0.0786 | $0.0851 |
| 50-day average | $0.0708 | $0.0872 |
| 200-day average | $0.0920 | $0.0879 |
| Distance to the 200-day line | -14.5% | -3.2% |
| Relative Strength Index (14 days) | 68.9 | 44.3 |
| Trading volume, 24 hours | $95m | $88.5m |
| Market capitalisation | $3.45bn | $3.75bn |
Hedera price analysis: where the HBAR price stands now
At 0.0851 dollars HBAR trades 2.4 percent below its 50-day average of 0.0872 dollars and 3.2 percent below its 200-day average of 0.0879 dollars. In August the price sat about 11.1 percent above the fast line and about 14.5 percent below the slow one, and the two averages were 0.0212 dollars apart. Since then the 50-day average has climbed 23 percent while the 200-day average has slipped 4.5 percent. Today only 0.8 percent separates the two lines, and the price sits just beneath both of them.
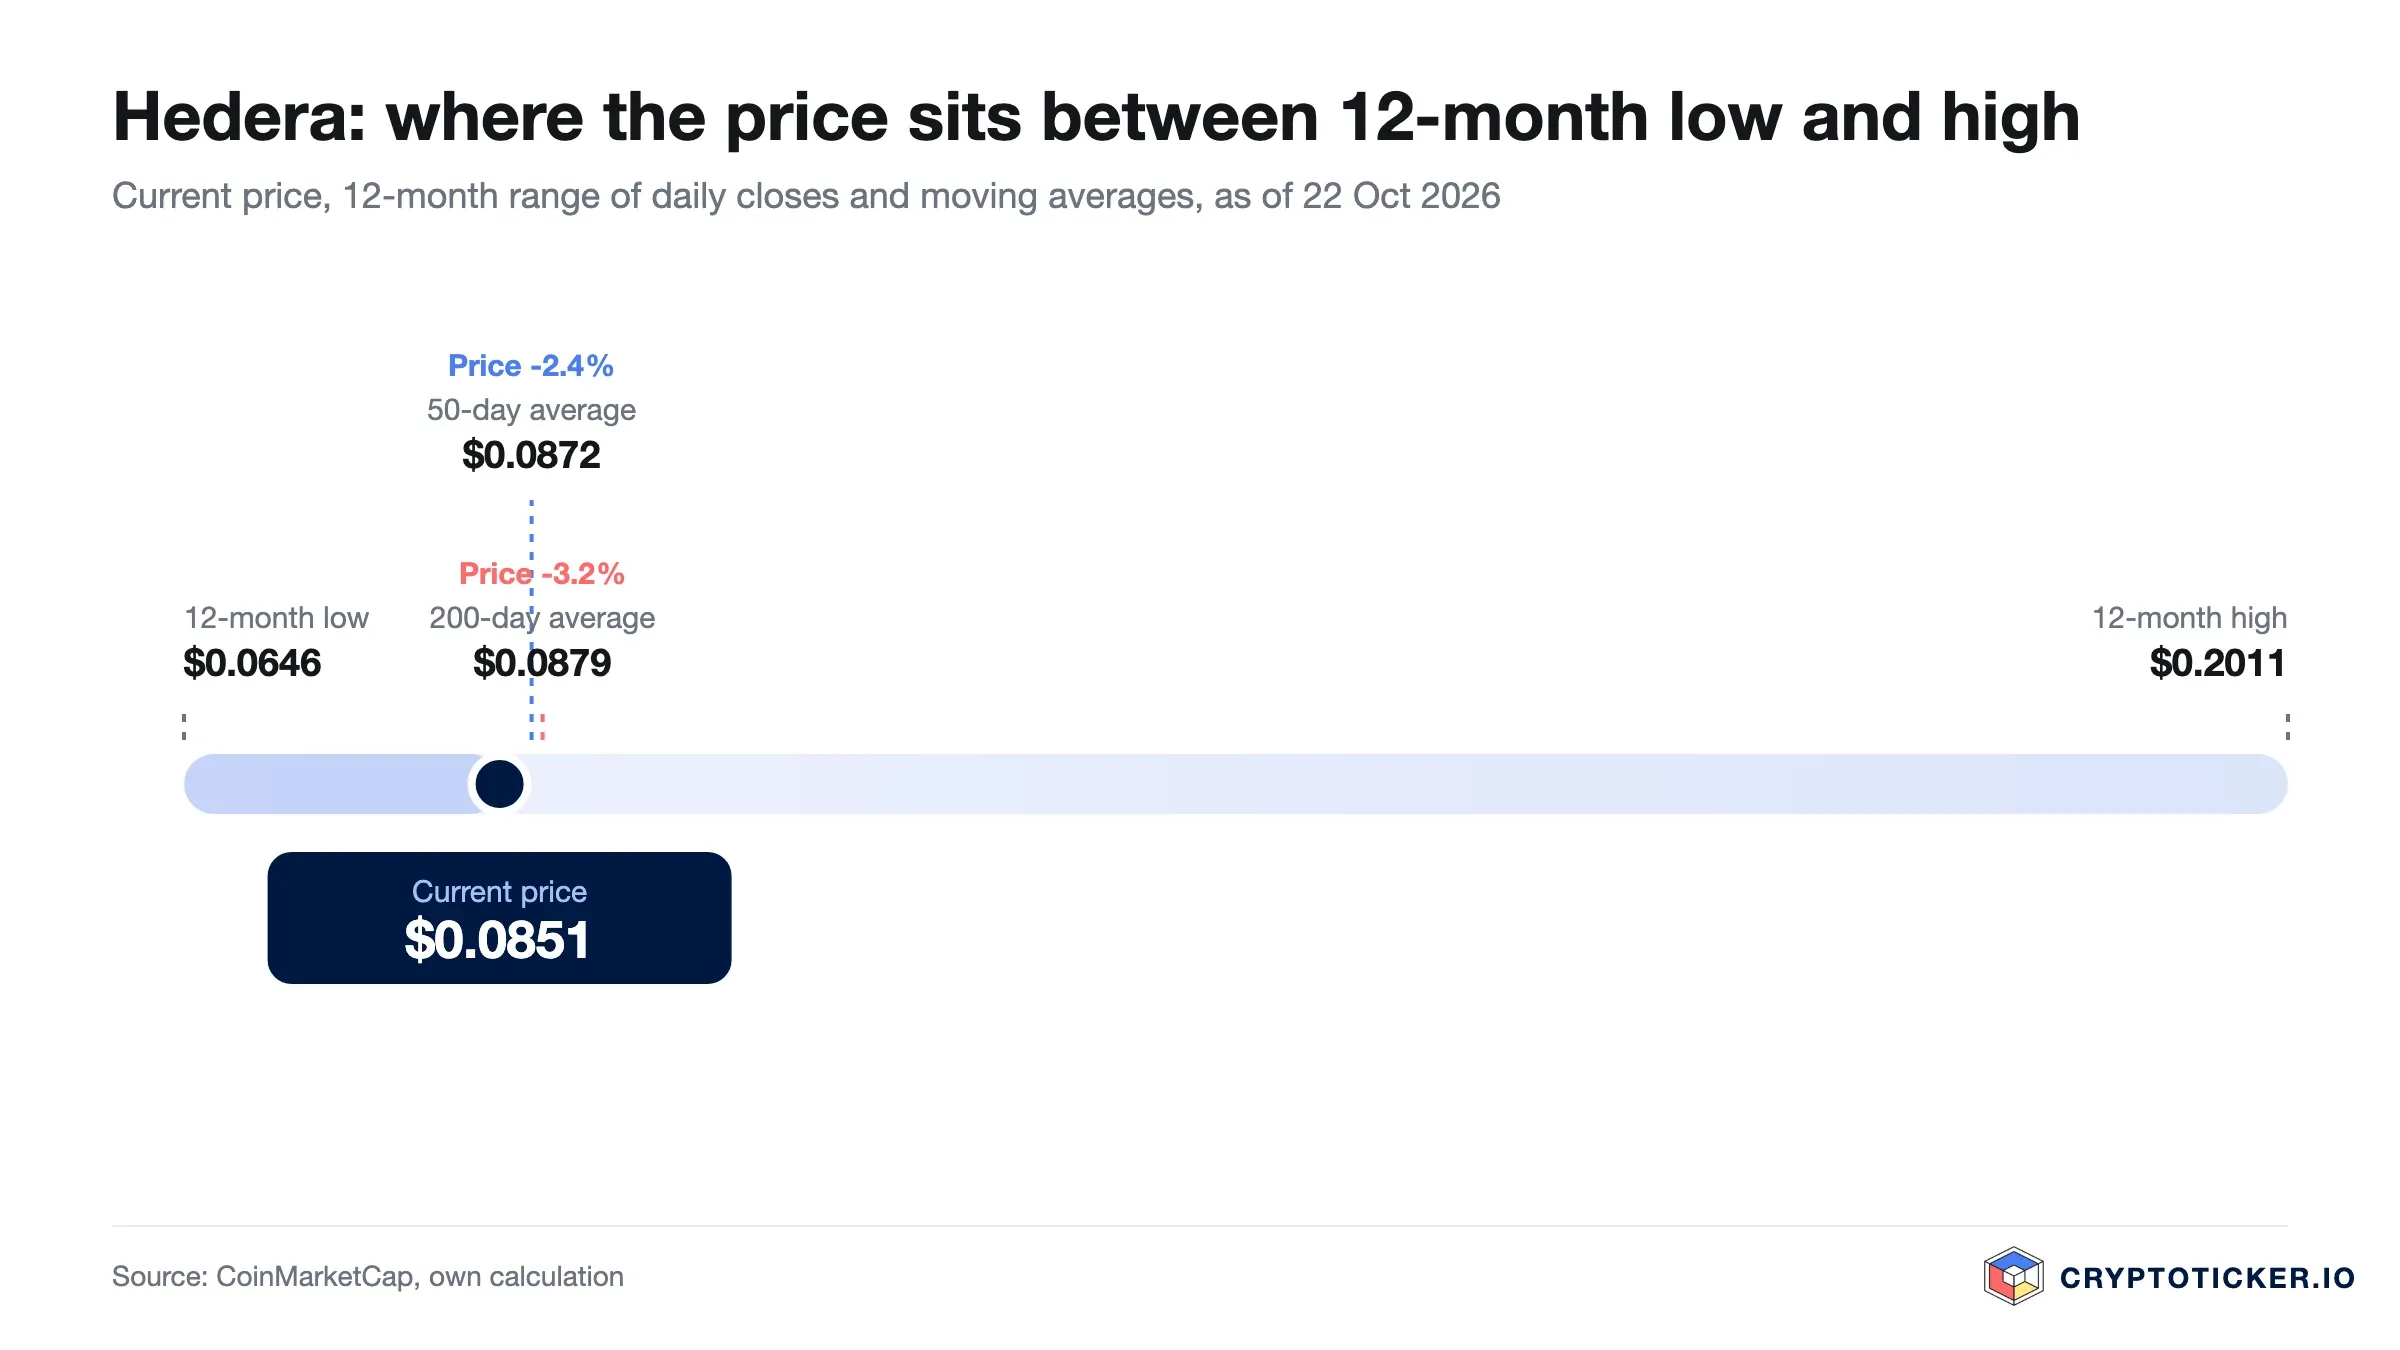
Overhead, the first markers are the two averages at 0.0872 and 0.0879 dollars, then the 18 October high of 0.0894 dollars and the old trend level of 0.0920 dollars, 8.1 percent above the price. Further up sit the highest October close of 0.1041 dollars from 4 October and the 28 September close of 0.1219 dollars. Since 13 October HBAR has traded between 0.0804 and 0.0894 dollars intraday. Below, the levels are the October low of 0.0804 dollars from 15 October, 5.5 percent beneath the price, the lowest daily close since our first assessment at 0.0734 dollars on 30 August, and the twelve-month low of 0.0646 dollars from mid-August. The twelve-month high we quoted in August, 0.2532 dollars from August 2025, has since dropped out of the window; the highest close of the past twelve months is now 0.2011 dollars from late October 2025.
Is the Hedera downtrend broken or just interrupted?
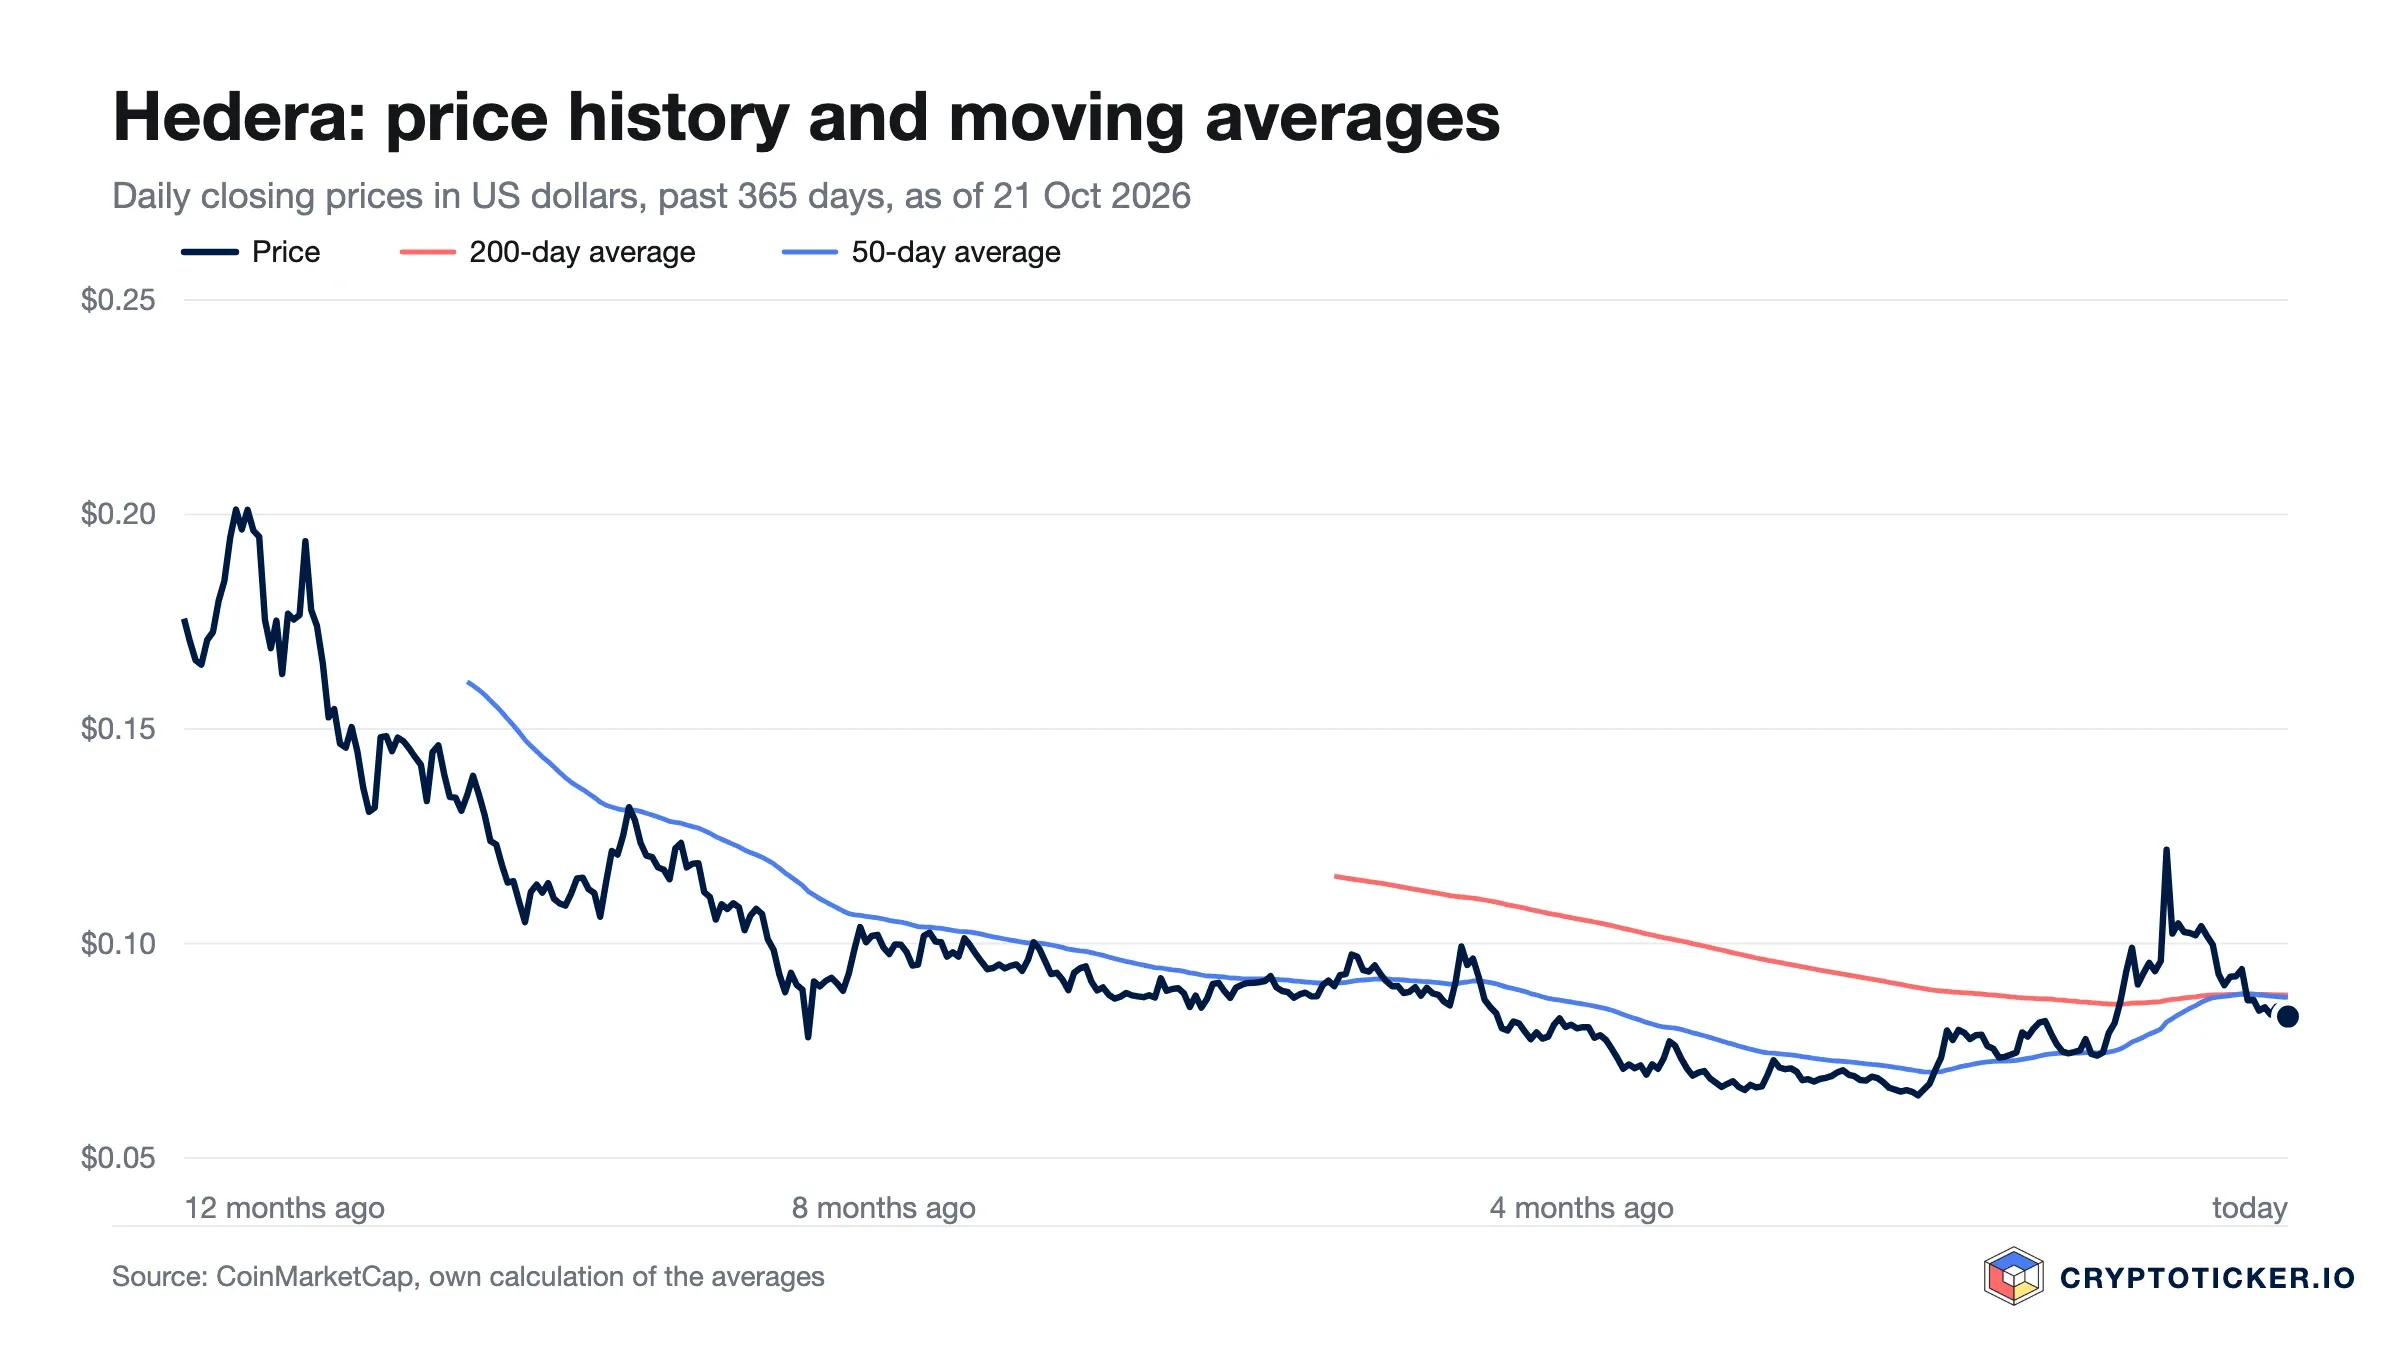
In August we named the concrete test: a daily close above the 200-day average, then at about 0.0920 dollars, followed by a successful retest that holds. We added that the undervaluation case would be weakened if price lost the 0.0646 dollar low on rising volume, and strengthened if HBAR reclaimed 0.0920 dollars and held it on a retest. The first half of that test was passed. On 21 September HBAR closed at 0.0932 dollars on 194 million dollars of turnover, and on 28 September, after The Hashgraph Group announced that IBM had validated its Hedera-based identity platform IDTrust and listed it in the IBM Cloud Catalog, the token gained 27.1 percent in a day on 1.30 billion dollars of volume, the busiest session of the past three months. The background is in our report on the HBAR jump after the IBM listing. The weakening condition never came close: the lowest close since 24 August was 0.0734 dollars on 30 August, the lowest intraday print 0.0720 dollars on 16 September.
The second half, the retest, failed. HBAR closed 16.0 percent lower the day after the jump, lost 11.3 percent on a closing basis in the market-wide sell-off from 5 to 8 October, when 1.16 billion dollars of positions were liquidated on 8 October alone, and dropped 7.7 percent to 0.0868 dollars on 12 October. That ended a run of 21 daily closes above the 200-day average that had started on 21 September, and the price has not closed back above the line since. The 50-day average came within 0.0002 dollars of the 200-day average on the 11 October close, at 0.0883 against 0.0885 dollars using the same method as in August, without crossing it. Over twelve months HBAR is down 50.1 percent from 0.1705 dollars, over 90 days up 18.8 percent and over 30 days down 7.2 percent. Our reading: the August floor has held and produced higher lows, 0.0643 dollars on 17 August, 0.0720 dollars on 16 September and 0.0804 dollars on 15 October, but the breakout above it did not stick. The downtrend is interrupted again, not over.
What RSI and moving averages mean for an HBAR entry
The 14-day relative strength index sits at 44.3, just below the midpoint of the scale. In August it stood near 68.9, close to the overbought threshold of 70, and we read it as a caution flag that suggested the easy part of the bounce might be done. That proved right in the short run: by 30 August HBAR had fallen 6.6 percent on a closing basis from our August price, and by 16 September 8.4 percent intraday, before the September rally began. In between the index ran up to 79.5 on 22 September and 80.3 on 28 September. Since 12 October it has stayed between 40.9 and 44.0. The froth is gone, and there is no oversold reading below 30 either.
Combining the two tools, the picture has changed shape. The 50-day line rose from 0.0708 dollars in August to 0.0883 dollars on 11 October and has edged lower since, to 0.0872 dollars today. The 200-day line has held between 0.0879 and 0.0885 dollars since the start of October. With price just below two lines that almost touch, the market is undecided rather than stretched. For an entry that means the risk is defined by the range: 5.5 percent down to the October low of 0.0804 dollars, 13.7 percent down to the lowest close since August, and 8.1 percent up to the old trend level of 0.0920 dollars. None of this is timing advice; it is simply what the indicators describe.
What trading volume reveals about demand for Hedera
Over the past 24 hours HBAR turned over 88.5 million dollars, about 2.4 percent of its market capitalisation, against roughly 95 million dollars and 2.8 percent in August. The seven-day average stands at 104.3 million dollars, the 30-day average at 175.5 million. The latter still contains the days around the IBM jump: on 28 September alone 1.30 billion dollars changed hands, and on 29 September, when most of the gain was reversed, another 539 million. Since 13 October daily turnover has ranged from 62 to 199 million dollars, and the seven-day average sits 40.6 percent below the 30-day figure.
In August we wrote that the volume behaviour around the 0.0920 dollar line deserved closer attention than the price alone. It delivered a clear answer. The breakout above that line came on expanding turnover, 194 million dollars on 21 September and 241 million on 22 September, so the move was real buying, not a drift on an empty order book. The retreat in October happened mostly on calmer trading, with one exception: 199 million dollars on 18 October, the day many altcoins marked their lows. Volume confirms participation, not direction, and on HBAR the heaviest days of the autumn were split between buying and selling.
What structural factors speak for Hedera
Beyond the chart, Hedera's investment case rests on its design, its governance and its supply. The network uses a hashgraph consensus rather than a conventional blockchain and is governed by a council of large organisations, a structure aimed squarely at enterprise and institutional use. You can read the project's own description of the network and its token at hedera.com. The council website currently lists 33 names, among them Google, IBM, Dell, Deutsche Telekom and LG. Hitachi is no longer on it; an archived version of the page from 24 September still showed the company as one of 34 members, and neither side has given a reason. Our Hedera price prediction on Hitachi's exit weighs what that signal means.
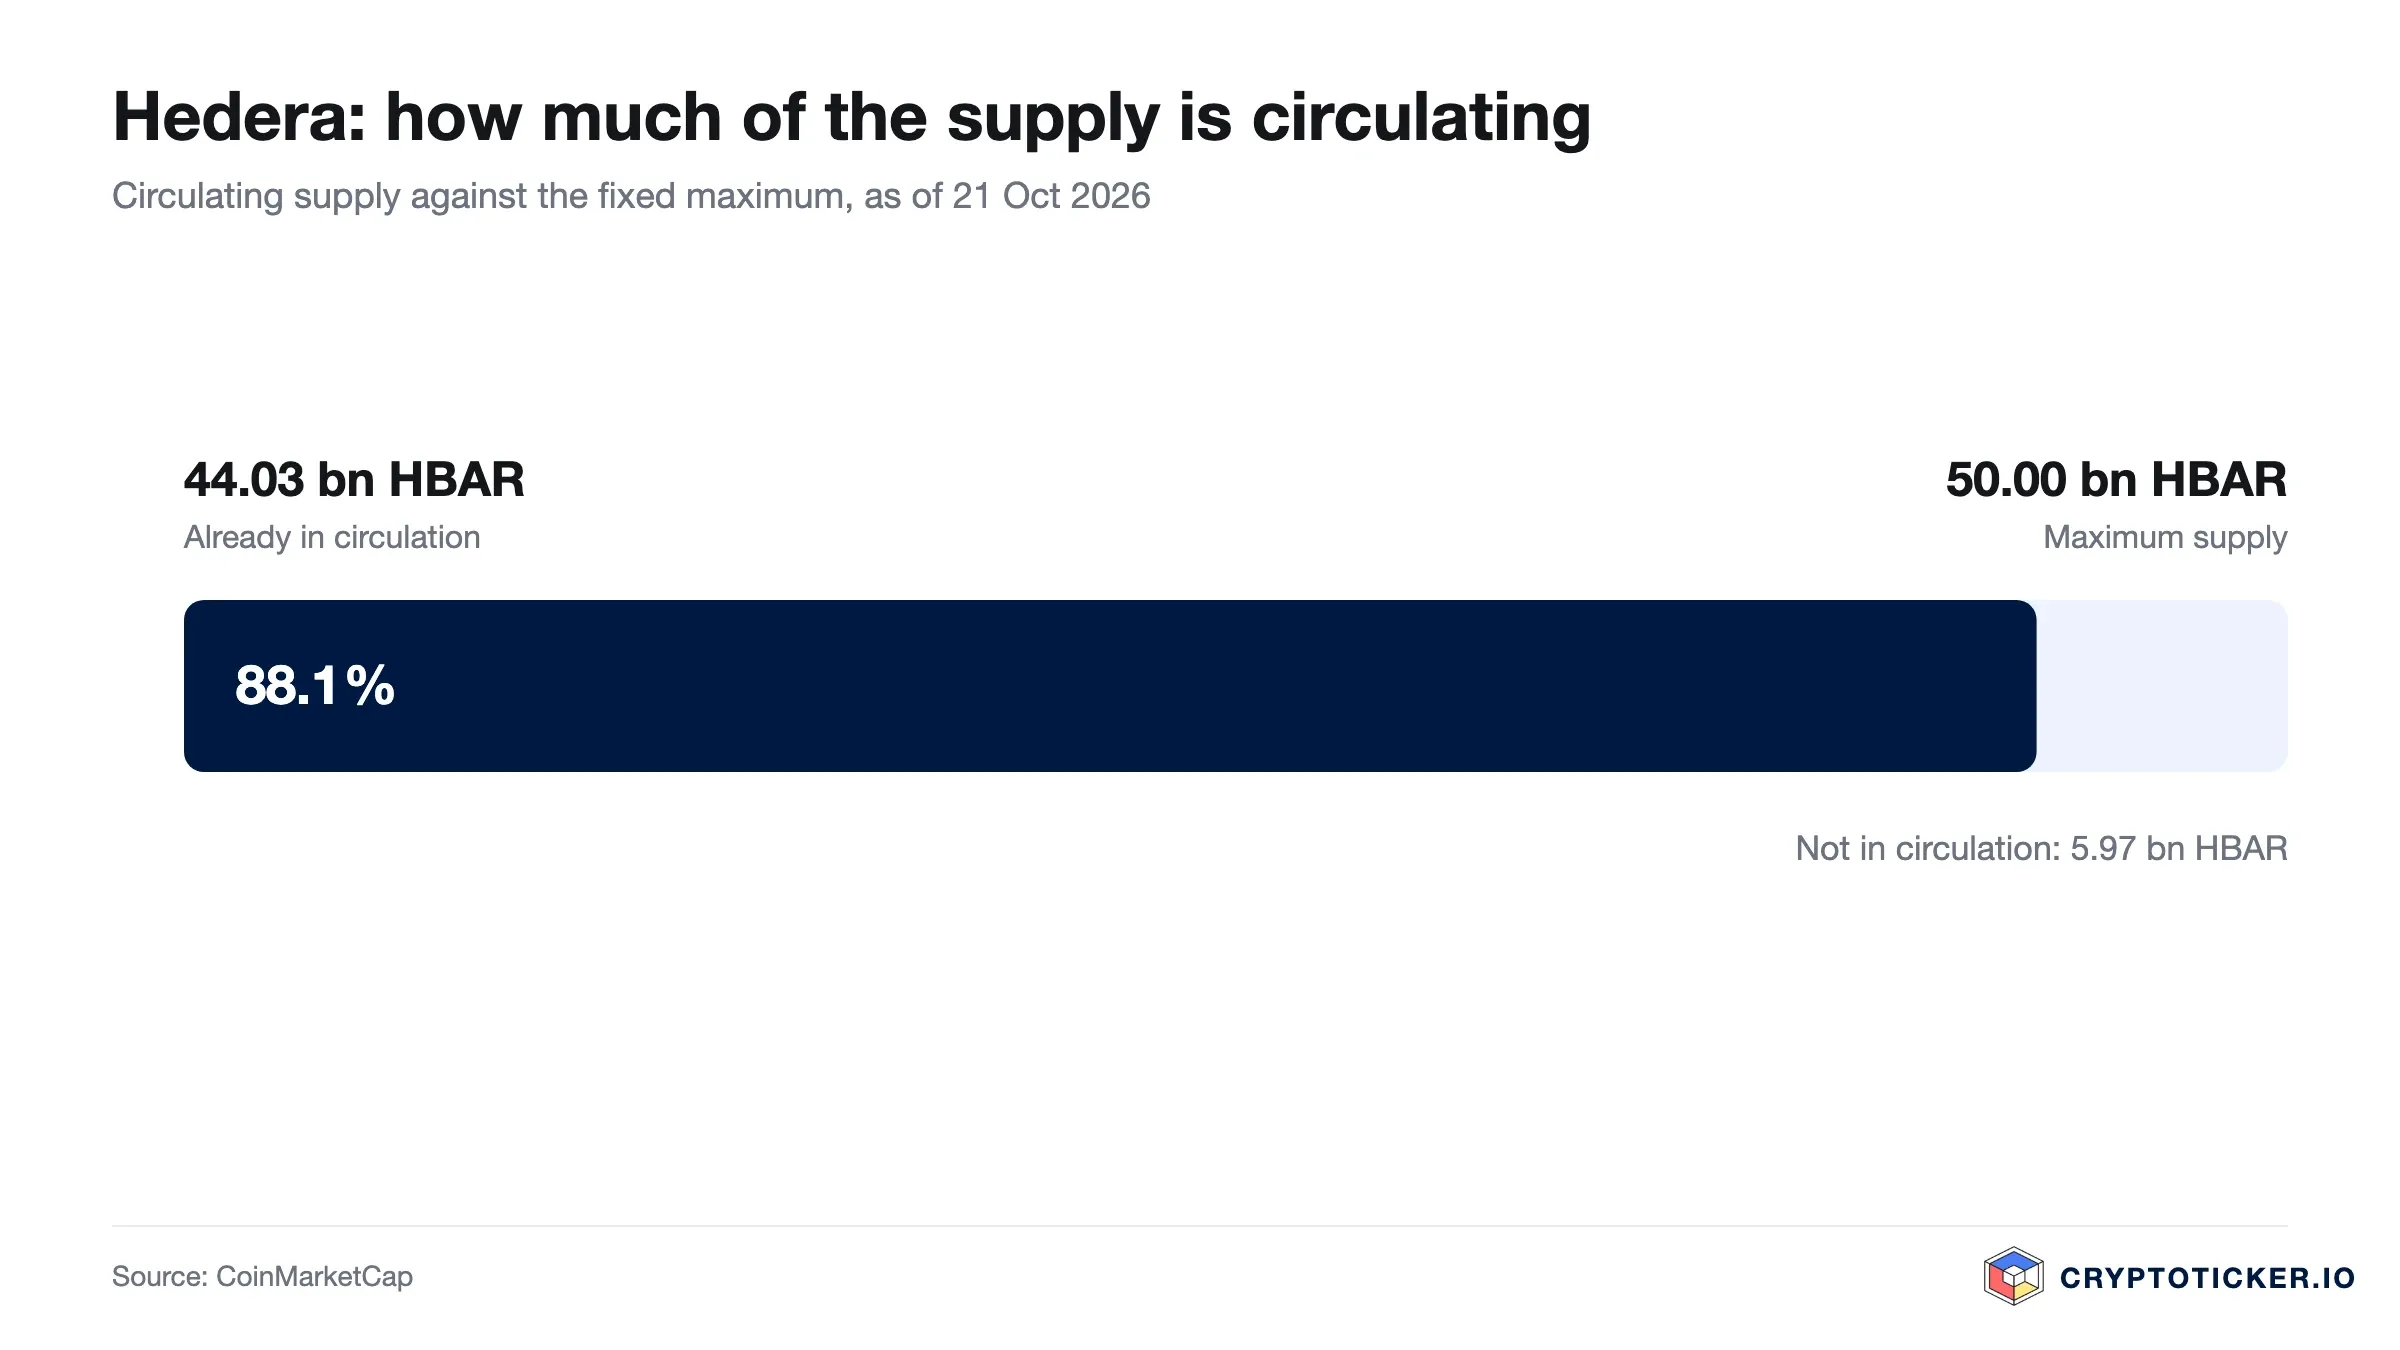
The token economics are unusually transparent. HBAR has a fixed maximum supply of 50 billion tokens, of which 44.03 billion now circulate, 88.1 percent of the total. Since our August assessment, when 43.8 billion were in the market, circulating supply has grown by 0.20 billion tokens, or 0.45 percent in under two months. For a long-term buyer, a hard cap and a high circulating share remain structural positives, because they limit the supply-side pressure that quietly erodes many crypto prices.
The bigger change since August is on the application side. IDTrust, The Hashgraph Group's identity platform for AI agents, devices and people, has been sold as a subscription through IBM's cloud catalogue since 23 September, alongside IBM Silver Partner status and a global Embedded Solution Agreement; customer numbers or revenue have not been published. On 8 October HashPack, by its own account used by around 90 percent of Hedera's monthly active users, switched on trading in tokenised Apple, Nvidia, Tesla and SPY shares, issued by Robinhood rather than by Hedera; what that means for holders is covered in our piece on HashPack's stock tokens. Stablecoins on Hedera jumped from 27.2 to 48.0 million dollars in one step on 3 October according to DefiLlama, and stood at 33.2 million on 21 October. Regulation is the other structural axis. Under the EU's MiCA framework, supervised by bodies such as ESMA, tokens with clear governance and disclosure stand on firmer ground in Europe than anonymous projects, a modest long-term tailwind rather than a near-term price driver.
What speaks for buying Hedera at the current price
Three points make the bull case at 0.0851 dollars concrete. First, the floor has held: intraday lows rose from 0.0643 dollars in August to 0.0720 dollars in September and 0.0804 dollars in October, and neither the reversal after the IBM jump nor the 8 October sell-off brought the price near the August low, which it now sits 31.7 percent above. Second, demand can return quickly when there is news: 27.1 percent in a day on 28 September on 1.30 billion dollars of turnover, with two concrete products on Hedera, IDTrust in IBM's catalogue and stock tokens in HashPack, that did not exist in August. Third, the supply picture is clean: a fixed 50 billion cap with 88.1 percent already circulating and growth of 0.45 percent since August limits future dilution.
Put together, the argument for buying is that you are accumulating a top-30 asset 57.7 percent below its highest close of the past twelve months, at a point where the averages have converged and the network has gained enterprise distribution it did not have two months ago.
What speaks against buying Hedera at the current price
The bear case is just as concrete. First, the breakout failed: since 12 October HBAR has closed below both averages, the 50-day line at 0.0872 dollars is still beneath the 200-day line at 0.0879 dollars, and over twelve months the token is down 50.1 percent. Second, news has not stuck: the IBM jump was fully reversed by 8 October, the HashPack launch was followed by a 7.7 percent drop on 12 October, Hitachi left the council without explanation, and most of the 3 October stablecoin inflow has left again. Third, HBAR lags its peers in a demanding macro backdrop: over 90 days it is up 18.8 percent, ninth of eleven large crypto assets excluding stablecoins and well behind Bitcoin's 29.7 percent, while the Federal Reserve raised rates to 3.75 to 4.00 percent on 16 September, its minutes of 7 October signalled another hike, and September consumer prices rose 3.7 percent. Bitcoin stood at 84,760 dollars on 21 October with a market share of 59 to 60 percent.
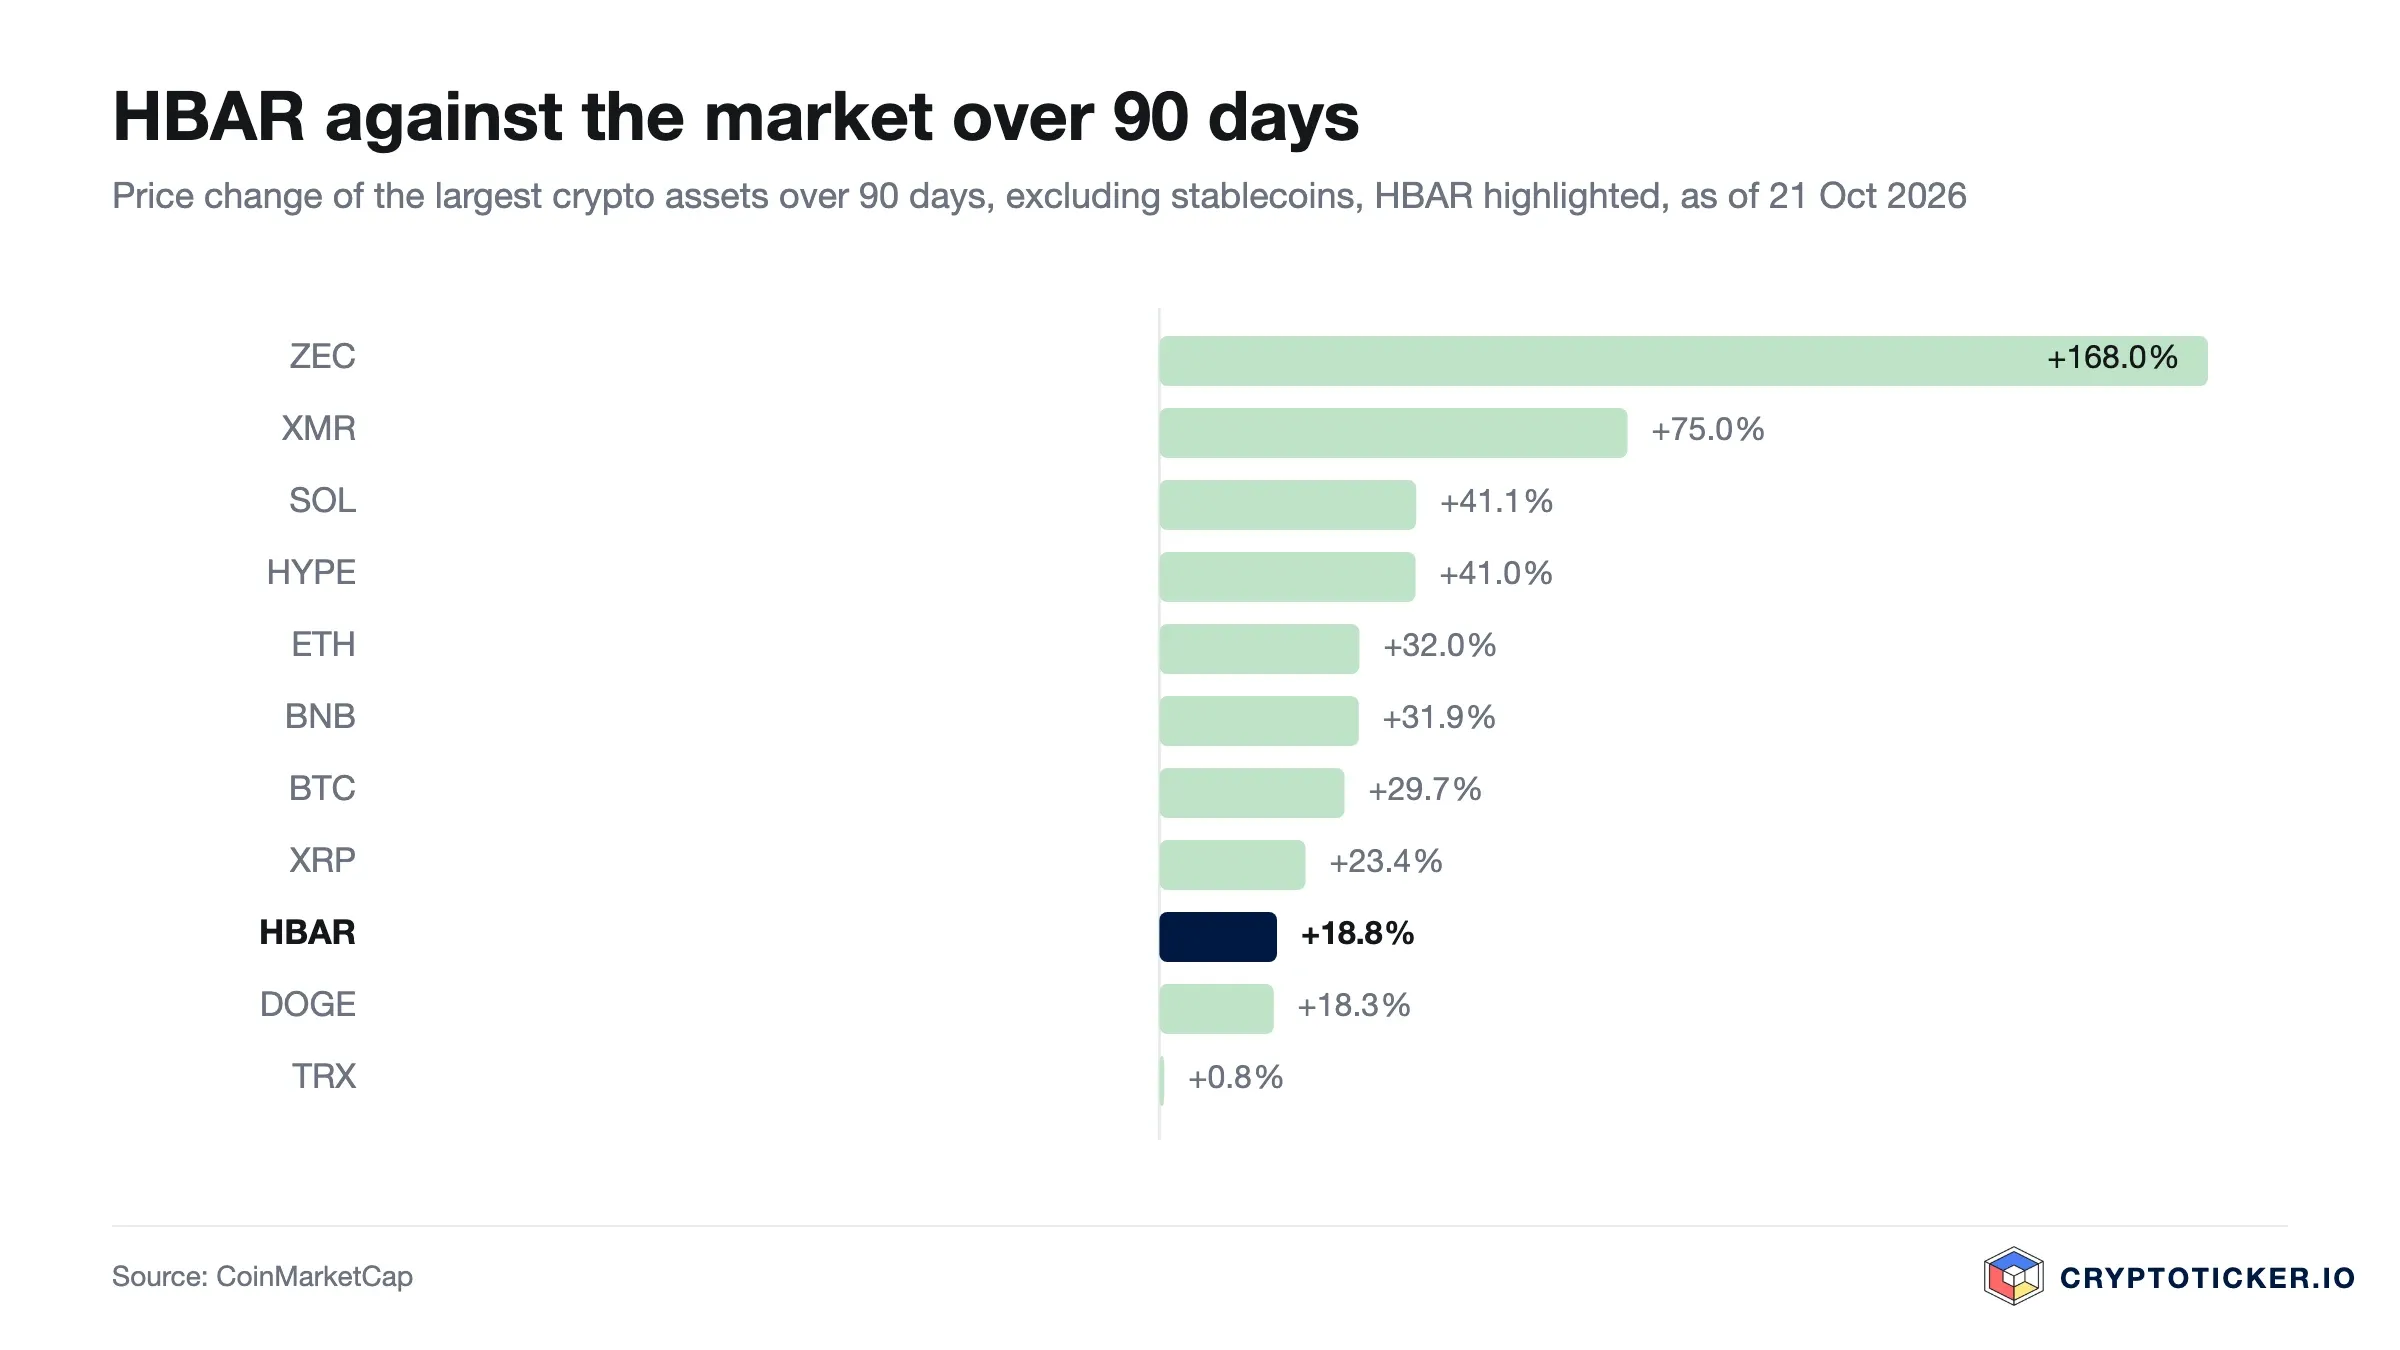
The sober reading is that buying here means buying a token that has already shown it can break out and fall back within three weeks, just below two converging averages, ahead of the Federal Reserve meeting on 27 and 28 October. That is a very different risk profile from buying a confirmed reversal.
How to buy Hedera (HBAR) at the current price
If you decide HBAR fits your plan, the practical steps are straightforward. HBAR is listed on most major exchanges, so the first choice is where to buy. Regulated European venues are the usual starting point; our crypto exchange comparison lays out fees and features side by side, and if regulation is your priority the comparison of regulated exchanges narrows the field further. For a specific venue, our Kraken review and Bitpanda review walk through account opening, fees and supported features in detail.
Costs matter more than they look. Watch the trading fee, the spread and any deposit or withdrawal charge, because on a small position these can quietly add up to several percent. On a day like 8 October, when 9.5 percent separated the high from the low, a market order fills at the next available price; a limit order sets the most you are willing to pay. For holding rather than trading, moving HBAR off the exchange into self-custody reduces counterparty risk; our hardware wallet comparison explains the trade-offs between convenience and security. If you would rather keep tokens on a platform and earn a yield, compare the terms first in our staking platform comparison, and remember that a higher advertised rate usually reflects higher risk.
So is Hedera a good buy at the current price?
The answer depends on your horizon, and both readings are scenarios, not recommendations. In the short term, at 0.0851 dollars, you are buying just below both averages inside a tight range: HBAR has traded between 0.0804 and 0.0894 dollars since 13 October, the RSI reads a neutral 44.3, and the Fear and Greed Index from CoinMarketCap shows 54, neutral as well, after a 60-day low of 48 on 17 October. The distances are 5.5 percent down to the October low, 5.1 percent up to the top of the range and 8.1 percent up to 0.0920 dollars. Our August caution against chasing the bounce was borne out by the pullback to 0.0720 dollars in September, and the next test on the calendar is the Federal Reserve meeting on 27 and 28 October.
Over a longer horizon, the case rests on whether the new distribution turns into measurable use. IDTrust in IBM's catalogue and stock tokens in HashPack are sales channels; figures on customers, transactions or network fees are not yet available, and the market priced the news in during September and out again in October. Reaching the 28 September close of 0.1219 dollars would take 43.2 percent, the highest close of the past twelve months at 0.2011 dollars 136.4 percent, while the supply side works only marginally against holders with 88.1 percent already circulating. Three conditions decide the thesis from here. A close below 0.0804 dollars, the 15 October low, would break the range and the sequence of higher lows. Several closes below 0.0734 dollars, the lowest close since August, would put the 0.0646 dollar low back in play, and losing that level on rising volume would still weaken the case as we set out in August. Conversely, several closes above the 200-day average at 0.0879 dollars plus a close above 0.0920 dollars on clearly rising turnover would mark a second attempt at a reversal, confirmed only once the 50-day average crosses the 200-day line from below.
Buying Hedera: what to take away
- The 200-day average at 0.0879 dollars is again the line to watch: HBAR broke above it in September and fell back on 12 October, a development our HBAR price prediction tracks in more detail.
- Mind the entry conditions: a neutral RSI of 44.3 and a range of 0.0804 to 0.0894 dollars argue for staggered buying over a single purchase, and the crypto exchange comparison helps you keep trading costs low whenever you do act.
- Match the venue to your goal: compare regulated platforms in the comparison of regulated exchanges for buying, and weigh self-custody in the hardware wallet comparison for holding.
Disclosure: Some of the providers mentioned in this article work with us through partner programmes. This has no influence on the price analysis or the assessment of the chart situation; the price data comes from a public market-data source and can be verified there.
(As of 22 October 2026, first version of 24 August 2026. This article is not investment advice. Prices, fees and conditions change; check them with the provider before every purchase. Crypto assets are subject to high price volatility, and a total loss is possible.)
Transparency note: This article was produced with the assistance of artificial intelligence and reviewed by our editorial team before publication. All figures and claims were checked against the primary sources linked in the text. The feature image was generated with AI.
Related articles
Which topics should we dive deeper into?
Select what genuinely interests you. Your picks feed directly into our editorial planning.
Crypto news that's actually worth your time.
Weekly. 60 seconds. Carefully curated by our editors: no hype, no promo flood, no spam.

May 13, 2026 11:02 AM

Is PEPE Coin worth Buying in 2026?
PEPE still holds both its 50 day and its 200 day average, while trading volume has slipped back below its yearly norm. What that means for anyone buying at current prices, and the two levels that settle it.
September 28, 2026 9:47 AM
XRP Price Drops Below $1.50: Where Is Ripple Heading This Week?
XRP price slips under $1.50 after a red weekend. Here is the XRP price analysis with the higher and lower targets that matter this week.

August 23, 2026 1:16 AM

Is PEPE a Good Buy at the Current Price?
PEPE has given up the 50-day moving average but still holds clearly above the 200-day line. Is the memecoin a good buy at the current price, or is the rally already running on thin volume?
August 24, 2026 12:50 AM
Is Bitcoin Cash a Good Buy at Current Prices?
Bitcoin Cash has held its summer gains but the rally has stalled: the price now sits right on its 50-day line with the RSI back to neutral and turnover halved. We work through what speaks for and against buying BCH at current prices.
August 24, 2026 12:34 AM

Is Monero a Good Buy at Current Prices?
Monero broke above the level we named in September as the test for a trend change. What the breakout, an overbought RSI and EU rules mean now: is Monero a good buy at current prices?
August 24, 2026 12:19 AM

Is Zcash a Good Buy at Current Prices?
Zcash has given back part of its September advance and now sits just above its 50-day average. We look at what the trend, the RSI and the turnover actually support, and under which conditions the case for buying ZEC breaks down.
August 3, 2026 10:41 AM
Is XRP Coin a Good Buy At Current Prices?
XRP trades at $1.29 and has lost both moving averages, with the 50-day EMA dropping back below the 200-day on 18 October. Why the $1.20 shelf now decides where the recovery finds its floor.

September 28, 2026 4:23 PM

Hedera Price Jumps 27 Percent: HBAR Outperforms the Market After the IBM Listing
HBAR has gained 27.3 percent within 24 hours while Bitcoin lost 1.8 percent. The trigger is the admission of Hedera's identity platform IDTrust to the IBM Cloud Catalog.
September 21, 2026 7:15 PM

Hedera Price Rises, but Volume Climbs Far Faster
HBAR gains about 12 percent while trading volume jumps 81 percent. The mainnet passes ten million accounts. What the figures say and where their limit lies.
October 25, 2026 6:33 AM

Hedera under pressure: can HBAR hold $0.077?
The spot fund on HBAR holds only $62.57 million, even though net inflows of $113.75 million have gone into it since launch. In November Hedera also switches over its data layer, and the price sits 8.8 percent below the level of the previous week.
October 21, 2026 12:33 AM
Is Worldcoin a Good Buy at Current Prices?
Worldcoin has reclaimed both of its moving averages, and the 50-day line has crossed above the 200-day line for the first time this year. Whether that makes WLD a buy depends on the locked supply and on whether demand holds.
September 20, 2026 9:21 AM

Is Ethena a Good Buy at Current Prices?
Ethena has rebounded hard off its twelve-month low and still trades far below its high. Is ENA a good buy at current prices? We check the chart, the supply schedule and the source of the yield with our own price data.
October 12, 2026 10:27 AM
Is Bitcoin Still a Good Investment in October 2026?
Spot ETFs have changed who sets the Bitcoin price, and the easy repricing is behind us. What still supports BTC, what could break it, and how much belongs in a portfolio today.
August 27, 2026 11:25 AM

Is Pump.fun a Good Buy at Current Prices?
PUMP now sits only just above its 50-day average and still trades below its twelve-month high. We check with our own price data what argues for and against buying Pump.fun at the current price.
August 27, 2026 6:38 AM

Is NEAR Protocol a Good Buy at Current Prices?
NEAR has nearly tripled since August, and the trend break we defined back then has happened. What ETF buying, leverage and issuance mean now: is NEAR Protocol a good buy at current prices?
August 27, 2026 6:23 AM

Is Bittensor a Good Buy at Current Prices?
Bittensor has passed the trend test we set in August: a weekly close above the 200-day average and a moving-average crossover in September. What the correction since the peak means: is Bittensor a good buy at current prices?
August 27, 2026 3:39 AM

Is Cronos a Good Buy at Current Prices?
Cronos has reclaimed its 200-day line for the first time since the spring, and the RSI is back out of overbought. We weigh what speaks for and against buying CRO at the current price.
August 26, 2026 4:21 AM

Is Uniswap a Good Buy at Current Prices?
Uniswap has gained about three quarters since August, and the trend test we set back then has been passed. What the fee switch, CME futures and the correction since September mean now: is Uniswap a good buy at current prices?
May 18, 2026 1:07 PM

Is Solana a Good Buy in 2026? SOL Price Analysis and Potential ROI
Solana (SOL) trades at $101.73 after clearing the $100 resistance. Here's how SOL's potential returns stack up against BTC, ETH, and XRP.
February 11, 2026 7:05 AM
5 Things to Look for BEFORE Buying Bitcoin
Thinking about entering the crypto market? Discover the 5 essential factors to check before you buy Bitcoin to secure your investment and strategy.
September 19, 2026 4:20 PM

Is Ondo a Good Buy at the Current Price?
Ondo holds its 200-day line, which the 50-day line crossed above in September, but the price has slipped back under the 50-day line. We examine the chart position, trading volume and supply mechanics, and set out what argues for and against buying the ONDO token.
August 31, 2026 11:20 PM

Is Mantle a Good Buy at Current Prices?
Mantle has rebounded hard from its summer low but still trades below its 200-day line, and nearly half the eventual supply has yet to reach the market. We weigh what speaks for and against buying MNT at the current price.
August 29, 2026 4:26 PM

Is Aster a Good Buy at Current Prices?
Aster sits above both moving averages and at the same time far below its high since listing. We assess whether the token is a good buy at the current price and why the supply still to be released remains the weightiest objection.
August 23, 2026 2:21 PM

Is Hyperliquid a Good Buy at Current Prices?
HYPE slipped below its 50-day average in October, triggering the test we set in September. What buybacks, team sales and leverage mean now: is Hyperliquid a good buy at current prices?
October 9, 2026 1:06 PM

Ethereum Price Under $2,500: Is ETH a Good Buy Right Now?
Ethereum has slipped below $2,500 and the question in every chat group is the same: buy the dip, or stay out? Here is what is driving the price, what the near-term levels are, and what the long-term forecasts actually assume.

July 17, 2026 7:55 PM
Is XRP a Good Investment in 2026? Price Analysis and Prediction
XRP has broken out of its summer range but has traded back below its 200-day average since 13 October 2026 — without the catalyst the market waited a year for. What the chart, the CLARITY Act and 2026 forecasts really say.

More from CryptoTicker