
Is Quant a Good Buy at the Current Price?
Quant climbed as high as 357 dollars after the bank mandate and has since fallen back sharply. Is QNT a good buy at the current price? We check the chart, volume, the banks' timetable and the token's role with our own data.


Which topics should we dive deeper into?
Select what genuinely interests you. Your picks feed directly into our editorial planning.
Crypto news that's actually worth your time.
Weekly. 60 seconds. Carefully curated by our editors: no hype, no promo flood, no spam.
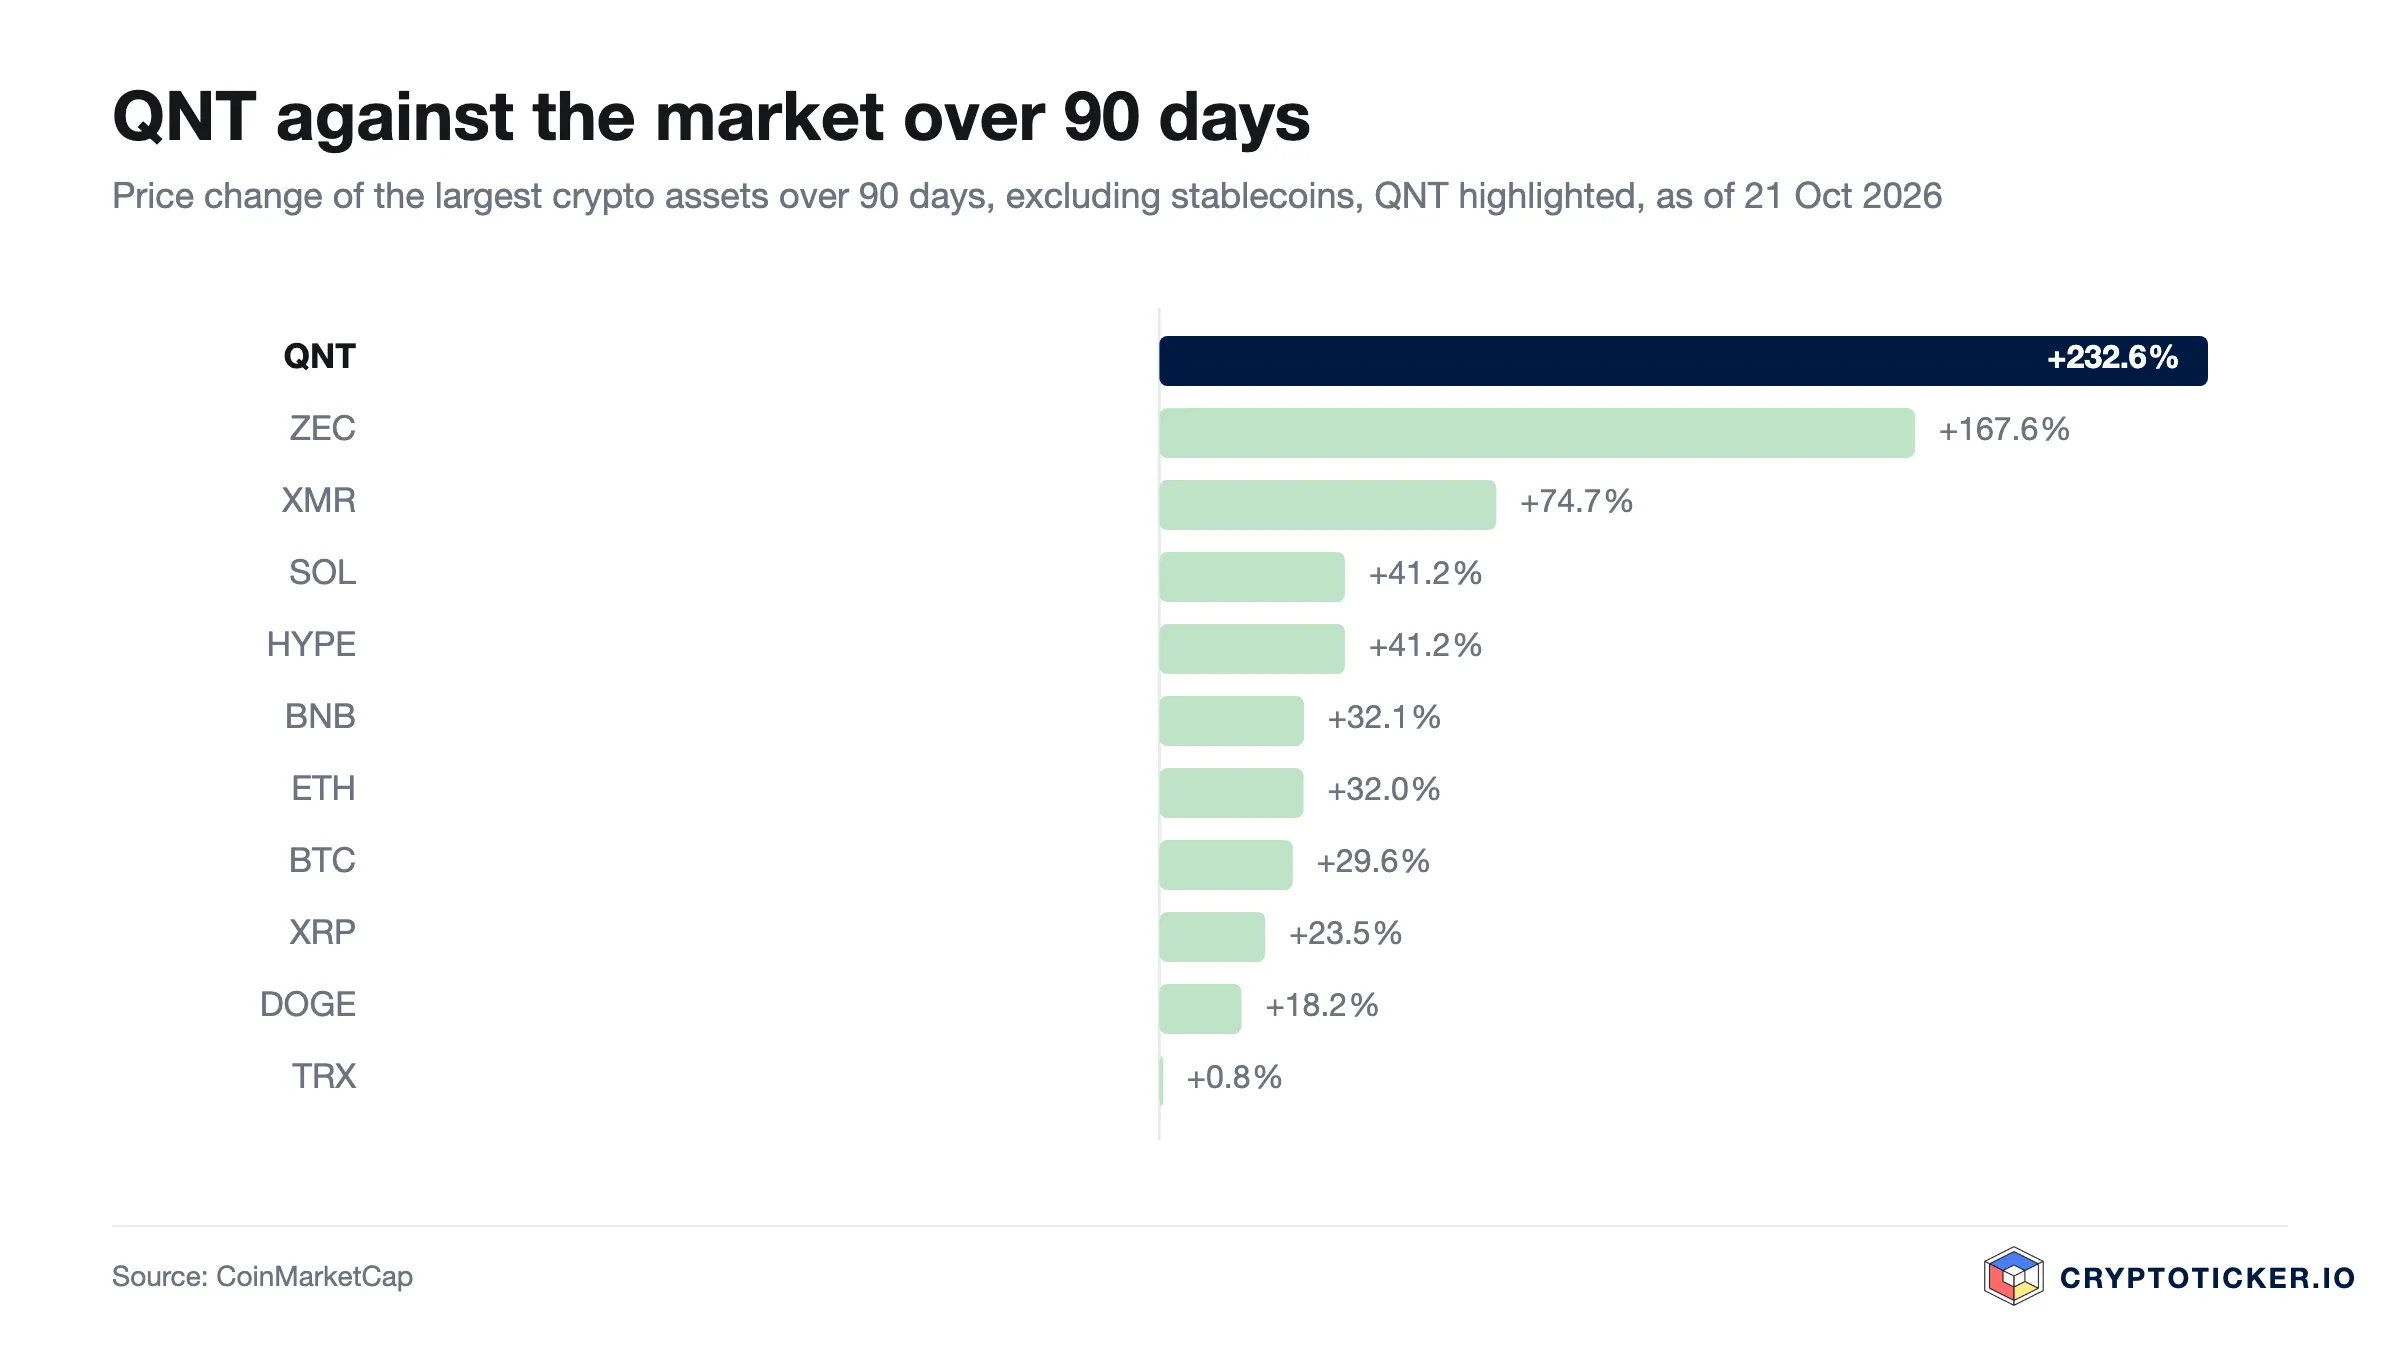
Quant (QNT) is trading at 210.89 US dollars late on Wednesday evening, 21 October 2026, up 7.2 percent in 24 hours. Since our first assessment on 27 September, the price has completed a full swing: during trading on 27 September it briefly reached 357.00 dollars, posted its highest daily close of 286.38 dollars on 30 September and fell to a low of 182.24 dollars by 18 October. Today QNT stands 40.9 percent below the peak and 15.7 percent above the October low. The question is the same, the answer has shifted: is Quant a good buy at the current price?
Which coins make our watchlist this month, and why, is set out in our monthly updated list of the best crypto to buy now.
cryptoticker.io collected the price data itself on 21 October 2026, from CoinMarketCap market data. The calculation is based on the daily closing prices of the past twelve months with the live price as the last data point; the moving averages follow the standard exponential formula, the Relative Strength Index the standard period of 14 days. The table sets the figures from our first analysis on 27 September alongside.
| Metric | 27 September 2026 | 21 October 2026 |
|---|---|---|
| Price | $224.13 | $210.89 |
| 50-day average | $66.43 | $167.86 |
| 200-day average | $68.96 | $104.11 |
| Distance to the 200-day line | +225% | +103% |
| Relative Strength Index (14 days) | 95.0 | 54.5 |
| Trading volume, 24 hours | $777.5m | $95.2m |
| Market capitalisation | $2.71bn | $2.55bn |
Quant price analysis: where the QNT price stands now
At 210.89 dollars, Quant trades 25.6 percent above its 50-day average of 167.86 dollars and 102.6 percent above its 200-day average of 104.11 dollars. The distance to the 200-day line has more than halved in just over three weeks, and in two ways at once: the price has come back, and the averages have caught up because the September jump has entered their calculation.
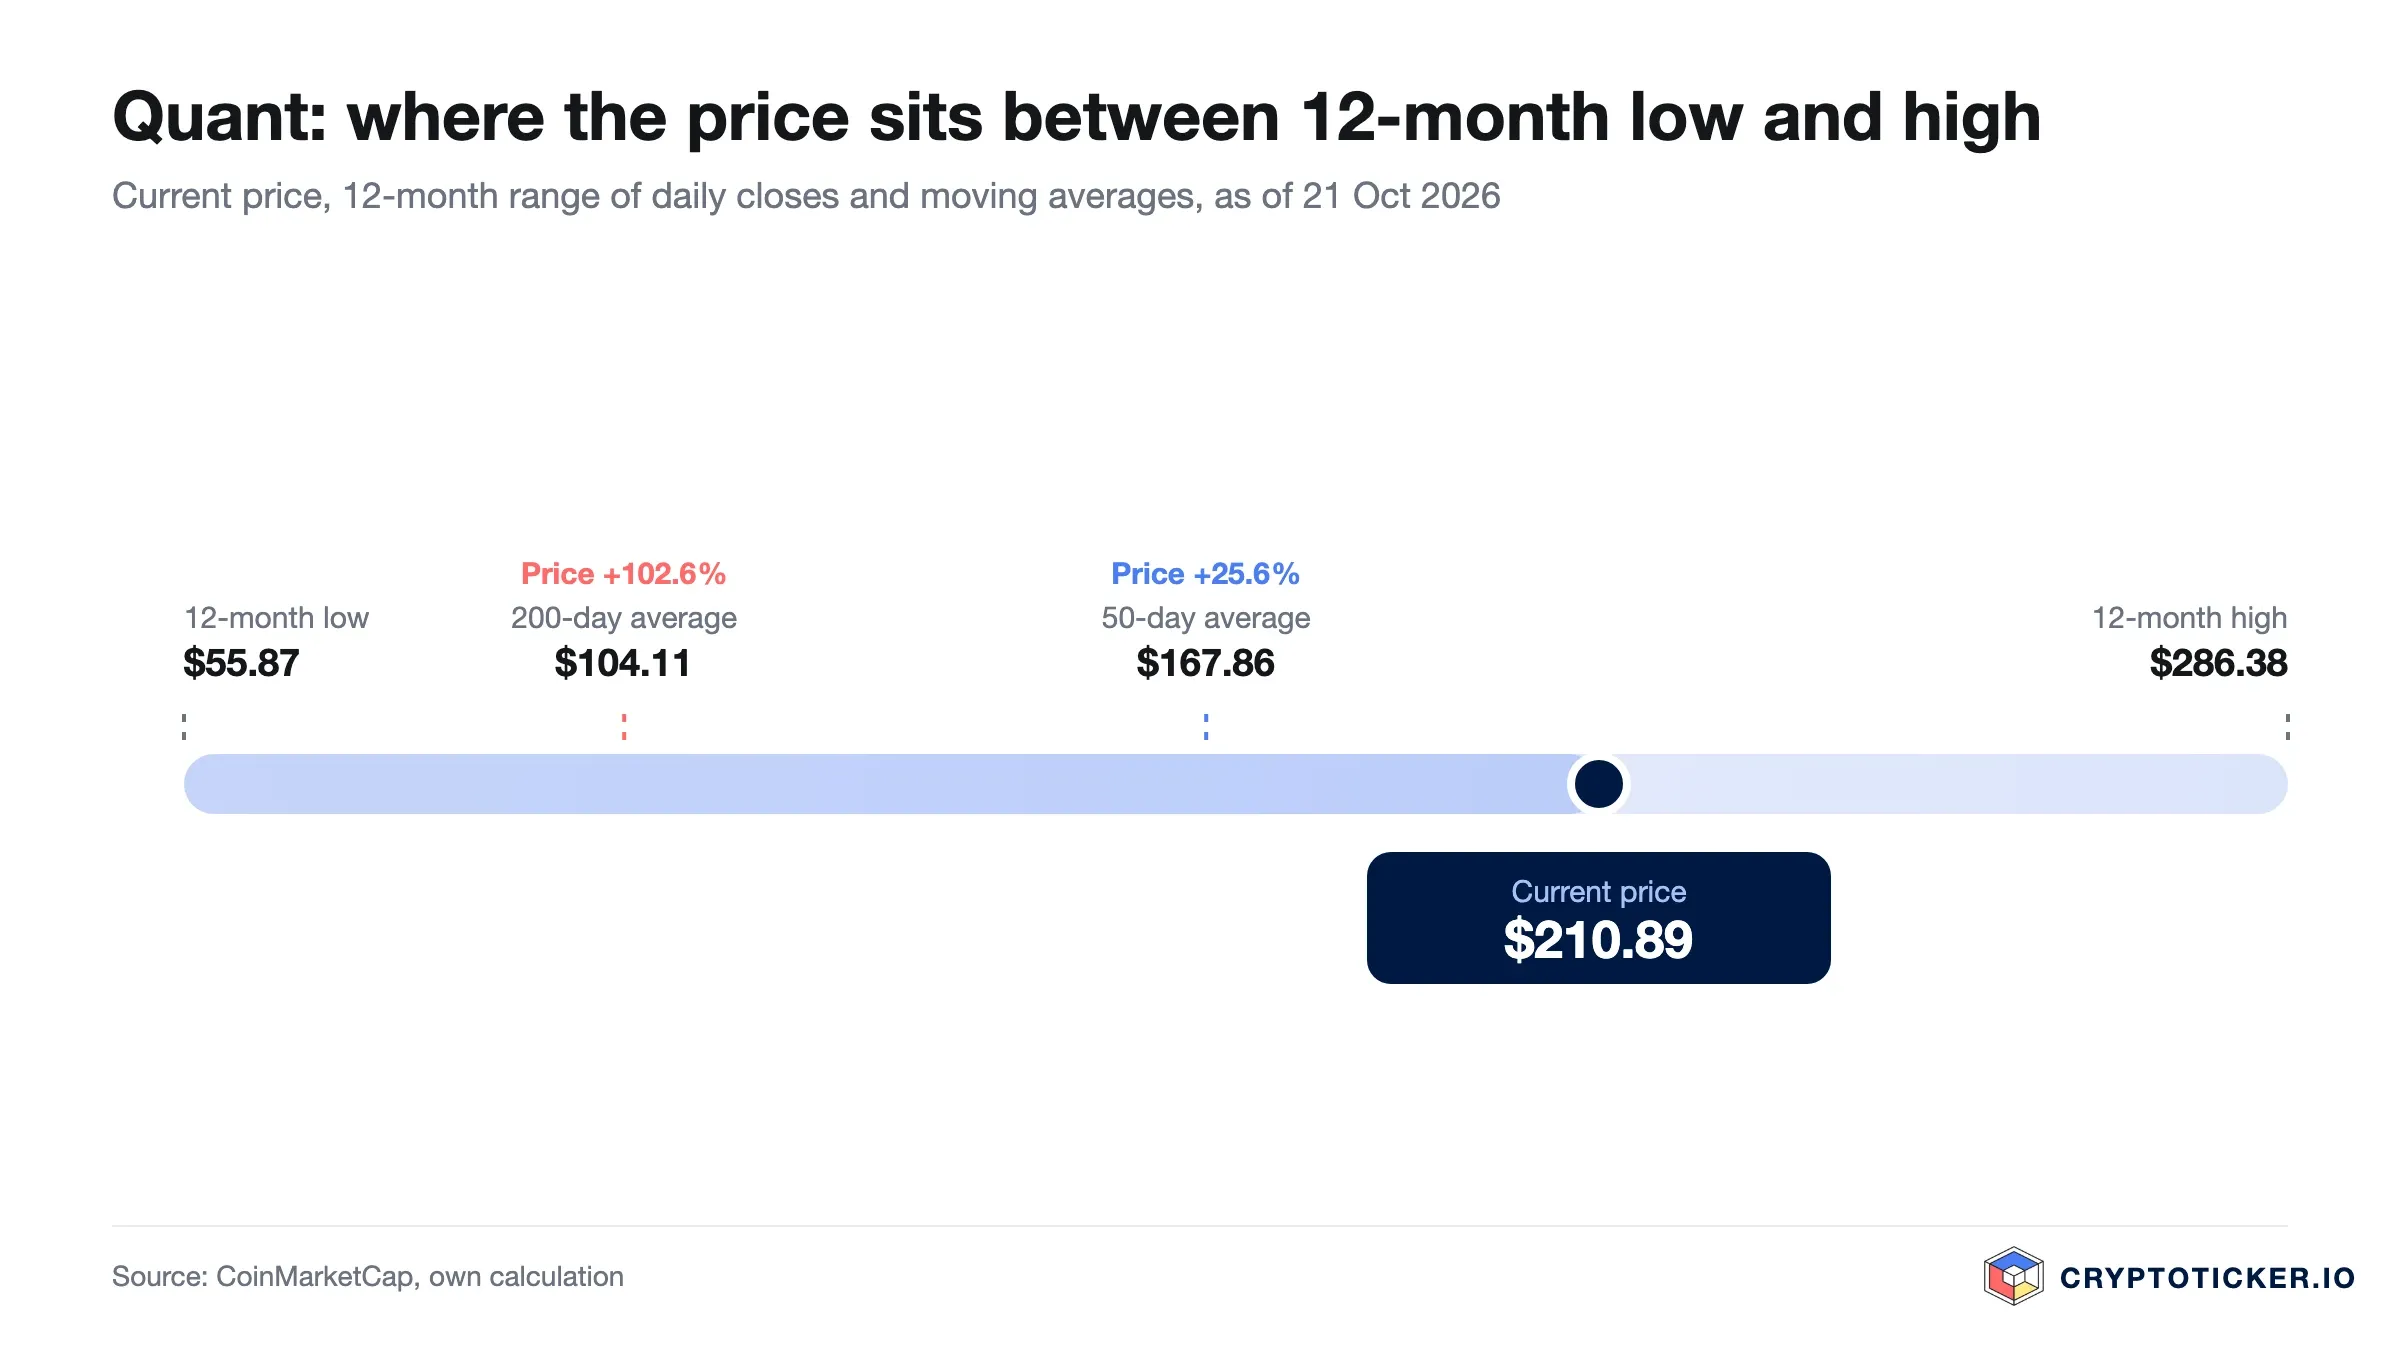
Four zones now define the picture. Above, the range between 221 and 277 dollars in which Quant moved during the first half of October and which the price left to the downside on 13 October; above that, the highest daily close of 286.38 dollars. Below, the October low of 182.24 dollars, the 50-day average around 168 dollars and finally the area between 104 and 107 dollars, where the 200-day average and the old twelve-month high of 106.64 dollars from October 2025 almost coincide.
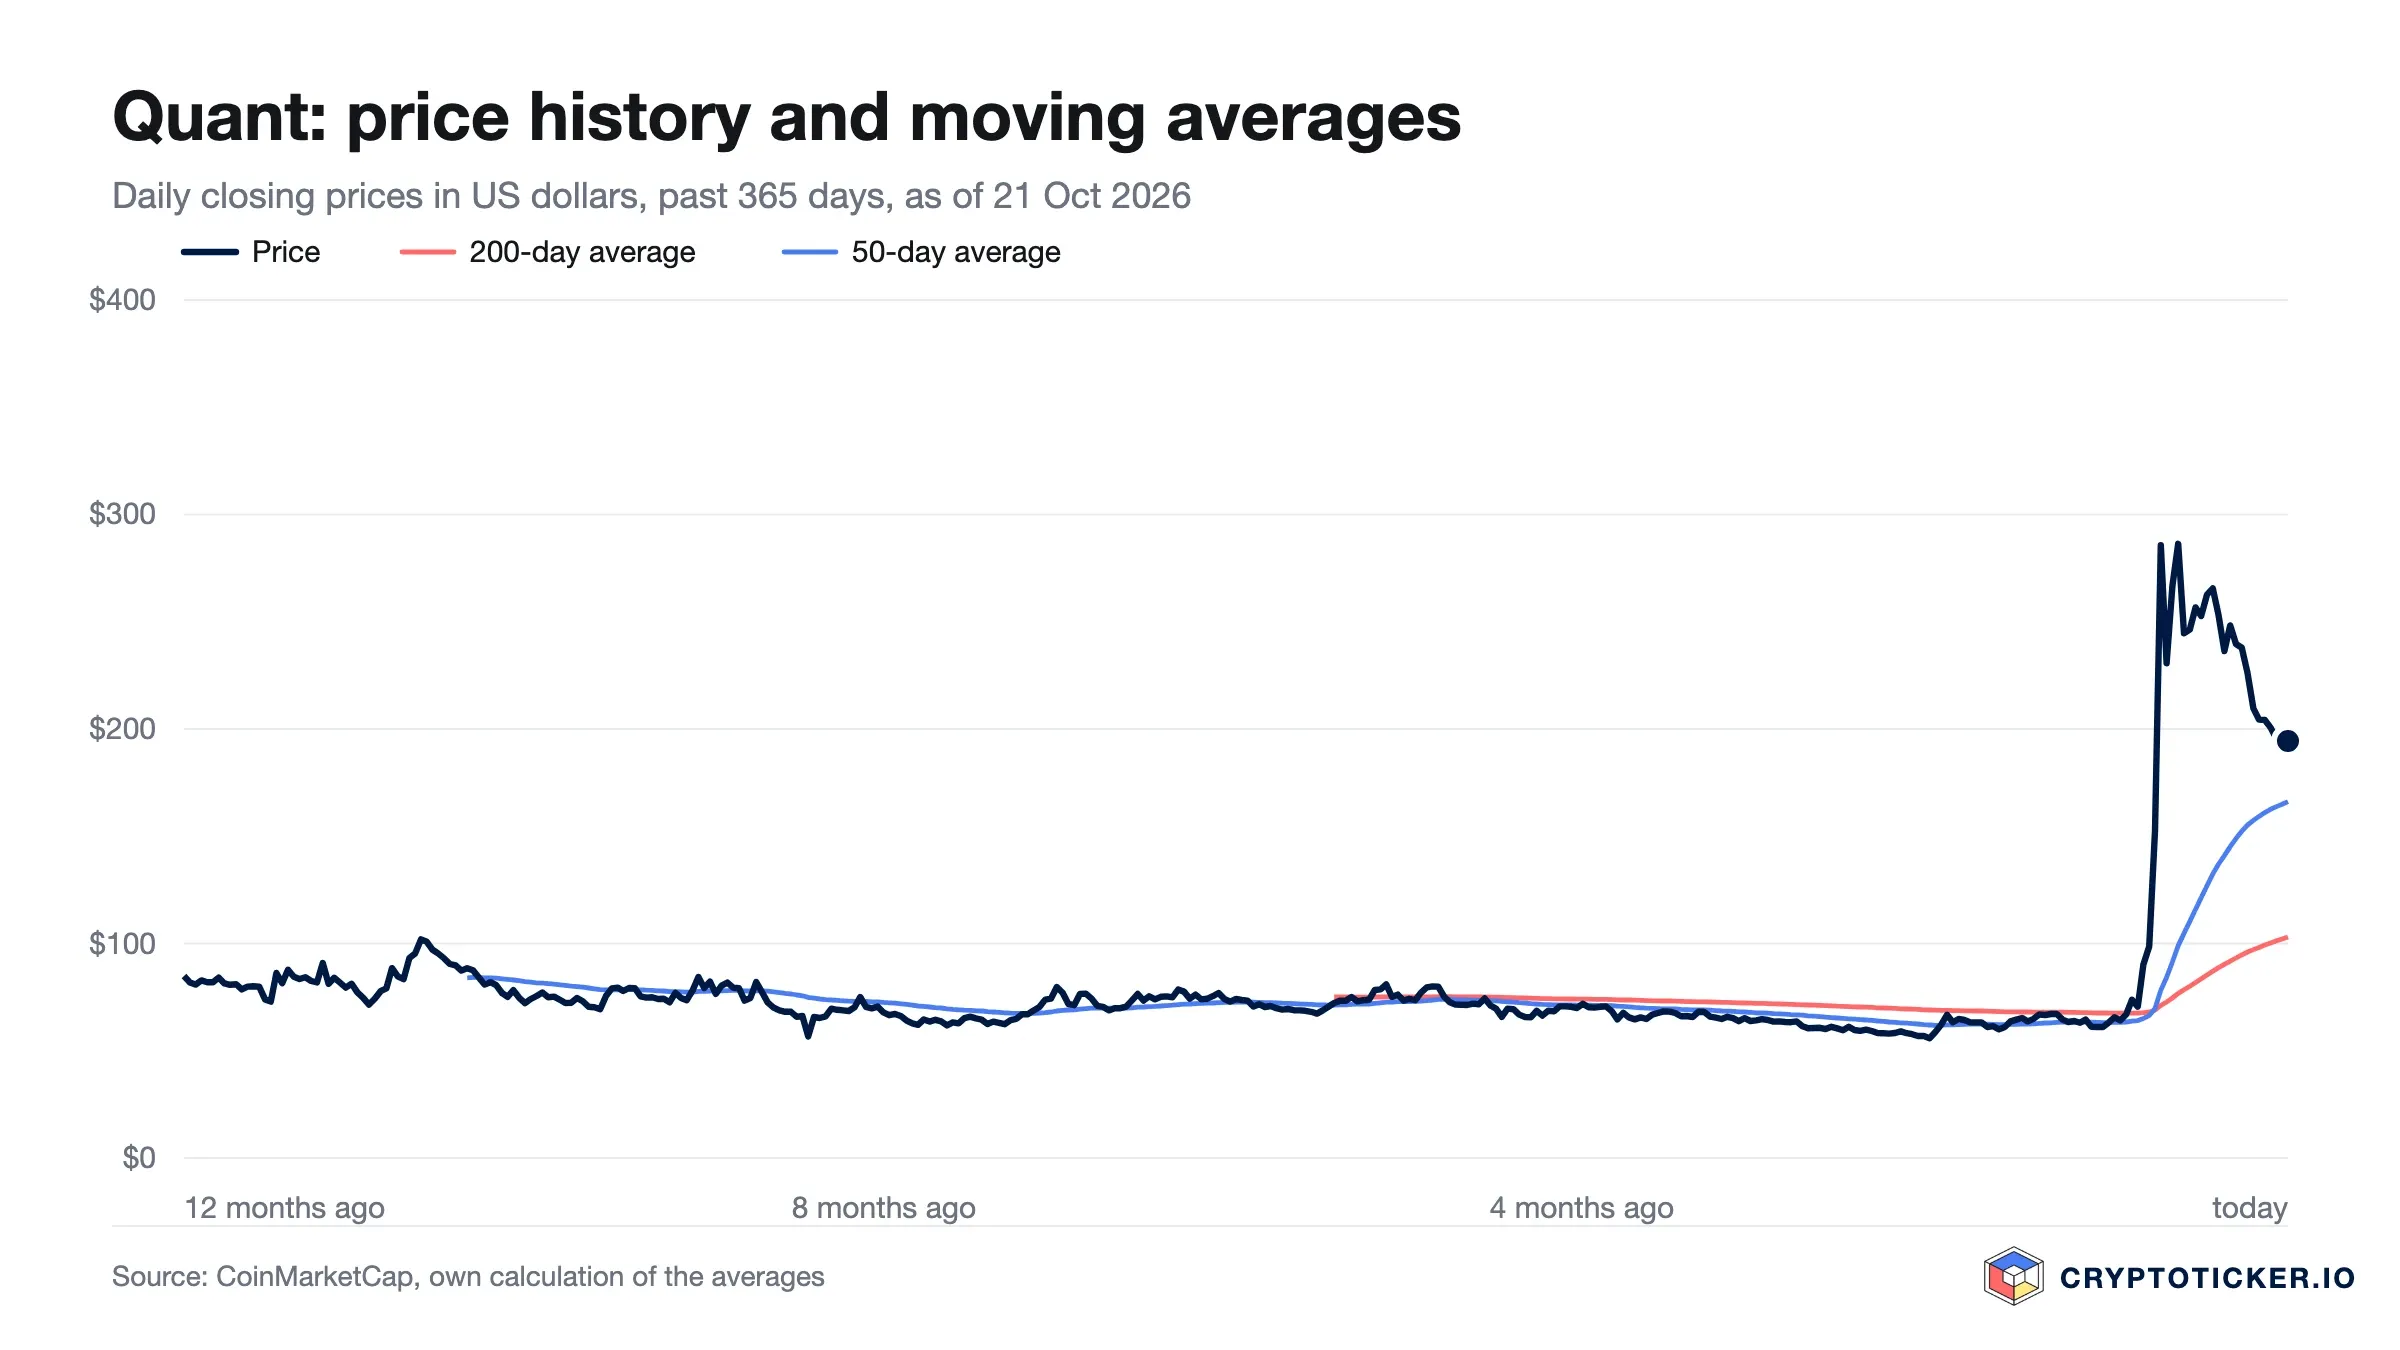
Has Quant's downtrend been broken or merely interrupted?
On 27 September we set out a testable yardstick here: a trend reversal counts as confirmed if the price stays above the old twelve-month high of 106.64 dollars after the first pullback. That pullback has now happened. It ran from the intraday high of 357.00 dollars to 182.24 dollars, a fall of 49 percent, and ended 71 percent above the level at which the question would have been decided. By that yardstick, the break of the long downtrend is confirmed.
Over one year the picture is clear: a year ago QNT cost 84.88 dollars, today it is 148.5 percent higher. In the short term the opposite applies. Since 4 October Quant has formed a sequence of lower highs, from 277 dollars via 255 and 231 to 199 dollars on 18 October. Since then the price has steadied around 190 dollars, and today's rise is the first serious attempt to break that sequence. It would only be confirmed by a daily close above 221 dollars, the lower edge of the abandoned October range.
What RSI and moving averages mean for buying Quant
The 14-day Relative Strength Index stands at 54.5. On 27 September it was 95.0, at the upper limit of what is possible. The indicator is scaled from 0 to 100; readings above 70 count as overbought, readings below 30 as oversold. A value around 55 describes a market without excess in either direction: the overheating of September has worked itself off.
Two things follow. First, buying today is no longer buying into a running euphoria, as it was at the end of September. Second, the distance to the 200-day average remains large at a little over 100 percent. It closes when the price falls or when it holds still for weeks while the average catches up. Since 27 September both have happened at the same time. Whether the market has finished digesting the news jump will show at the 50-day average of 168 dollars: if the price holds it on another pullback, that points to a new valuation base.
What trading volume reveals about demand for QNT
Trading volume over the past 24 hours stands at 95.2 million US dollars, and at 95.6 million on average over the last seven days. On 27 September it reached 1.19 billion dollars in a single day; before the bank mandate, normal daily turnover was around 10 million. Volume has therefore fallen by more than nine tenths from its peak, yet it still sits at roughly nine times the former normal level.
The ratio of volume to market capitalisation is more telling: at 2.55 billion dollars it gives a turnover factor of 0.04, against 0.29 at the end of September. That suggests the short-term money from news buying and short covering has largely left the market. What remains is demand that sits clearly above the level before the mandate but no longer produces spikes.
For execution this means the order book is thinner than in the peak phase but deeper than before the mandate. Daily ranges last week were between 6 and 11 percent, and larger orders still move the price noticeably. Anyone looking to build or reduce a larger position should compare trading venues, for example in our exchange comparison.
Which structural factors speak for Quant
The trigger for the move is well documented. The Clearing House, the operator of the RTP and CHIPS payment systems backed by large US banks, selected Quant on 24 September 2026 as technology partner for its On-Chain Money Initiative. Quant provides the interoperability, orchestration and transaction management layer of a network through which banks settle tokenised deposits. According to its own information, The Clearing House is owned by 25 of the largest financial institutions in the US; its June announcement names 17 participating institutions, including Bank of America, Citi, J.P. Morgan Payments and Wells Fargo. The full background is in our article on Quant and tokenised deposits.
Since the mandate, the timetable has become more concrete. The head of The Clearing House has described four stages: selection of the technology partner, design and integration with the banks in autumn 2026, preparation of the first institutions in the first quarter of 2027 and live transactions in the second quarter of 2027. The first stage is complete, the second is under way.
The technology behind it is Overledger, Quant's enterprise platform, and, since 2 June 2026, the Fusion rollup on mainnet, which according to the company connects 74 blockchain networks in one environment. What it does and what of that is documented is explained in our article on Quant Fusion. Since March 2026 there has also been a partnership with the software house Murex, whose platform runs trading and post-trade processing at many banks.
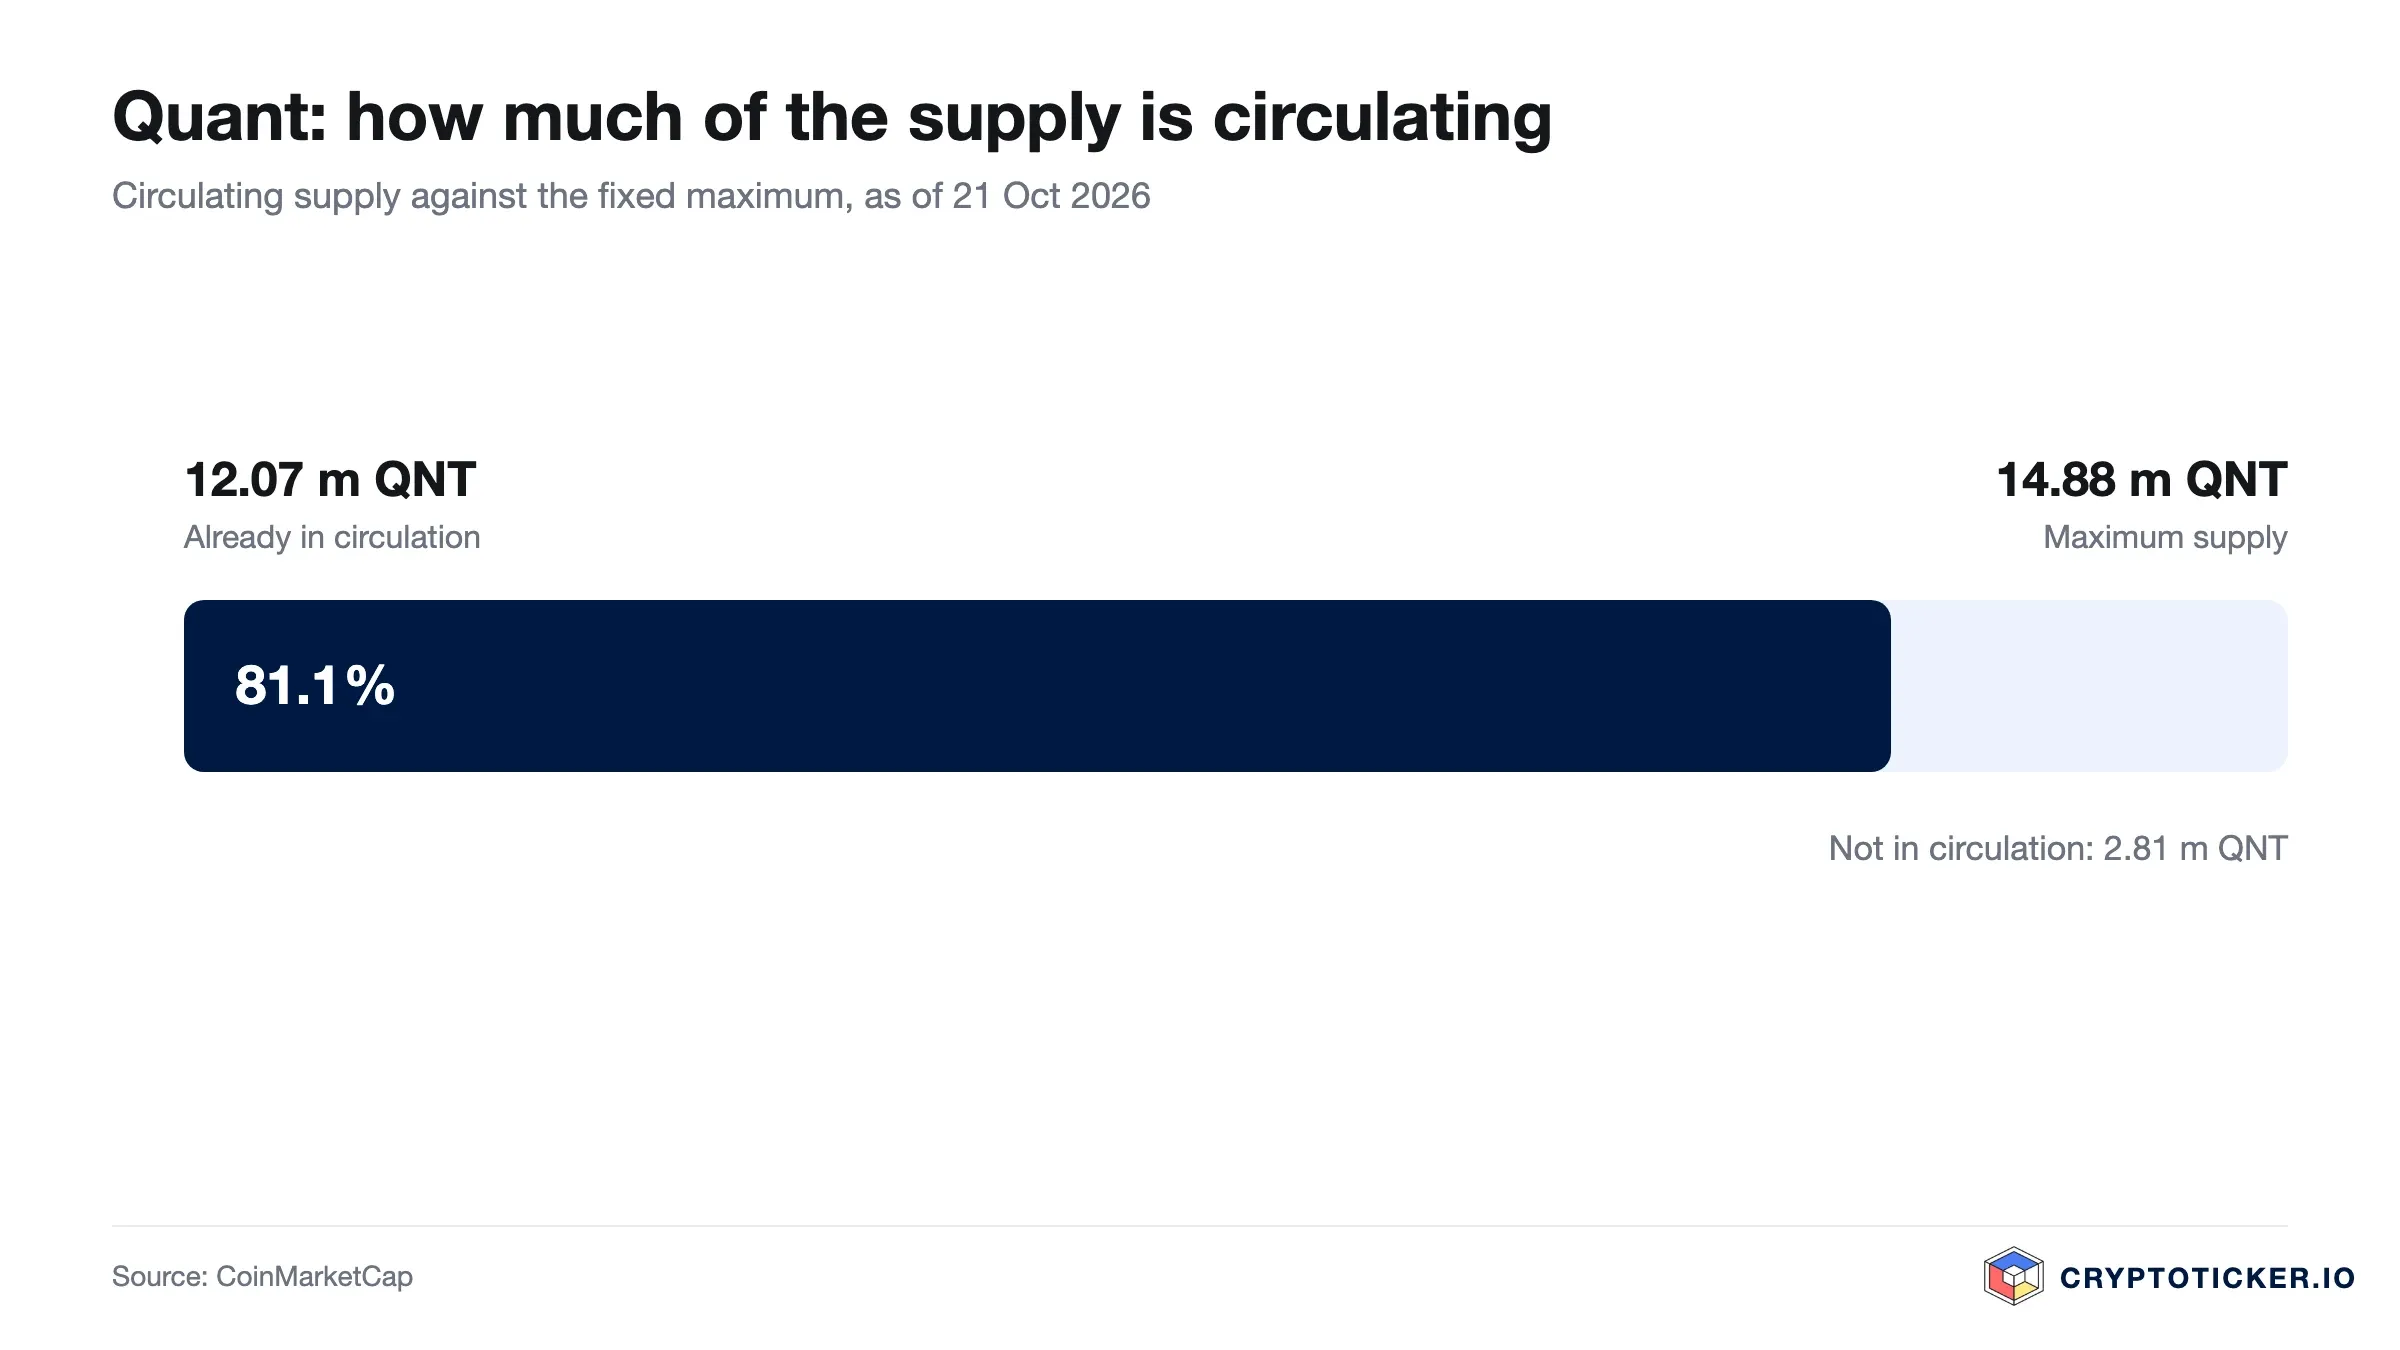
On the supply side the mechanics are straightforward. Of a maximum of 14,881,364 QNT, 12,072,738 are in circulation, or 81.1 percent, and no new tokens are created. The market capitalisation of 2.55 billion dollars is accordingly close to the fully diluted valuation of 3.14 billion dollars.
The most important open question from September can now be answered more precisely. The QNT token is an access right: the annual Overledger licence of 100 pounds has been payable in QNT since December 2021. However, the same token transparency report that Quant filed with the research portal Blockworks also allows platform fees to be paid in US dollars. QNT carries no voting rights, there is no protocol treasury, and fees flow as revenue to Quant Network Ltd. Business growth therefore does not automatically translate into demand for the token. The details are in our analysis of what the QNT token is used for. The European supervisory framework is documented by the securities regulator ESMA.
What speaks for buying Quant at the current price
First, the mandate is verifiable and its timetable provides milestones. With the selection by the operator of the major US payment systems, the first of four stages is done; the next visible test comes in the first quarter of 2027, when the first institutions are due to be connected.
Second, anyone buying today is no longer buying at the height of an excess. The Relative Strength Index has fallen from 95.0 to 54.5, the price is 40.9 percent below the peak of 27 September, and the first major pullback held far above the breakout zone of 106.64 dollars.
Third, the supply mechanics remain favourable. The cap is fixed, 81.1 percent of tokens are in circulation, and there is no ongoing issuance of new tokens to dilute every recovery.
What speaks against buying Quant at the current price
First, the short-term trend points down. Since 4 October Quant has been forming lower highs, the range between 221 and 277 dollars has been left to the downside, and volume has fallen by more than nine tenths from its peak. Today's rise only changes that if the price closes above 221 dollars.
Second, the economic link between the business and the token is thinly documented. The licence can also be paid in dollars, its amount is small, and revenue from the bank mandate accrues to Quant Network Ltd. According to the transparency report, the tokens held by the company are also freely transferable. A valuation of 2.55 billion dollars therefore rests largely on an expectation.
Third, hard interim results are lacking until the first quarter of 2027. Neither a list of the institutions taking part at launch nor pricing or a regulatory approval has been published. Integration work between banks produces little news, and without news the price lacks the drive that carried it in September.
How you can buy Quant at the current price
QNT is listed on the larger European trading platforms. For investors in the EU, providers that fall under European crypto regulation are particularly relevant; an overview is given in our comparison of the best regulated crypto exchanges.
Three items count towards the cost. The trading fee is usually between 0.1 and 1.5 percent depending on provider and order type. On top comes the spread between buy and sell price, which widens noticeably in volatile phases with a thin order book, and finally deposit and withdrawal fees. How this adds up is shown in our reviews of Bitpanda and Kraken.
On execution: with daily ranges of 6 to 11 percent, a market order fills at the next best available price, which can deviate noticeably from the one displayed. A limit order sets the maximum price you are willing to pay.
On custody: holdings left on an exchange remain in someone else's care. Anyone planning larger amounts or longer holding periods should hold the keys themselves; the device options are covered in our hardware wallet comparison.
So is Quant a good buy at the current price?
In the short term, over days to a few weeks, the price of 210.89 dollars is a considerably more balanced entry point than on 27 September. The overheating has worked itself off, but the trend since early October points down. The October low of 182.24 dollars is 13.6 percent away, the highest daily close of 286.38 dollars 35.8 percent. Buying now therefore mainly means buying the assumption that the October low holds.
In the long term, over quarters, the answer depends on two questions. First: will The Clearing House's timetable hold, and will the first institutions be visibly connected in the first quarter of 2027? Second: do customers actually pay for Overledger and Fusion in QNT, or do they choose the dollar route? The first can be checked from January against announcements by The Clearing House and the banks, the second only against figures from Quant, which do not exist so far.
This assessment is refuted if one of three things happens. First: Quant closes below 182 dollars; the base after the pullback is then broken, and the 50-day average around 168 dollars becomes the next test. Second: The Clearing House postpones the launch beyond the second quarter of 2027, or Quant loses its role in it. Third, in the other direction: Quant discloses a documented mechanism that ties revenue from the network to purchases of QNT.
The price targets we derive from this for Quant, in three scenarios and with disclosed weighting, are in our Quant price prediction.
Buying Quant: what to take away
- The trend break has passed its first test: the pullback ended at 182.24 dollars, far above the old twelve-month high of 106.64 dollars. In the short term, what matters now is whether the price gets back above 221 dollars. Suitable charting tools are offered by the platforms in our exchange comparison.
- The open question is demand for the token, not the quality of the mandate: the Overledger licence can be paid in QNT, but also in dollars. The background is in our analysis of the QNT token.
- If you buy, settle execution and custody beforehand. With daily ranges of up to 11 percent, the limit order is the standard tool; for longer holding periods, self-custody follows, covered in our hardware wallet comparison.
Disclosure: Some of the providers mentioned in this article work with us through affiliate programmes. This has no influence on the price analysis or the assessment of the chart; the price data comes from a public market data source and can be verified there.
(As of 21 October 2026, first version of 27 September 2026. This article is not investment advice. Prices, fees and conditions change; check them with the provider before every purchase. Crypto assets are subject to high price fluctuations, and a total loss is possible.)
Transparency note: This article was produced with the assistance of artificial intelligence and reviewed by our editorial team before publication. All figures and claims were checked against the primary sources linked in the text. The feature image was generated with AI.
Related articles
Which topics should we dive deeper into?
Select what genuinely interests you. Your picks feed directly into our editorial planning.
Crypto news that's actually worth your time.
Weekly. 60 seconds. Carefully curated by our editors: no hype, no promo flood, no spam.

May 13, 2026 11:02 AM

Is PEPE Coin worth Buying in 2026?
PEPE still holds both its 50 day and its 200 day average, while the past month has gone sideways and weekly turnover has picked up again. What that means for anyone buying at current prices, and the two levels that settle it.
September 28, 2026 9:47 AM
XRP Price Drops Below $1.50: Where Is Ripple Heading This Week?
XRP price slips under $1.50 after a red weekend. Here is the XRP price analysis with the higher and lower targets that matter this week.
November 3, 2026 8:59 AM
Ethereum Price Below $2,300: Is $2,000 Next or Is This the Bottom?
Ethereum price slips toward $2,250 as $3 billion leaves DeFi. Whales are buying the dip. Does ETH hold $2,200 or test $2,000 next?

August 23, 2026 1:16 AM

Is PEPE a Good Buy at the Current Price?
PEPE is holding the 50-day moving average and sits clearly above the 200-day line, with weekly volume picking up again. Is the memecoin a good buy at the current price, or has the rally already run?
August 24, 2026 12:50 AM
Is Bitcoin Cash a Good Buy at Current Prices?
Bitcoin Cash has held its summer gains but the rally has stalled: the price now sits right on its 50-day line with the RSI back to neutral and turnover halved. We work through what speaks for and against buying BCH at current prices.
August 24, 2026 12:34 AM
Is Monero a Good Buy at Current Prices?
Monero broke above the level we named in September as the test for a trend change. What the breakout, an overbought RSI and EU rules mean now: is Monero a good buy at current prices?
August 24, 2026 12:19 AM
Is Zcash a Good Buy at Current Prices?
Zcash has given back part of its September advance and now sits just above its 50-day average. We look at what the trend, the RSI and the turnover actually support, and under which conditions the case for buying ZEC breaks down.
August 3, 2026 10:41 AM
Is XRP Coin a Good Buy At Current Prices?
XRP trades at $1.19 and has lost both moving averages, with the 50-day EMA dropping back below the 200-day on 18 October. Why the $1.20 shelf now decides where the recovery finds its floor.
November 3, 2026 9:29 AM

Solana Price Below $95: Record ETF Outflows and Whale Selling Push SOL to a 7-Month Low
Solana price drops under $95 after a record $71 million ETF outflow and whale dumping. SOL is 19% down in a month. Is $78 the next stop?
October 27, 2026 11:25 PM

Is Arbitrum a Good Buy at Current Prices?
Arbitrum sits well below its twelve-month high and above its long-term average. We check what argues for and against buying ARB at this level, and which condition would prove the recovery wrong.
October 21, 2026 12:33 AM

Is Worldcoin a Good Buy at Current Prices?
Worldcoin has reclaimed both of its moving averages, and the 50-day line has crossed above the 200-day line for the first time this year. Whether that makes WLD a buy depends on the locked supply and on whether demand holds.
September 20, 2026 9:21 AM

Is Ethena a Good Buy at Current Prices?
Ethena has rebounded hard off its twelve-month low and still trades far below its high. Is ENA a good buy at current prices? We check the chart, the supply schedule and the source of the yield with our own price data.
October 26, 2026 11:22 PM

Is Sky a Good Buy at Current Prices?
Sky is the renamed MakerDAO, and its governance token is tied to the earnings of a lending protocol with its own stablecoin. Is SKY a good buy at current prices? We weigh the chart position, the savings rate, supply mechanics and the open question of European regulation.
October 12, 2026 10:27 AM
Is Bitcoin Still a Good Investment in October 2026?
Spot ETFs have changed who sets the Bitcoin price, and the easy repricing is behind us. What still supports BTC, what could break it, and how much belongs in a portfolio today.
August 27, 2026 11:25 AM
Is Pump.fun a Good Buy at Current Prices?
PUMP now sits only just above its 50-day average and still trades below its twelve-month high. We check with our own price data what argues for and against buying Pump.fun at the current price.
August 27, 2026 6:38 AM

Is NEAR Protocol a Good Buy at Current Prices?
NEAR has nearly tripled since August, and the trend break we defined back then has happened. What ETF buying, leverage and issuance mean now: is NEAR Protocol a good buy at current prices?
August 27, 2026 6:23 AM
Is Bittensor a Good Buy at Current Prices?
Bittensor has passed the trend test we set in August: a weekly close above the 200-day average and a moving-average crossover in September. What the correction since the peak means: is Bittensor a good buy at current prices?
August 27, 2026 3:39 AM
Is Cronos a Good Buy at Current Prices?
Cronos has reclaimed its 200-day line for the first time since the spring, and the RSI is back out of overbought. We weigh what speaks for and against buying CRO at the current price.
August 26, 2026 4:21 AM

Is Uniswap a Good Buy at Current Prices?
Uniswap has gained about three quarters since August, and the trend test we set back then has been passed. What the fee switch, CME futures and the correction since September mean now: is Uniswap a good buy at current prices?
May 18, 2026 1:07 PM
Is Solana a Good Buy in 2026? SOL Price Analysis and Potential ROI
Solana (SOL) trades at $95.50 after slipping back below the $100 resistance. Here's how SOL's potential returns stack up against BTC, ETH, and XRP.
February 11, 2026 7:05 AM
5 Things to Look for BEFORE Buying Bitcoin
Thinking about entering the crypto market? Discover the 5 essential factors to check before you buy Bitcoin to secure your investment and strategy.
October 27, 2026 7:27 AM

Is Venice Token a Good Buy at Current Prices?
Venice Token has multiplied within twelve months and has been correcting since its September high. We check the chart, the supply and the risks of VVV against the question of whether the token is a good buy at the current price.
September 19, 2026 4:20 PM

Is Ondo a Good Buy at the Current Price?
Ondo holds its 200-day line, which the 50-day line crossed above in September, but the price has slipped back under the 50-day line. We examine the chart position, trading volume and supply mechanics, and set out what argues for and against buying the ONDO token.
August 31, 2026 11:20 PM
Is Mantle a Good Buy at Current Prices?
Mantle has rebounded hard from its summer low but still trades below its 200-day line, and nearly half the eventual supply has yet to reach the market. We weigh what speaks for and against buying MNT at the current price.
August 29, 2026 4:26 PM
Is Aster a Good Buy at Current Prices?
Aster sits above both moving averages and at the same time far below its high since listing. We assess whether the token is a good buy at the current price and why the supply still to be released remains the weightiest objection.
August 23, 2026 2:21 PM
Is Hyperliquid a Good Buy at Current Prices?
HYPE slipped below its 50-day average in October, triggering the test we set in September. What buybacks, team sales and leverage mean now: is Hyperliquid a good buy at current prices?
October 9, 2026 1:06 PM

Ethereum Price Under $2,500: Is ETH a Good Buy Right Now?
Ethereum has slipped below $2,500 and the question in every chat group is the same: buy the dip, or stay out? Here is what is driving the price, what the near-term levels are, and what the long-term forecasts actually assume.
More from CryptoTicker