
Is Toncoin a Good Buy at Current Prices?
Toncoin, now traded as Gram (GRAM), has fallen back below both moving averages and the September breakout has failed. What the Telegram wallet, volume and the base mean now: is Toncoin a good buy at current prices?


Which topics should we dive deeper into?
Select what genuinely interests you. Your picks feed directly into our editorial planning.
Crypto news that's actually worth your time.
Weekly. 60 seconds. Carefully curated by our editors: no hype, no promo flood, no spam.
Toncoin changes hands at 1.3611 USD in the early hours of Thursday, 22 October 2026, up 1.2 percent over 24 hours. Our previous assessment on 27 September landed on the day of the autumn peak: at 1.5979 USD the price then sat above both moving averages, it touched 1.71 USD intraday that same day and closed at 1.63 USD, a level it has not reached since. Today Toncoin trades 14.8 percent below the price of 27 September. The sell-off of 8 October pushed it down to 1.34 USD, and the lowest intraday print came on 18 October at 1.3129 USD. A market capitalisation of 3.86 billion USD ranks it 27th. The question now runs the other way: is Toncoin a good buy at current prices after the September breakout failed?
One point still needs clearing up first. Toncoin has been called Gram since 15 June 2026 and trades under the ticker GRAM. The blockchain behind it is still The Open Network, or TON, and the project's own site at ton.org uses the new name throughout. CoinMarketCap lists the coin as "Gram (prev. Toncoin)" under the same identifier as before. If you look up prices yourself, search for Gram or GRAM: CoinMarketCap now lists other assets under the ticker TON, first among them a tokenised AT&T share. What the rename means for your holdings is covered in Toncoin is now Gram. We keep the familiar name here because that is what readers search for.
cryptoticker.io collected the price data for this update late on 21 October 2026 from CoinMarketCap's market data for Gram. Every indicator was calculated in house from the daily closing prices of the past twelve months plus the current price as the final data point, using exponential moving averages for the trend and Wilder's method over 14 days for the relative strength index. Intraday highs and lows come from CoinMarketCap's daily candles. The 27 September values in the table come from our CoinGecko data collection at the time; small differences between the two data services are normal.
| Metric | 27 September 2026 | 22 October 2026 |
|---|---|---|
| Price | $1.5979 | $1.3611 |
| 50-day average | $1.3889 | $1.4208 |
| 200-day average | $1.5479 | $1.5039 |
| Distance to the 200-day line | +3.2% | -9.5% |
| Relative Strength Index (14 days) | 68.6 | 44.0 |
| Trading volume, 24 hours | $143.7m | $56.6m |
| Market capitalisation | $4.48bn | $3.86bn |
Toncoin price analysis: where the TON price stands and which levels matter
At 1.3611 USD Toncoin sits 4.2 percent below its 50-day exponential moving average of 1.4208 USD and 9.5 percent below its 200-day average of 1.5039 USD. In September the price stood above both lines, by 15.0 and 3.2 percent. The alignment our constructive reading rested on has come apart again. Both averages are edging lower, and the 50-day line sits 5.5 percent beneath the 200-day line.
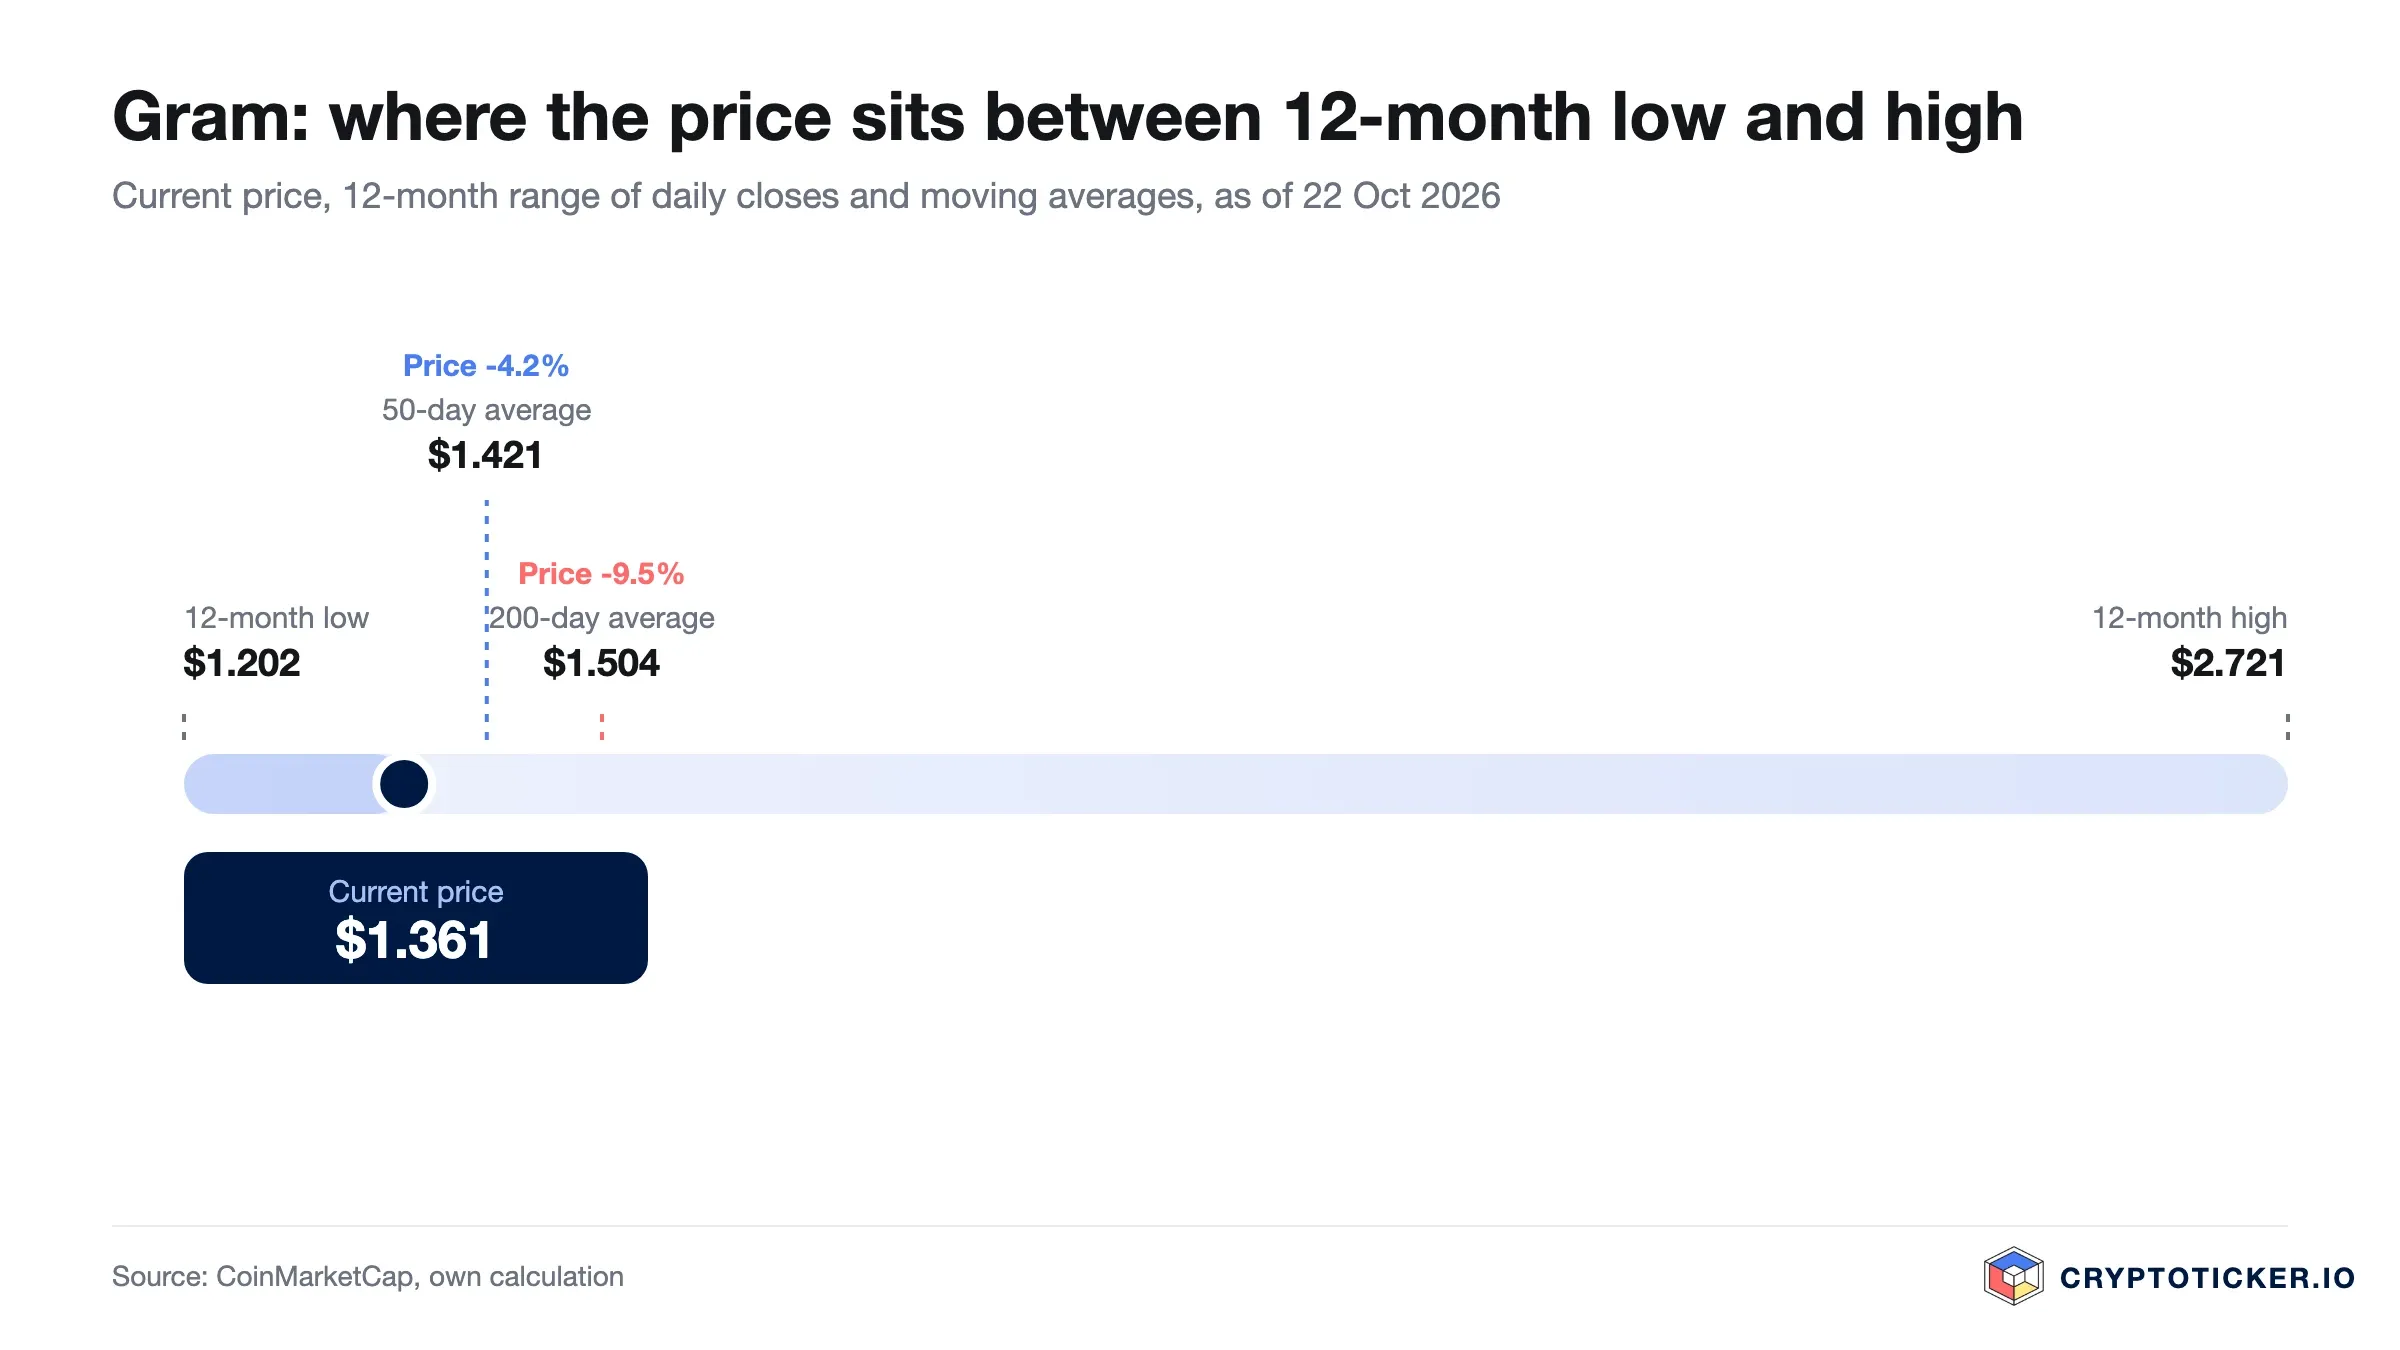
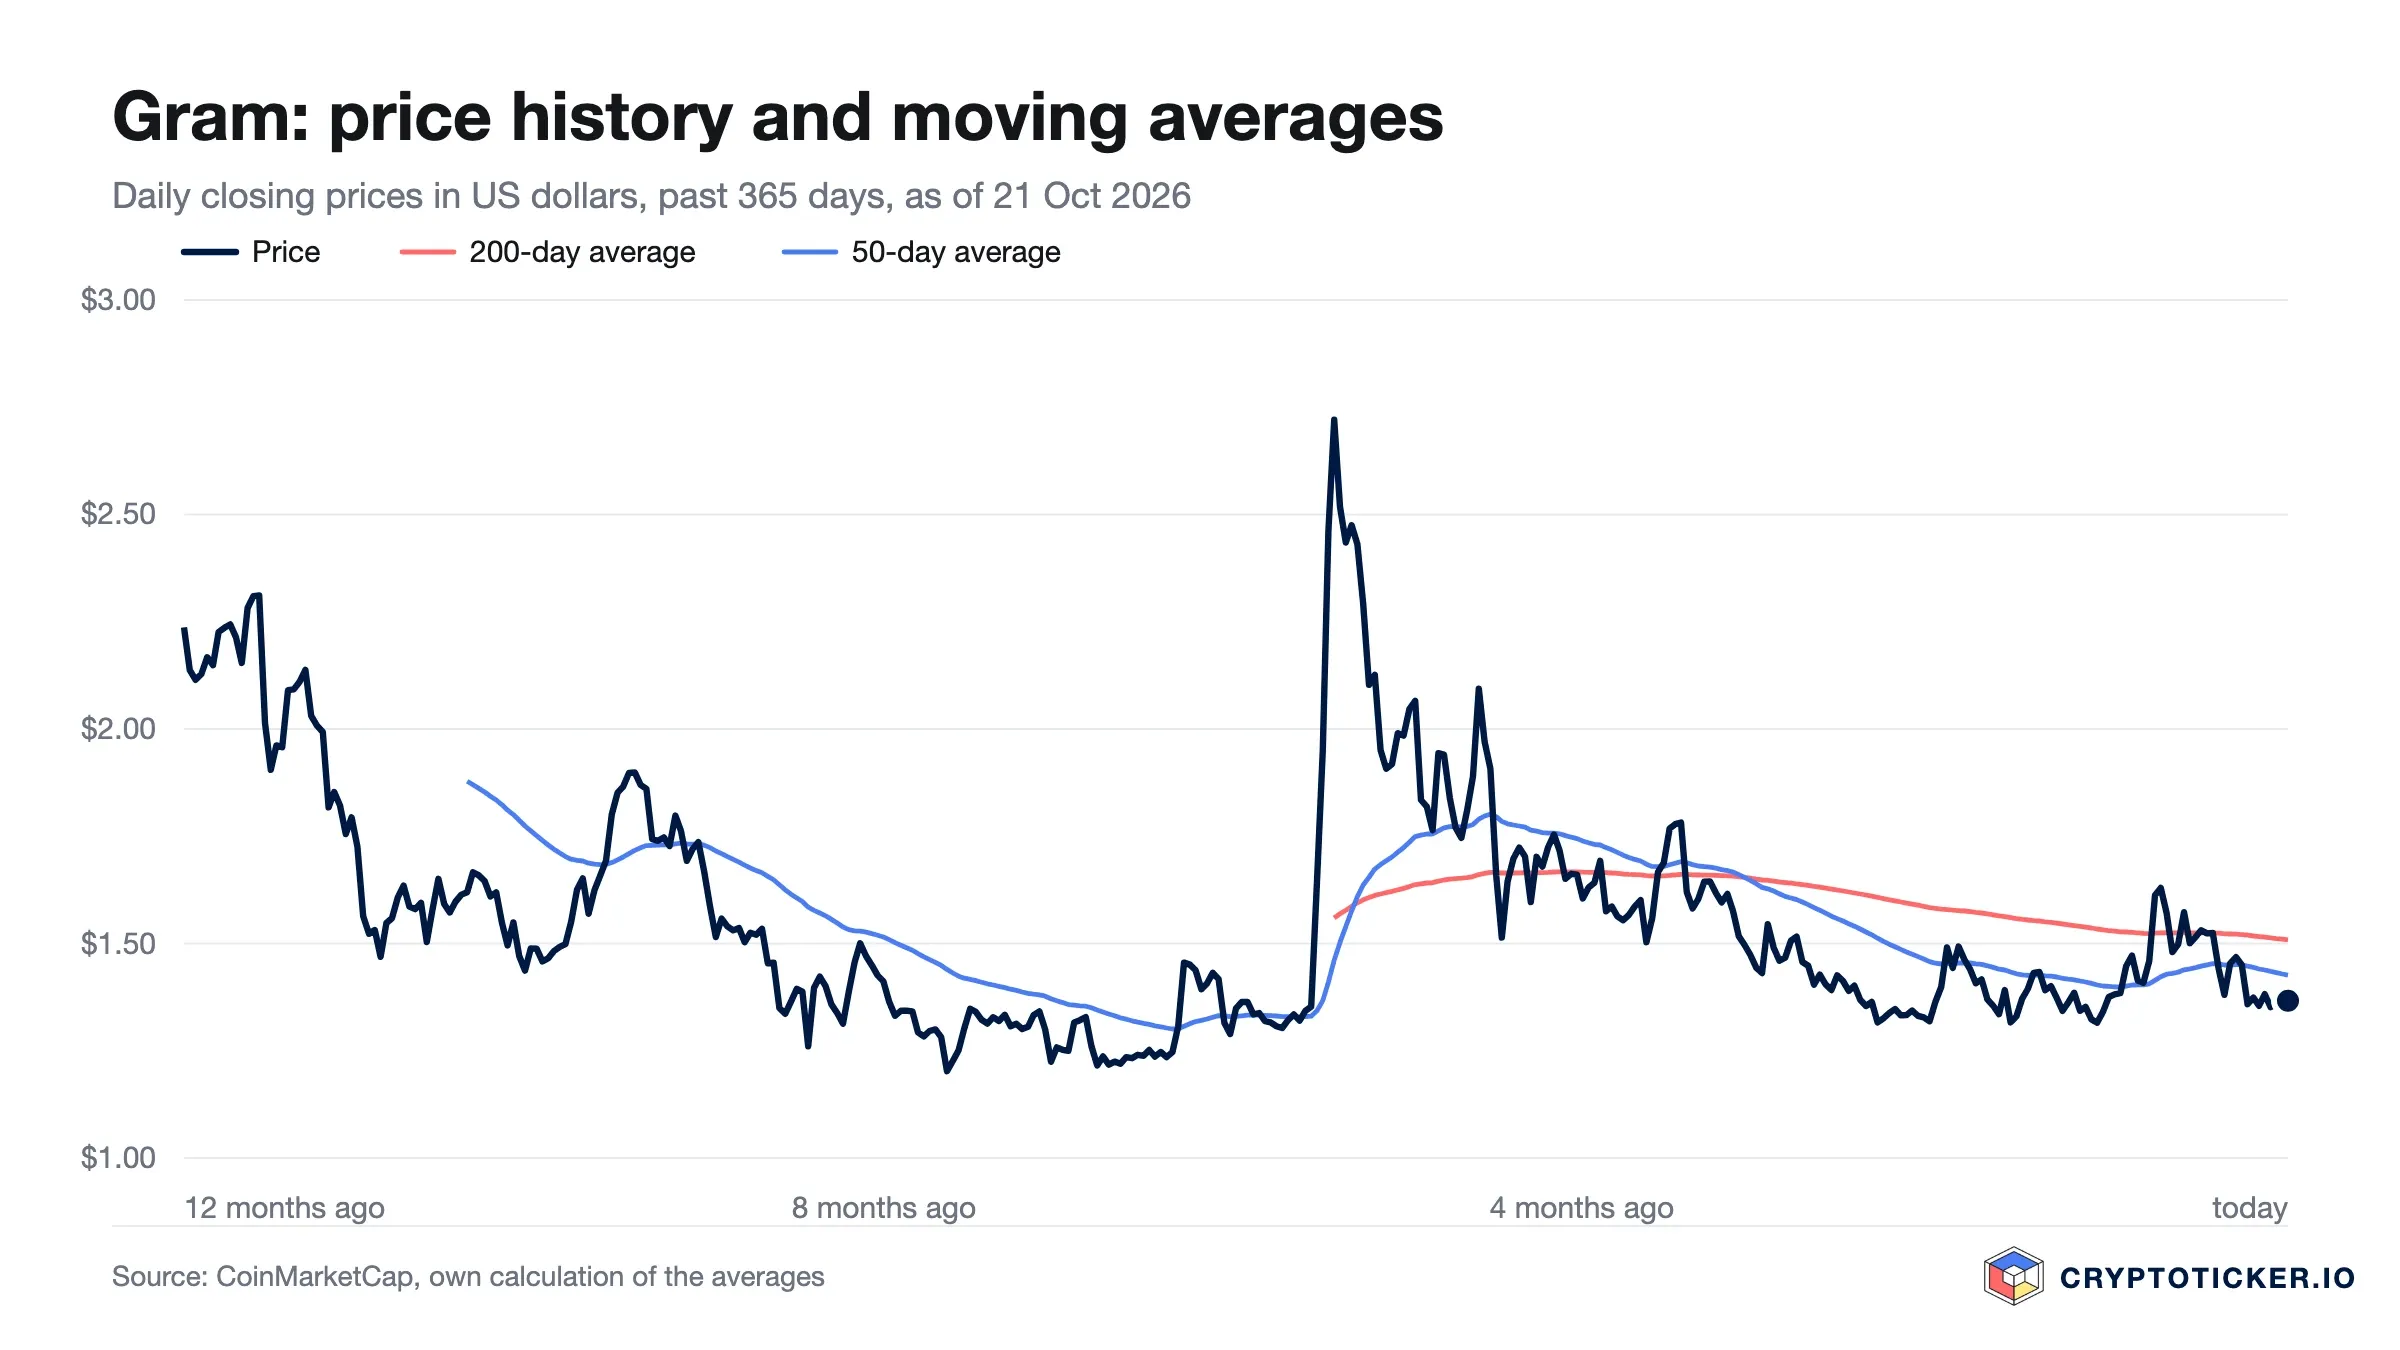
Three zones frame the picture now. Since 13 October Toncoin has closed between 1.3478 and 1.3818 USD and traded between 1.3129 and 1.3936 USD intraday, a band of just over 6 percent. Overhead sit the 50-day line at 1.4208 USD, the 200-day line at 1.5039 USD and the highest October close of 1.5730 USD from 1 October. Below the band lie the intraday low of 18 October at 1.3129 USD and the lowest daily close of the past twelve months, 1.2022 USD from 1 March. The twelve-month high dates from May: after Telegram took over as the network's largest validator on 4 May, Toncoin closed at 2.7208 USD on 7 May. The old high of 2.8593 USD from 4 October 2025 has dropped out of the twelve-month window. Where analysts expect the price to go from here is set out in our Toncoin price prediction.
Is the Toncoin downtrend broken or only interrupted?
On 27 September we described the trend as broken at the short end and unconfirmed at the long end, and named the tests. The level to watch was the 200-day line at 1.5479 USD: if the price lost it again, the breakout had failed. The constructive scenario would be refuted by a sustained close back below 1.5479 USD or by volume sliding toward the 45.7 million USD of the prior month, and confirmed by the 50-day line crossing above the 200-day line while turnover held above its annual norm. Both refutation conditions have been met, and the confirmation has not. Toncoin closed at 1.48 USD on 29 September, below 1.5479 USD, and has not closed above that level since 2 October. The seven-day volume average now stands at 48.7 million USD, close to the 45.7 million we named. The two averages have not crossed.
Two coin-specific events fell into these weeks. The Swedish issuer Virtune removed Gram from its altcoin ETP on Xetra with effect from 30 September and replaced it with Litecoin; Gram had been last in the equal-weighted basket with 8.68 percent. On 9 October Telegram opened its Money wallet to a much wider group of users. Toncoin closed 5.3 percent higher that day at 1.4535 USD on turnover of 136.8 million USD, but the gain did not last: on 12 October the price closed at 1.3586 USD, below where it stood before the announcement.
The wider market added pressure. In the sell-off of 7 and 8 October, with 1.16 billion USD of liquidations on 8 October, Toncoin lost 9.5 percent on a closing basis, and on 18 October, when many altcoins bottomed, it set its intraday low at 1.3129 USD. Over 90 days it is down 7.1 percent, over twelve months 36.3 percent: a year ago it traded at 2.14 USD. On our own definition, the September breakout was an interruption of the downtrend rather than its end. What has held is the base: the lowest close since 27 September, 1.3478 USD, is still 10.7 percent above the March low of 1.2174 USD that we cited then.
What RSI and moving averages mean for a Toncoin entry
The relative strength index over 14 days reads 44.0, below the neutral midpoint of 50 and well above the 30 mark conventionally treated as oversold. On 27 September it stood at 68.6, just short of overbought. Since 12 October it has held between 41 and 45: momentum has tilted slightly toward sellers for more than two weeks without the price giving up much more ground.
The moving averages have swapped roles back. In September the 50-day line sat 15.0 percent below the price and acted as support; today it sits 4.4 percent above the price and is the first hurdle. Both lines are falling: the 50-day average from 1.4532 to 1.4232 USD between 6 and 20 October, the 200-day average from 1.5232 to 1.5054 USD over the same stretch.
For an entry decision, the September problem was paying up for a move already made. Today's problem is direction: a buyer at 1.3611 USD is positioned against both averages. The distances are 4.4 percent up to the 50-day line, 3.5 percent down to the intraday low of 18 October and 11.7 percent down to the twelve-month closing low.
What Toncoin trading volume reveals about demand
Toncoin turned over 56.6 million USD in the last 24 hours. The seven-day average sits at 48.7 million USD and the 30-day average at 88.9 million USD, against 143.7 million in 24 hours and a 30-day average of 45.7 million on 27 September. The 30-day figure is high today only because it contains the turnover spike around 27 September: on that day 232.6 million USD changed hands according to CoinMarketCap's daily candles, more than on any other day of the past three months.
That spike is the most telling detail in hindsight. In September we noted that volume surges of this size also cluster at the end of short moves, and that is what happened: the surge marked the top rather than the start of a trend. Since 13 October daily turnover has ranged between 34.9 and 74.2 million USD, below the 90-day median of 52.1 million on most days.
Daily turnover equals 1.5 percent of a market capitalisation of 3.86 billion USD, so a mid-sized sale moves the price noticeably, as the 6.3 percent drop of 12 October showed. The broader market has cooled as well: the Fear and Greed Index, at 70 in September, read 54 late on 21 October, a neutral market, after a 60-day low of 48 on 17 October. Toncoin followed the mood down but not the modest recovery since.
Structural factors that speak for Toncoin: supply, usage and regulation
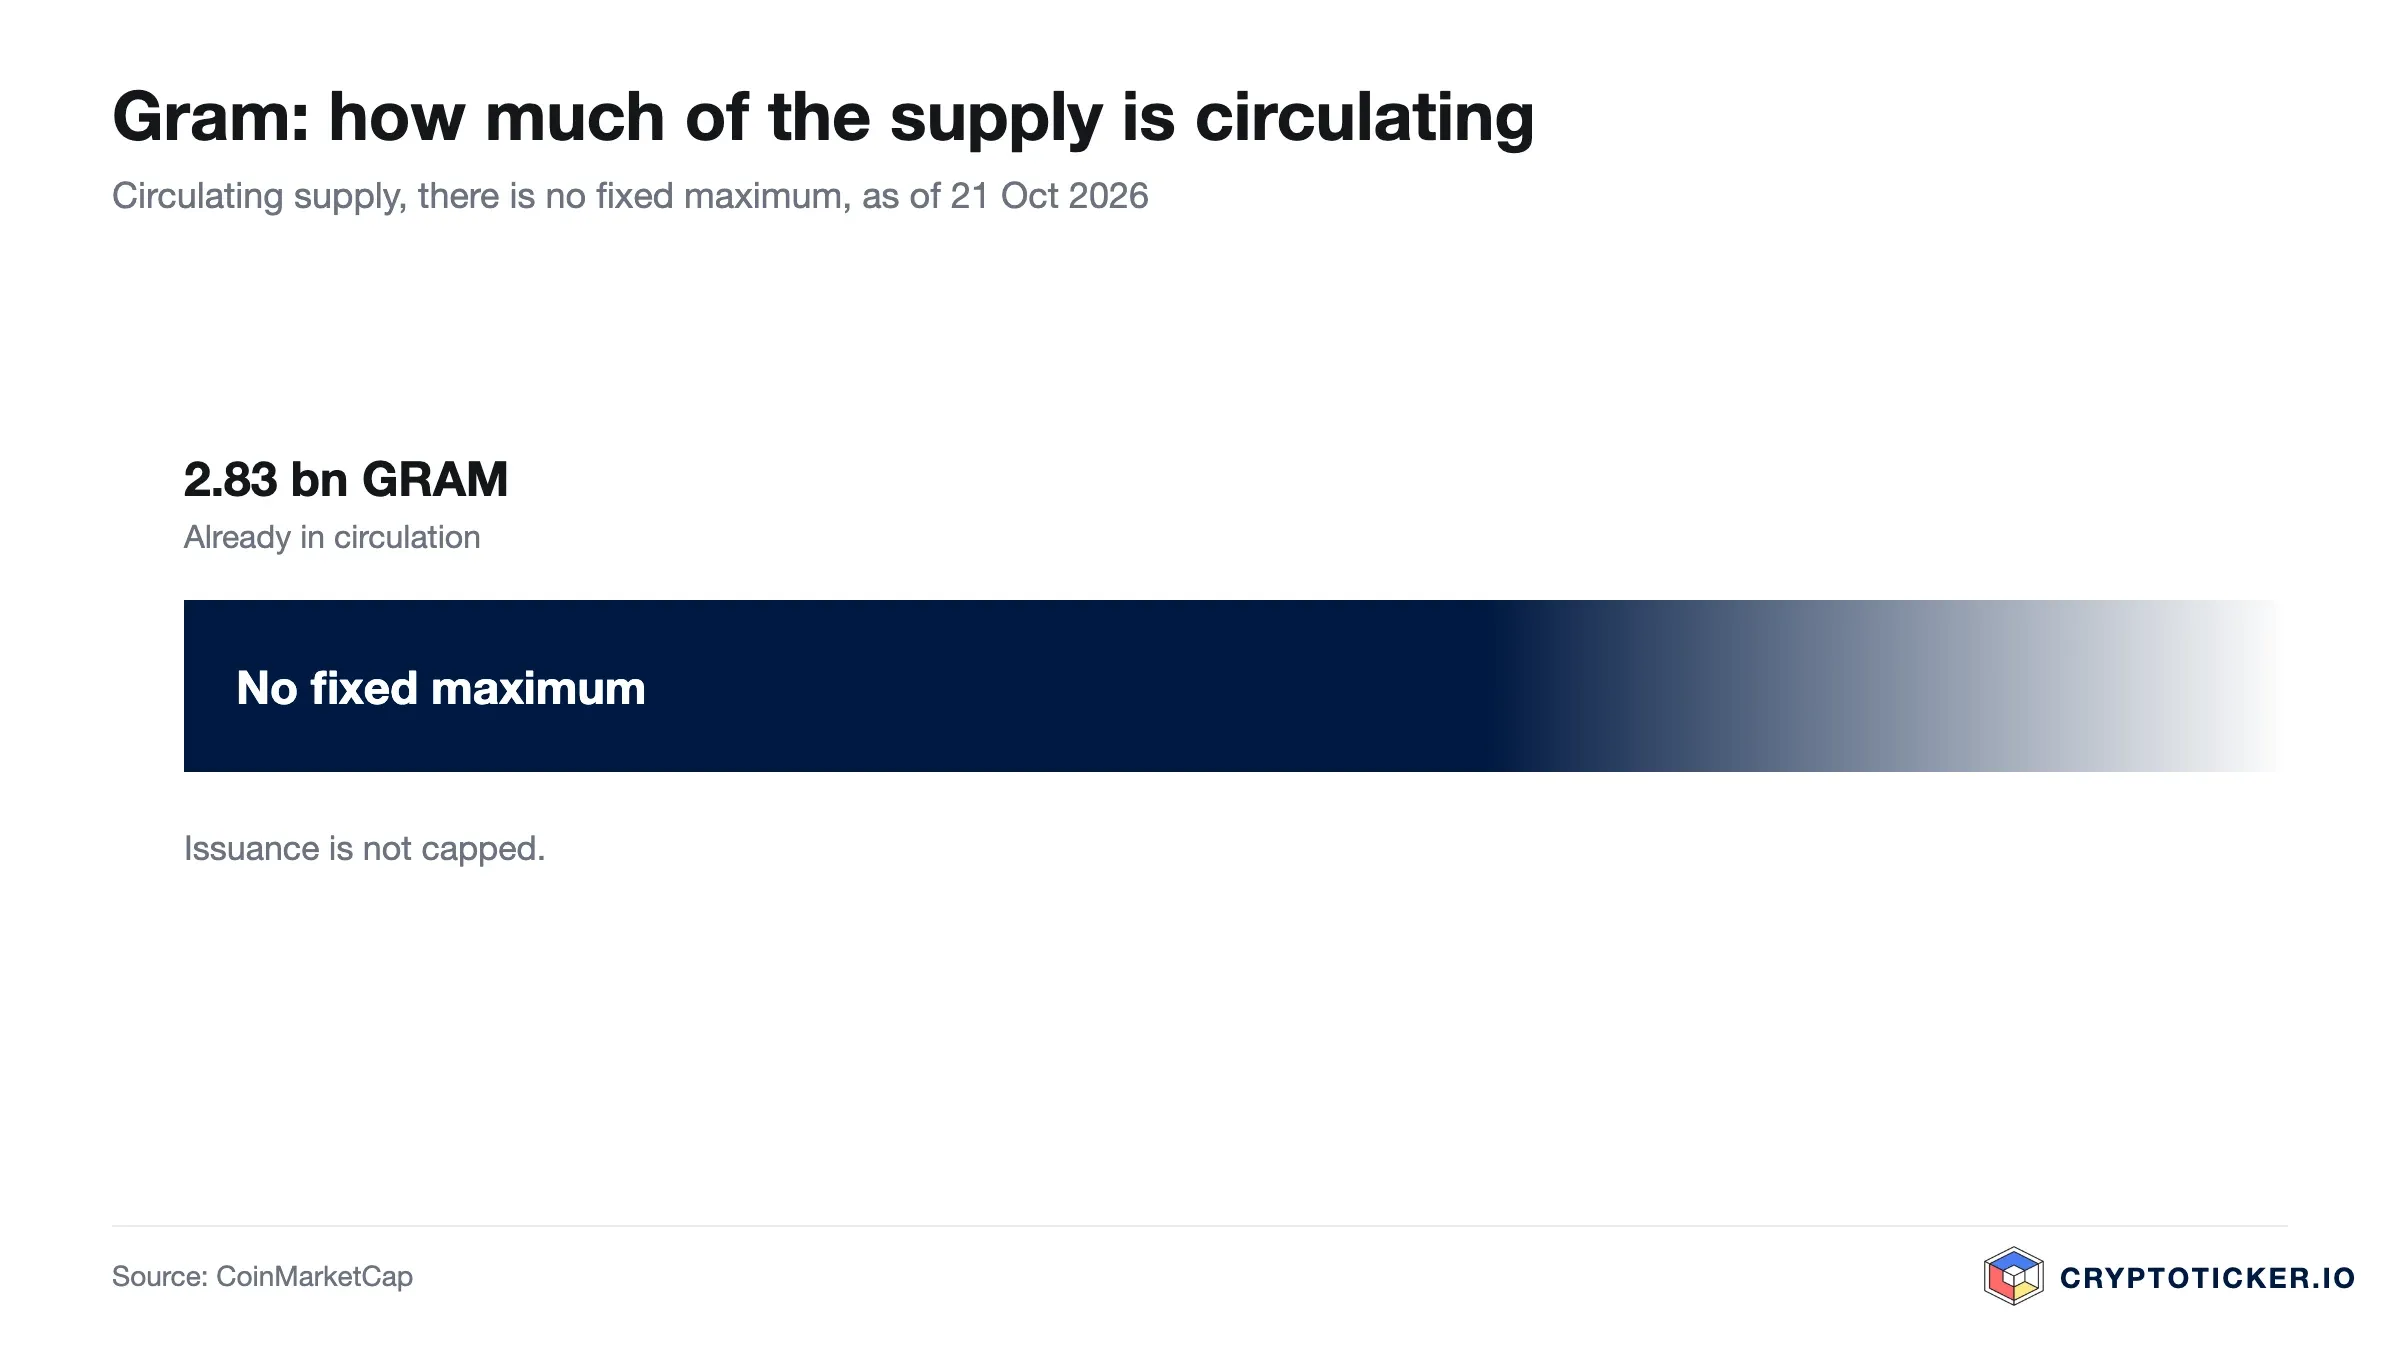
Supply mechanics come first. About 2.83 billion coins circulate out of a total supply of about 5.27 billion, against 2.814 and 5.256 billion in September, with no hard maximum in the sense that Bitcoin has one. Issuance continues through validator rewards, so the circulating share can keep rising. A buyer at 1.3611 USD is buying a claim on a supply base that is not fixed, and that belongs in any valuation. On the demand side one source has gone: the Virtune altcoin ETP on Xetra has held no Gram since 30 September.
Usage remains the more distinctive argument, and the link to Telegram has tightened. Telegram has been the network's largest validator since 4 May 2026, and on 9 October the messenger opened its own Money wallet to a much wider group of users, out of an audience it puts at more than one billion people. Money is non-custodial, so the keys sit with the user alone; our piece on the Telegram Money wallet explains what that means for custody. An upgrade in April cut block time from about 2.5 seconds to around 400 milliseconds and fees fell roughly sixfold, according to the operator; the technical basis is documented at docs.ton.org. The flip side of that proximity is concentration: whoever runs both the largest validator and the app through which most users arrive has a strong say in which changes pass.
Regulation is the third factor, and the picture is neutral to mildly favourable. Under the European framework supervised by ESMA, crypto assets face harmonised disclosure and custody requirements across the bloc, which has made large-cap tokens easier for regulated venues to list and keep listed. That lifts no single price, but it lowers the risk that a large-cap coin becomes inaccessible on European platforms.
The rename to Gram still carries a practical cost: ticker changes fragment search traffic and complicate portfolio tracking, and the old ticker TON now points to other assets at major data services. Transfers carry a second practical trap, since many exchanges require a comment with every deposit; our guide to TON wallets and Tonviewer shows how to get it right.
What speaks for buying Toncoin at current prices
Three arguments carry weight at 1.3611 USD.
The base is holding. The lowest daily close of the past twelve months is 1.2022 USD from 1 March. Even in the October sell-off and on the day of the altcoin lows, 18 October, Toncoin stayed 9.2 percent above it at 1.3129 USD intraday. Since 13 October closes have moved within a band of just 2.5 percent, which suggests selling pressure and demand are in balance.
The distribution advantage has become concrete. With Money, a self-custody wallet now sits inside the messenger itself. According to the project's own site, 325 validators secured the chain in early October and around four million transfers ran through it per day. That direct line to the users of a messenger is the core of the Toncoin case, and it does not depend on market mood.
The valuation has absorbed a further repricing. Toncoin trades 50.0 percent below its highest close of the past twelve months and 36.3 percent below its price a year ago. The overheating of September has been worked off: the RSI stands at 44.0 instead of 68.6, the Fear and Greed Index at 54 instead of 70. An investor betting on usage through Telegram pays 14.8 percent less than in September. Where analysts see the price heading is covered in our Toncoin price prediction.
What speaks against buying Toncoin at current prices
Three counterarguments now weigh more heavily than in September.
The breakout has failed. The price sits below both averages, 4.2 percent under the 50-day line and 9.5 percent under the 200-day line, and both lines are falling. The move above 1.5479 USD in September lasted only three daily closes. A buyer today is positioned against the trend rather than with it.
Headlines have not stuck. Twice this year a major Telegram announcement moved the price only briefly: the rename in June and the wallet opening on 9 October, whose gain was gone within three days. A wallet lowers the barrier to using the token, but it does not create demand on its own. Add a supply base without a fixed cap and the exit from the Virtune ETP.
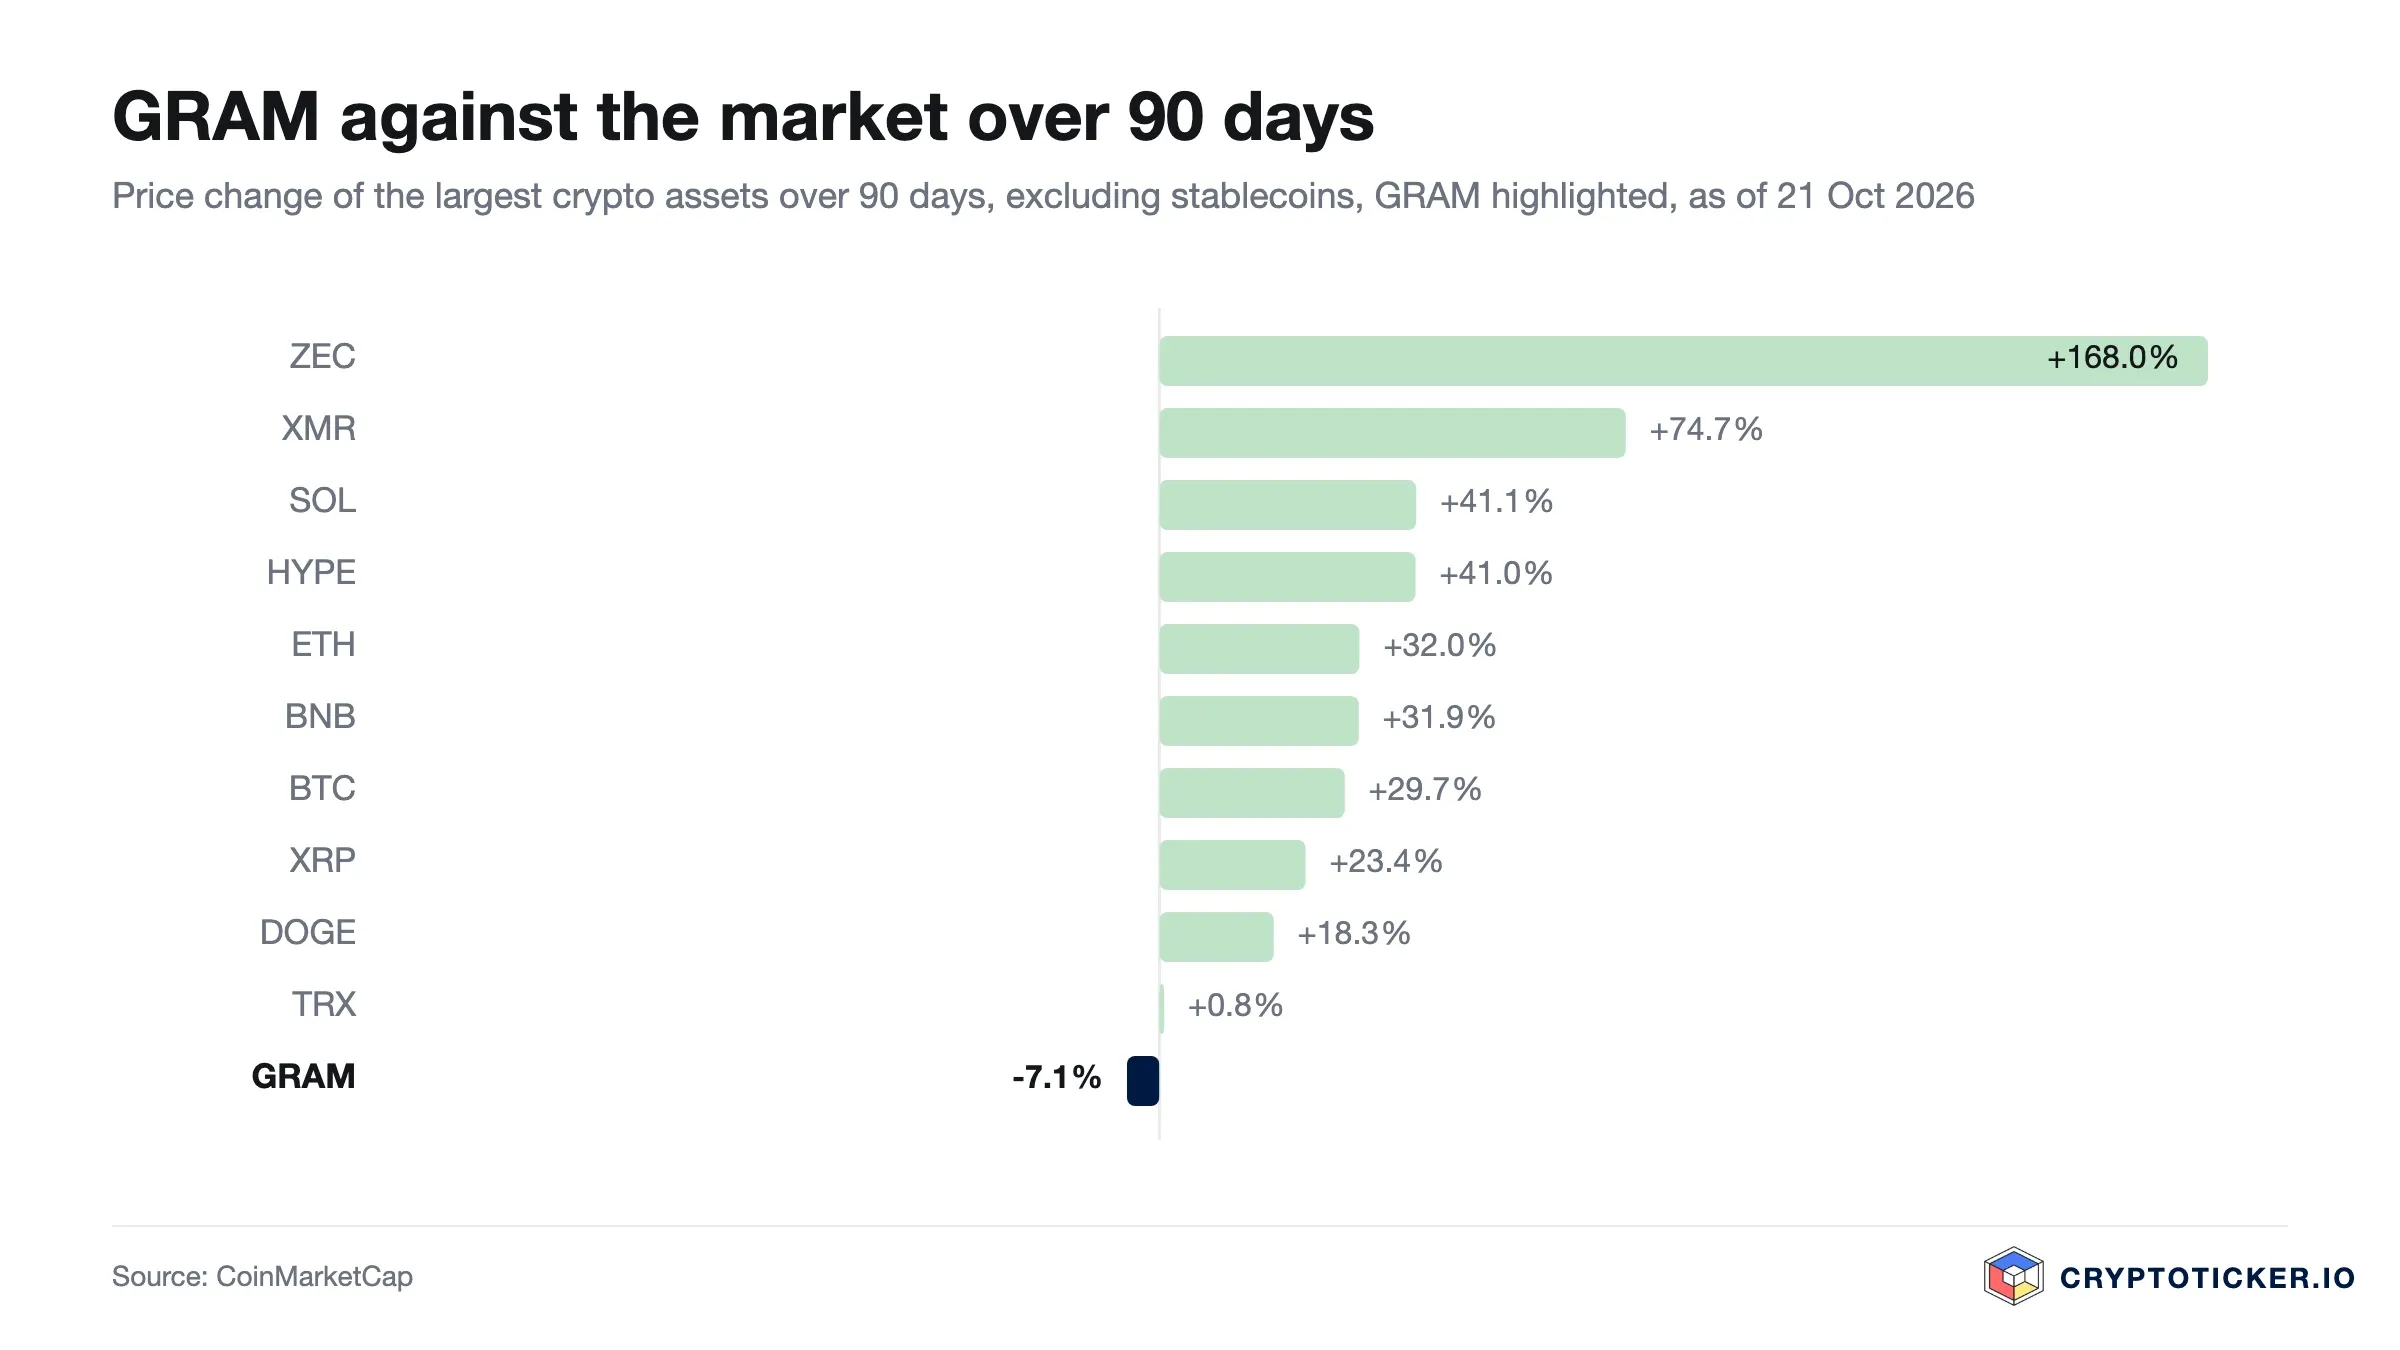
Relative strength is weak in a difficult market. Over 90 days Toncoin is down 7.1 percent, the only loss among the large non-stablecoin crypto assets, while Bitcoin gained 29.7 percent. The Federal Reserve raised rates to 3.75 to 4.00 percent on 16 September, its minutes of 7 October point to a further increase, and consumer prices rose 3.7 percent in September. Bitcoin stood at 84,760 USD on 21 October with a market share of 59 to 60 percent. The Fed meeting on 27 and 28 October is the next date on which that backdrop can shift.
How to buy Toncoin at current prices: costs, custody and providers
The cost of buying matters more than in September, because turnover has fallen back. Spreads on thinly traded pairs can exceed the visible trading fee by a wide margin, so the headline commission is only part of the bill; with daily turnover recently between 35 and 74 million USD, a limit order that caps your price is the standard tool. Most large exchanges now list the coin as GRAM. Our crypto exchange comparison sets out the fee models side by side.
For European investors, regulatory status is the second filter. Supervised platforms offer clearer complaint routes and stricter custody rules, the relevant distinction once positions grow beyond pocket money. The candidates are collected in our overview of the best regulated crypto exchanges, and among individual venues we have examined Bitpanda in detail and Kraken's fee structure and features separately.
Custody is the third decision and independent of the first two. Coins left on an exchange remain in someone else's control, which is convenient for trading and unhelpful for holding. Investors planning to hold across a full cycle generally move to self-custody, and the trade-offs between the leading devices are laid out in our hardware wallet comparison. Telegram's Money wallet is another self-custody route: the recovery phrase sits with you alone, and nobody can replace it. Toncoin support varies by device, so check before buying rather than after.
So is Toncoin a good buy at current prices?
The data supports different answers over different horizons, and neither is a recommendation.
Short term, the setup has turned against the buyer since September. The price sits below two falling averages, the RSI reads 44.0 and turnover runs below its 90-day median. The only constructive element is the tight band since 13 October between 1.3129 and 1.3936 USD, in which selling and buying have balanced for more than a week. The distances are 4.4 percent up to the 50-day line and 3.5 percent down to the intraday low of 18 October. Our September advice against buying in a single tranche has held up: the price is now 14.8 percent below where it stood then.
Long term, the case still rests on one question: does the messenger-linked distribution advantage translate into sustained usage? What is new is that this can now be checked against numbers, namely the spread of the Money wallet and the transfer count on the network. Against it stand a supply without a fixed cap and the dependence on a single company that is also the largest validator. To return to its highest close of the past twelve months, 2.7208 USD, the price would have to almost double.
Three levels make the assessment testable. A close below 1.3129 USD, the intraday low of 18 October, would break the band to the downside and bring the twelve-month closing low into play. A close below 1.2022 USD would be a new twelve-month low and would mean the base built since spring has failed. In the other direction, a daily close above the 200-day line, now 1.5039 USD, on turnover above the 90-day median of 52.1 million USD would put the downtrend back to the test.
Buying Toncoin: what to take away
- The breakout failed, the base held. At 1.3611 USD Toncoin trades below the 50-day line at 1.4208 USD and the 200-day line at 1.5039 USD, while its lowest close since September, 1.3478 USD, stayed well above the spring low. Where analysts see the price heading from this zone is covered in our Toncoin price prediction.
- Volume no longer carries a move. A seven-day average of 48.7 million USD compares with 143.7 million on 27 September. With turnover this thin, spreads and execution prices matter, which makes the choice of venue a financial decision rather than an administrative one. The fee models are compared in our crypto exchange comparison.
- Custody is a separate decision from the purchase. Anyone planning to hold beyond a trade should settle the storage question before buying rather than afterwards, and the options are set out in our hardware wallet comparison.
Disclosure: Some of the providers mentioned in this article work with us through partner programmes. This has no influence on the price analysis or on our assessment of the chart situation; the price data comes from a public market data source and can be verified there.
(As of 22 October 2026, previous version of 27 September 2026, first version of 16 August 2026. This article is not investment advice. Prices, fees and terms change; check them with the provider before every purchase. Crypto assets are subject to high price volatility, and a total loss is possible.)
Transparency note: This article was produced with the assistance of artificial intelligence and reviewed by our editorial team before publication. All figures and claims were checked against the primary sources linked in the text. The feature image was generated with AI.
Related articles
Which topics should we dive deeper into?
Select what genuinely interests you. Your picks feed directly into our editorial planning.
Crypto news that's actually worth your time.
Weekly. 60 seconds. Carefully curated by our editors: no hype, no promo flood, no spam.

May 13, 2026 11:02 AM

Is PEPE Coin worth Buying in 2026?
PEPE still holds both its 50 day and its 200 day average, while the past month has gone sideways and weekly turnover has picked up again. What that means for anyone buying at current prices, and the two levels that settle it.
June 28, 2024 5:22 PM

TON Coin Price Prediction: A New SURGE or DIP Ahead?
Toncoin's on-chain data shows significant activity from large investors, hinting at a potential price rally. But how high can TON go, and at what level will it fall back?
September 28, 2026 9:47 AM
XRP Price Drops Below $1.50: Where Is Ripple Heading This Week?
XRP price slips under $1.50 after a red weekend. Here is the XRP price analysis with the higher and lower targets that matter this week.
November 3, 2026 8:59 AM
Ethereum Price Below $2,300: Is $2,000 Next or Is This the Bottom?
Ethereum price slips toward $2,250 as $3 billion leaves DeFi. Whales are buying the dip. Does ETH hold $2,200 or test $2,000 next?

August 23, 2026 1:16 AM

Is PEPE a Good Buy at the Current Price?
PEPE is holding the 50-day moving average and sits clearly above the 200-day line, with weekly volume picking up again. Is the memecoin a good buy at the current price, or has the rally already run?
August 24, 2026 12:50 AM
Is Bitcoin Cash a Good Buy at Current Prices?
Bitcoin Cash has held its summer gains but the rally has stalled: the price now sits right on its 50-day line with the RSI back to neutral and turnover halved. We work through what speaks for and against buying BCH at current prices.
August 24, 2026 12:34 AM
Is Monero a Good Buy at Current Prices?
Monero broke above the level we named in September as the test for a trend change. What the breakout, an overbought RSI and EU rules mean now: is Monero a good buy at current prices?
August 24, 2026 12:19 AM
Is Zcash a Good Buy at Current Prices?
Zcash has given back part of its September advance and now sits just above its 50-day average. We look at what the trend, the RSI and the turnover actually support, and under which conditions the case for buying ZEC breaks down.
August 3, 2026 10:41 AM
Is XRP Coin a Good Buy At Current Prices?
XRP trades at $1.19 and has lost both moving averages, with the 50-day EMA dropping back below the 200-day on 18 October. Why the $1.20 shelf now decides where the recovery finds its floor.
May 12, 2024 4:17 PM

Toncoin Price Prediction: Will TON Price reach $10?
Despite the bearish crypto market, Toncoin continues to make higher highs, reaching an ATH price of more than $7. How high will TON price reach?

October 1, 2024 11:05 AM
Toncoin (TON) Price Analysis: Will TON Price Continue To Surge?
Toncoin's price is on the rise as more users jump in, driven by the growing buzz around the Telegram Airdrop.
November 3, 2026 9:29 AM
Solana Price Below $95: Record ETF Outflows and Whale Selling Push SOL to a 7-Month Low
Solana price drops under $95 after a record $71 million ETF outflow and whale dumping. SOL is 19% down in a month. Is $78 the next stop?
October 27, 2026 11:25 PM

Is Arbitrum a Good Buy at Current Prices?
Arbitrum sits well below its twelve-month high and above its long-term average. We check what argues for and against buying ARB at this level, and which condition would prove the recovery wrong.
October 21, 2026 12:33 AM
Is Worldcoin a Good Buy at Current Prices?
Worldcoin has reclaimed both of its moving averages, and the 50-day line has crossed above the 200-day line for the first time this year. Whether that makes WLD a buy depends on the locked supply and on whether demand holds.
September 20, 2026 9:21 AM

Is Ethena a Good Buy at Current Prices?
Ethena has rebounded hard off its twelve-month low and still trades far below its high. Is ENA a good buy at current prices? We check the chart, the supply schedule and the source of the yield with our own price data.
October 26, 2026 11:22 PM

Is Sky a Good Buy at Current Prices?
Sky is the renamed MakerDAO, and its governance token is tied to the earnings of a lending protocol with its own stablecoin. Is SKY a good buy at current prices? We weigh the chart position, the savings rate, supply mechanics and the open question of European regulation.
October 12, 2026 10:27 AM
Is Bitcoin Still a Good Investment in October 2026?
Spot ETFs have changed who sets the Bitcoin price, and the easy repricing is behind us. What still supports BTC, what could break it, and how much belongs in a portfolio today.
August 27, 2026 11:25 AM
Is Pump.fun a Good Buy at Current Prices?
PUMP now sits only just above its 50-day average and still trades below its twelve-month high. We check with our own price data what argues for and against buying Pump.fun at the current price.
August 27, 2026 6:38 AM
Is NEAR Protocol a Good Buy at Current Prices?
NEAR has nearly tripled since August, and the trend break we defined back then has happened. What ETF buying, leverage and issuance mean now: is NEAR Protocol a good buy at current prices?
August 27, 2026 6:23 AM
Is Bittensor a Good Buy at Current Prices?
Bittensor has passed the trend test we set in August: a weekly close above the 200-day average and a moving-average crossover in September. What the correction since the peak means: is Bittensor a good buy at current prices?
August 27, 2026 3:39 AM

Is Cronos a Good Buy at Current Prices?
Cronos has reclaimed its 200-day line for the first time since the spring, and the RSI is back out of overbought. We weigh what speaks for and against buying CRO at the current price.
August 26, 2026 4:21 AM
Is Uniswap a Good Buy at Current Prices?
Uniswap has gained about three quarters since August, and the trend test we set back then has been passed. What the fee switch, CME futures and the correction since September mean now: is Uniswap a good buy at current prices?
May 18, 2026 1:07 PM

Is Solana a Good Buy in 2026? SOL Price Analysis and Potential ROI
Solana (SOL) trades at $95.50 after slipping back below the $100 resistance. Here's how SOL's potential returns stack up against BTC, ETH, and XRP.
March 12, 2024 6:08 AM

Toncoin is Climbing: How High Can the TON Price Go?
Could it possibly reach $5 in the near future? How high can the TON price go? Let's take a look at this Toncoin price prediction

June 6, 2026 1:44 AM

Toncoin Crashes to $1.53 as Key Ecosystem Services Face Major Outages
Toncoin (TON) price has crashed sharply to $1.53 amid widespread infrastructure issues, leaving major mini-apps and network portals completely offline.
More from CryptoTicker