
Is PEPE a Good Buy at the Current Price?
PEPE has given up the 50-day moving average but still holds clearly above the 200-day line. Is the memecoin a good buy at the current price, or is the rally already running on thin volume?





Which topics should we dive deeper into?
Select what genuinely interests you. Your picks feed directly into our editorial planning.
Crypto news that's actually worth your time.
Weekly. 60 seconds. Carefully curated by our editors: no hype, no promo flood, no spam.
PEPE trades at around $0.00000418 on October 20, 2026, and has reclaimed the 50-day moving average, with a clear gap to the 200-day line. Its twelve-month high of $0.00000733 from October 27, 2025 is 43.0 percent away, and over twelve months the coin carries a loss of around 41.6 percent. Over the past 30 days, by contrast, it has gained around 4.5 percent. Moments like this raise the question readers click on at cryptoticker.io every day: is PEPE a good buy at the current price, or are you chasing a move that has already run?
cryptoticker.io compiled the price data in this article on October 20, 2026, from daily closing prices over the past 365 days. The moving averages and the RSI(14) are calculated from those daily closes using the standard formulas.
PEPE Price Analysis: Where the Price Stands and Which Levels Matter Now
The current PEPE price of $0.00000418 sits above both chart anchors that still acted as resistance in the summer. The 200-day moving average stands at $0.00000370, around 12.8 percent below the price. The 50-day moving average sits at $0.00000394, 5.9 percent below the price: that line has been reclaimed since the last update. The twelve-month low of $0.00000232 from July 2, 2026 is 44.4 percent away. The zone between $0.0000037 and $0.0000039 is therefore the corridor beneath the price: that is where it will be decided whether the upward impulse holds.
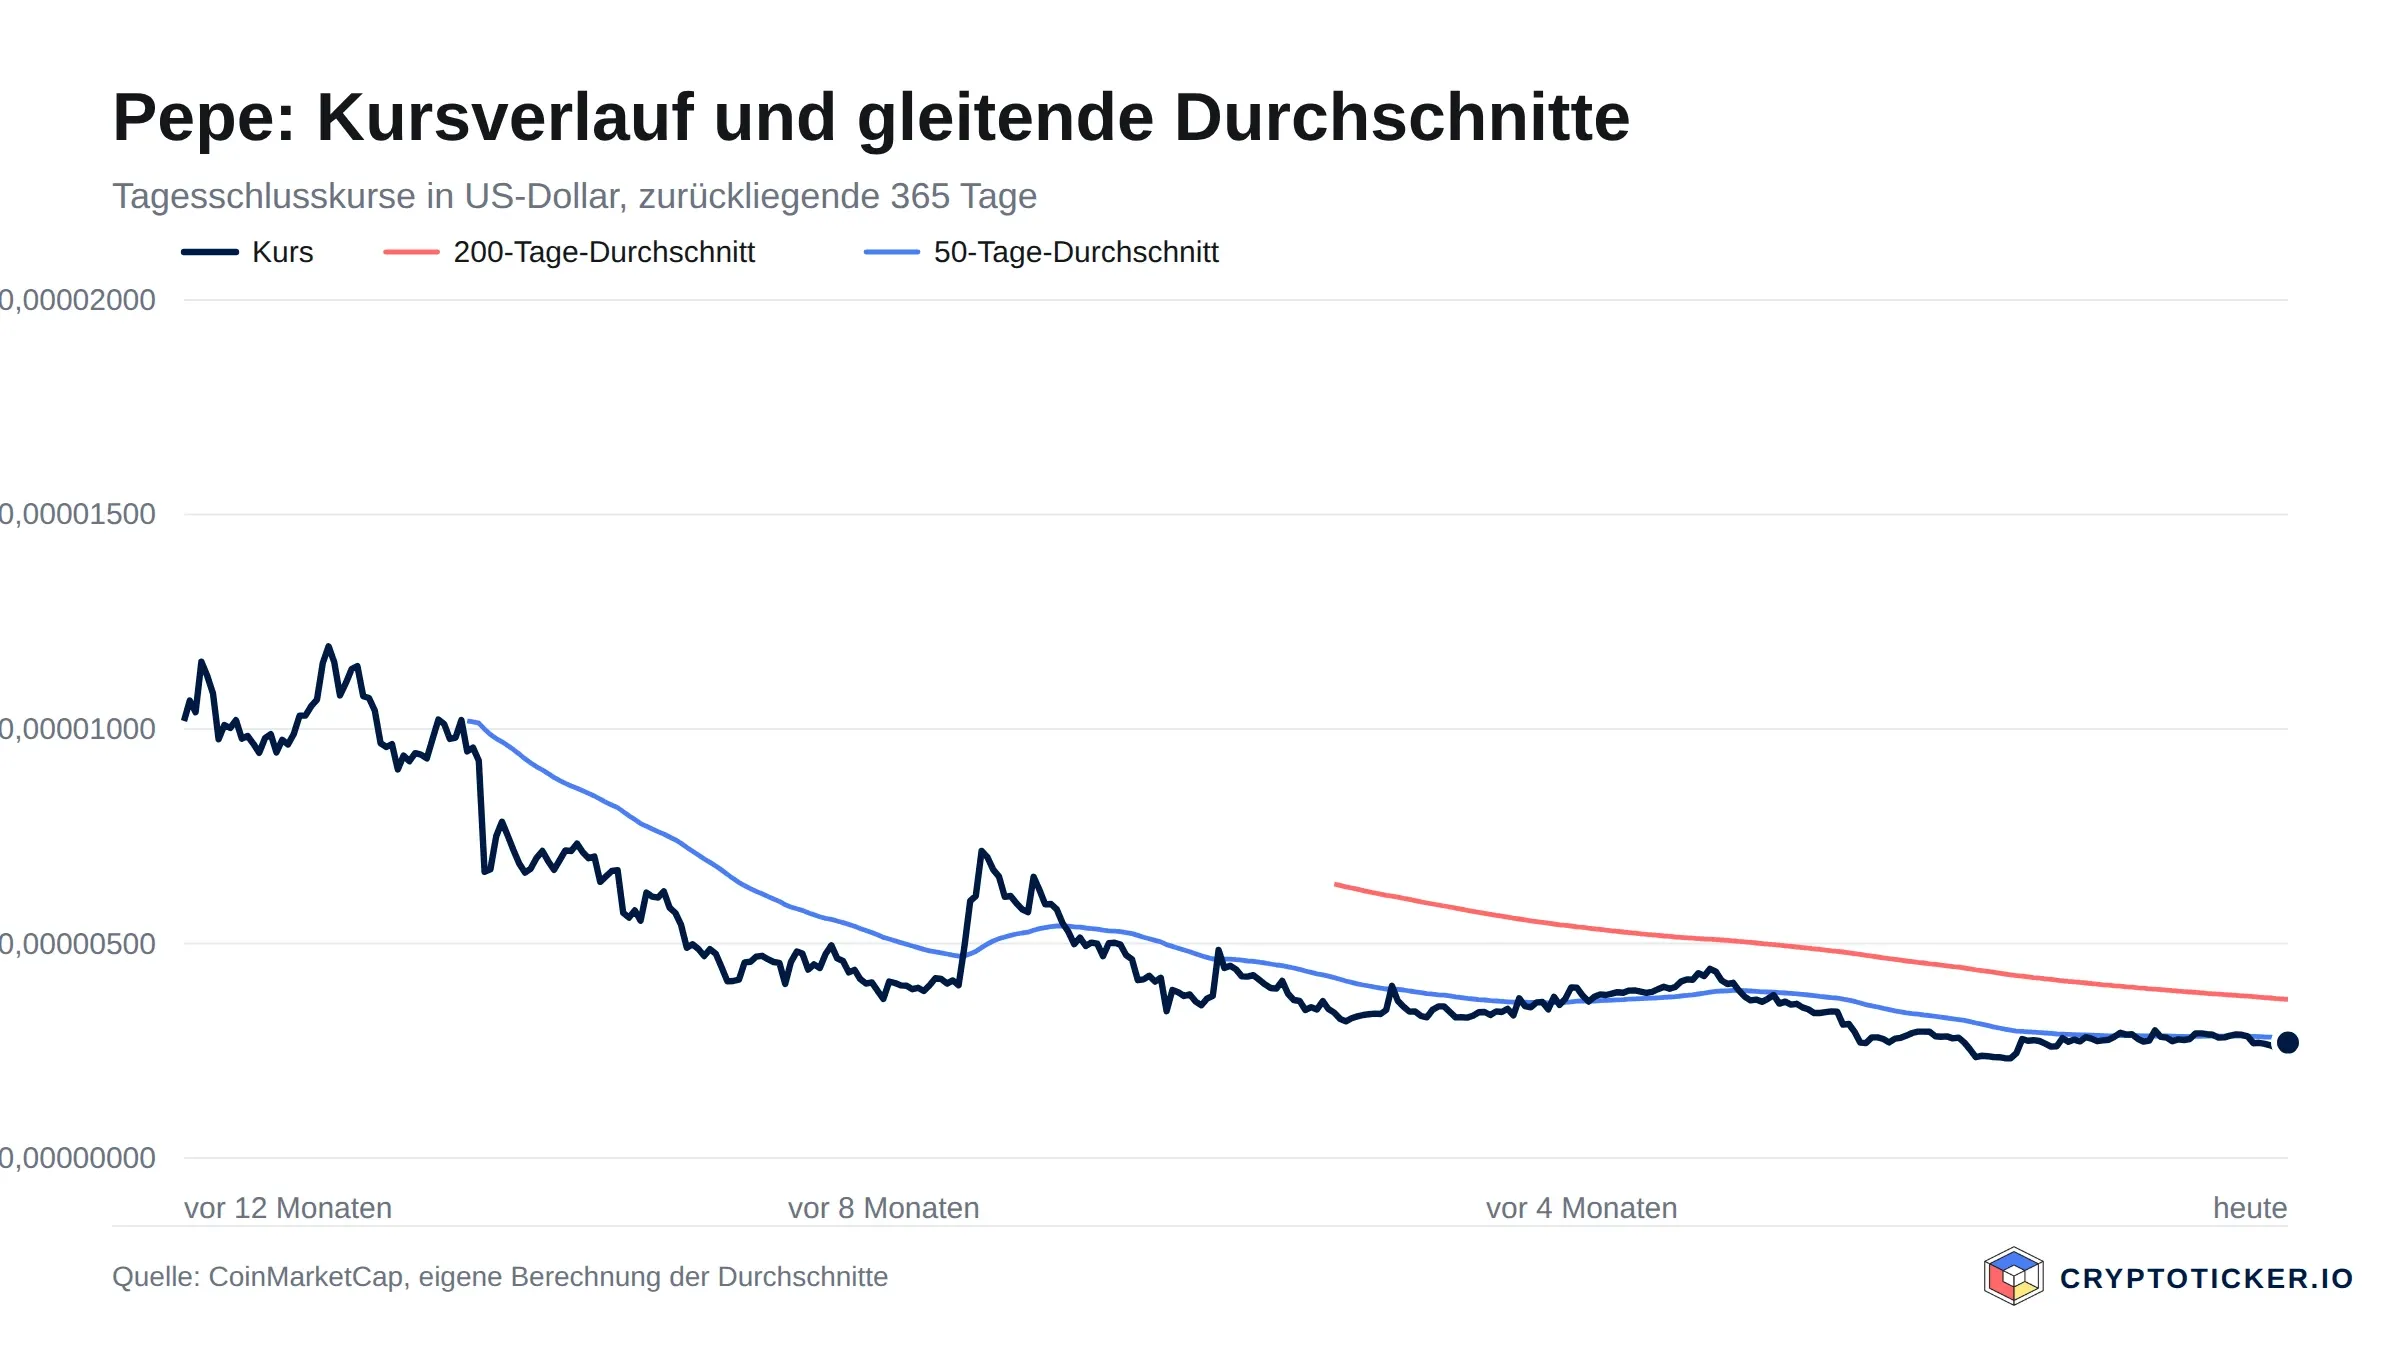
The fact that the price has reclaimed the 50-day average, so that both lines now sit below it, gives the setup its short-term confirmation back. As long as PEPE holds above the 200-day moving average at $0.00000370, the upward impulse off the July low remains technically intact. Should the coin lose that level too, $0.00000232 comes back into focus, and the price can then drop quickly to the $0.000002 mark.
Is the PEPE Downtrend Broken or Merely Interrupted
Over twelve months the picture is still a loss. At around 43.0 percent below the high of $0.00000733, the twelve-month trend has not turned. On the chart, however, what was missing in the summer is holding: the 200-day moving average at $0.00000370 has been reclaimed, it is rising again, and the price has held above that line instead of merely testing it briefly. The long-term downtrend is therefore interrupted. A reversal would only be confirmed by a breakout above the highs of recent weeks.

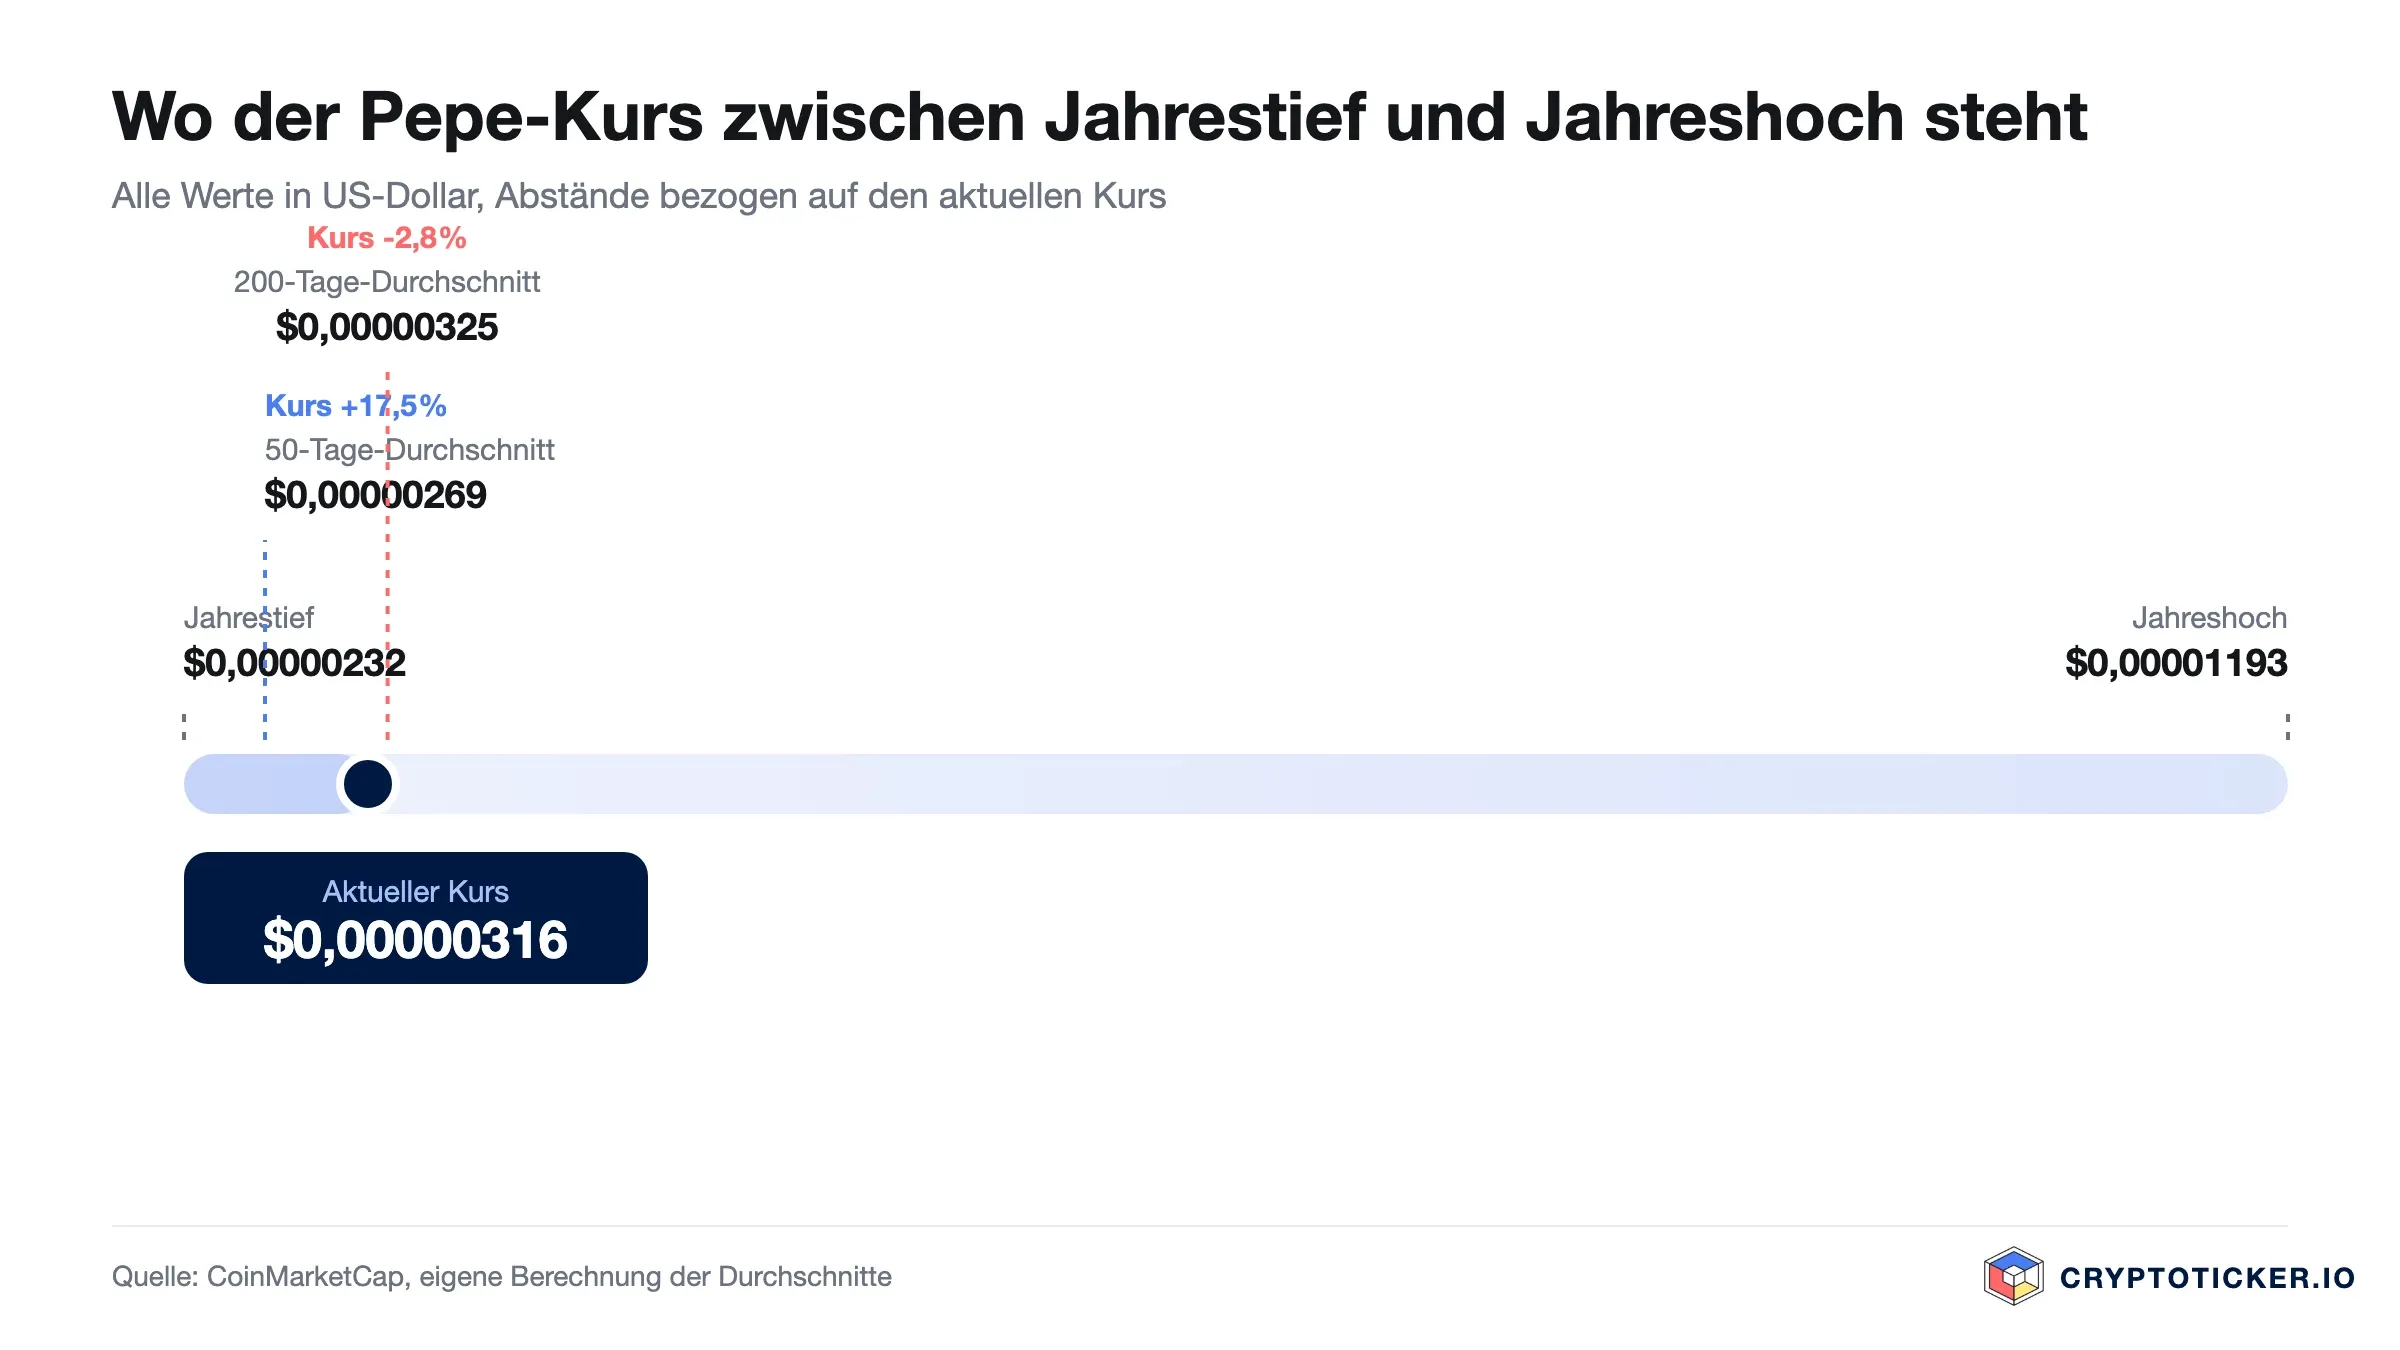
The short-term picture is split. The price tested the twelve-month low twice, held on the second attempt and has gained 79.7 percent since. Of the last six weekly candles, however, only two are green, and the current week is down around half a percent. The signal is therefore an intact medium-term uptrend moving sideways after 4.5 percent in 30 days, having pulled the short-term line back in the process, without the broader structure having suffered.
What RSI and Moving Averages Mean for a PEPE Entry
The daily RSI(14) stands at 52.8. That is the upper half of the neutral zone and clearly below the overheating threshold of 70. For comparison: in late September 2025, shortly before the slide from the twelve-month high, the RSI was above 70. The current reading says two things at once. The coin is NOT in extreme territory, and the recovery of the past few weeks has not yet stretched the indicator. Anyone entering now is technically not buying into an exhausted move, but no longer buying in a sell-off either.
The 50-day average has meanwhile crossed above the 200-day average. The 50-day figure of $0.00000394 now sits above the 200-day figure of $0.00000370. That picture, known in the market as a golden cross, no longer argues against a strategic entry with a long horizon for the first time since the spring. The gap between the two lines has widened to 6.6 percent, which makes the signal sturdier than at the last update; a drop back below both lines would devalue it just as quickly, though. Traders with a short-term focus have flipped their setup: entry on pullbacks to the 50-day line, stop below the 200-day average.
What PEPE Trading Volume Reveals About Demand
The 24-hour volume on October 20, 2026 is around $244 million. Measured against a market capitalisation of $1.76 billion, that is a volume-to-market-cap ratio of around 14 percent. For PEPE that reading is below average. The median daily turnover over twelve months was $253 million, a multiple of that during the peak phases of last year, and the coin's turnover has historically been the highest among the larger memecoins. The liquidity still lets larger addresses enter and exit without heavy slippage, but it is no longer a core strength, merely adequate.
The distribution of volume over the past seven days stands out. Daily turnover averages $226 million over the week, around 27 percent BELOW the thirty-day average of $311 million. The price gain of the past 30 days therefore came with easing rather than rising turnover; the gap has narrowed from 34 to 27 percent since the last update, because the monthly average itself has fallen. That is qualitatively different from a breakout the market confirms with money, and it remains the most important weak spot in the current situation. A genuine reversal would require days with volume well above $500 million alongside daily gains beyond 10 percent.
Which Structural Factors Speak in Favour of PEPE as a Memecoin
PEPE is an ERC-20 token on Ethereum. That is the first structural point: the coin rests on the foundation of the second-largest blockchain, with full compatibility with every serious exchange and every EVM wallet. Ethereum's roadmap continues to work on lower fees for token transfers via layer-2 solutions, and every ERC-20 token benefits from that, PEPE included. Details on the next build-out stage are set out in the official Ethereum roadmap.
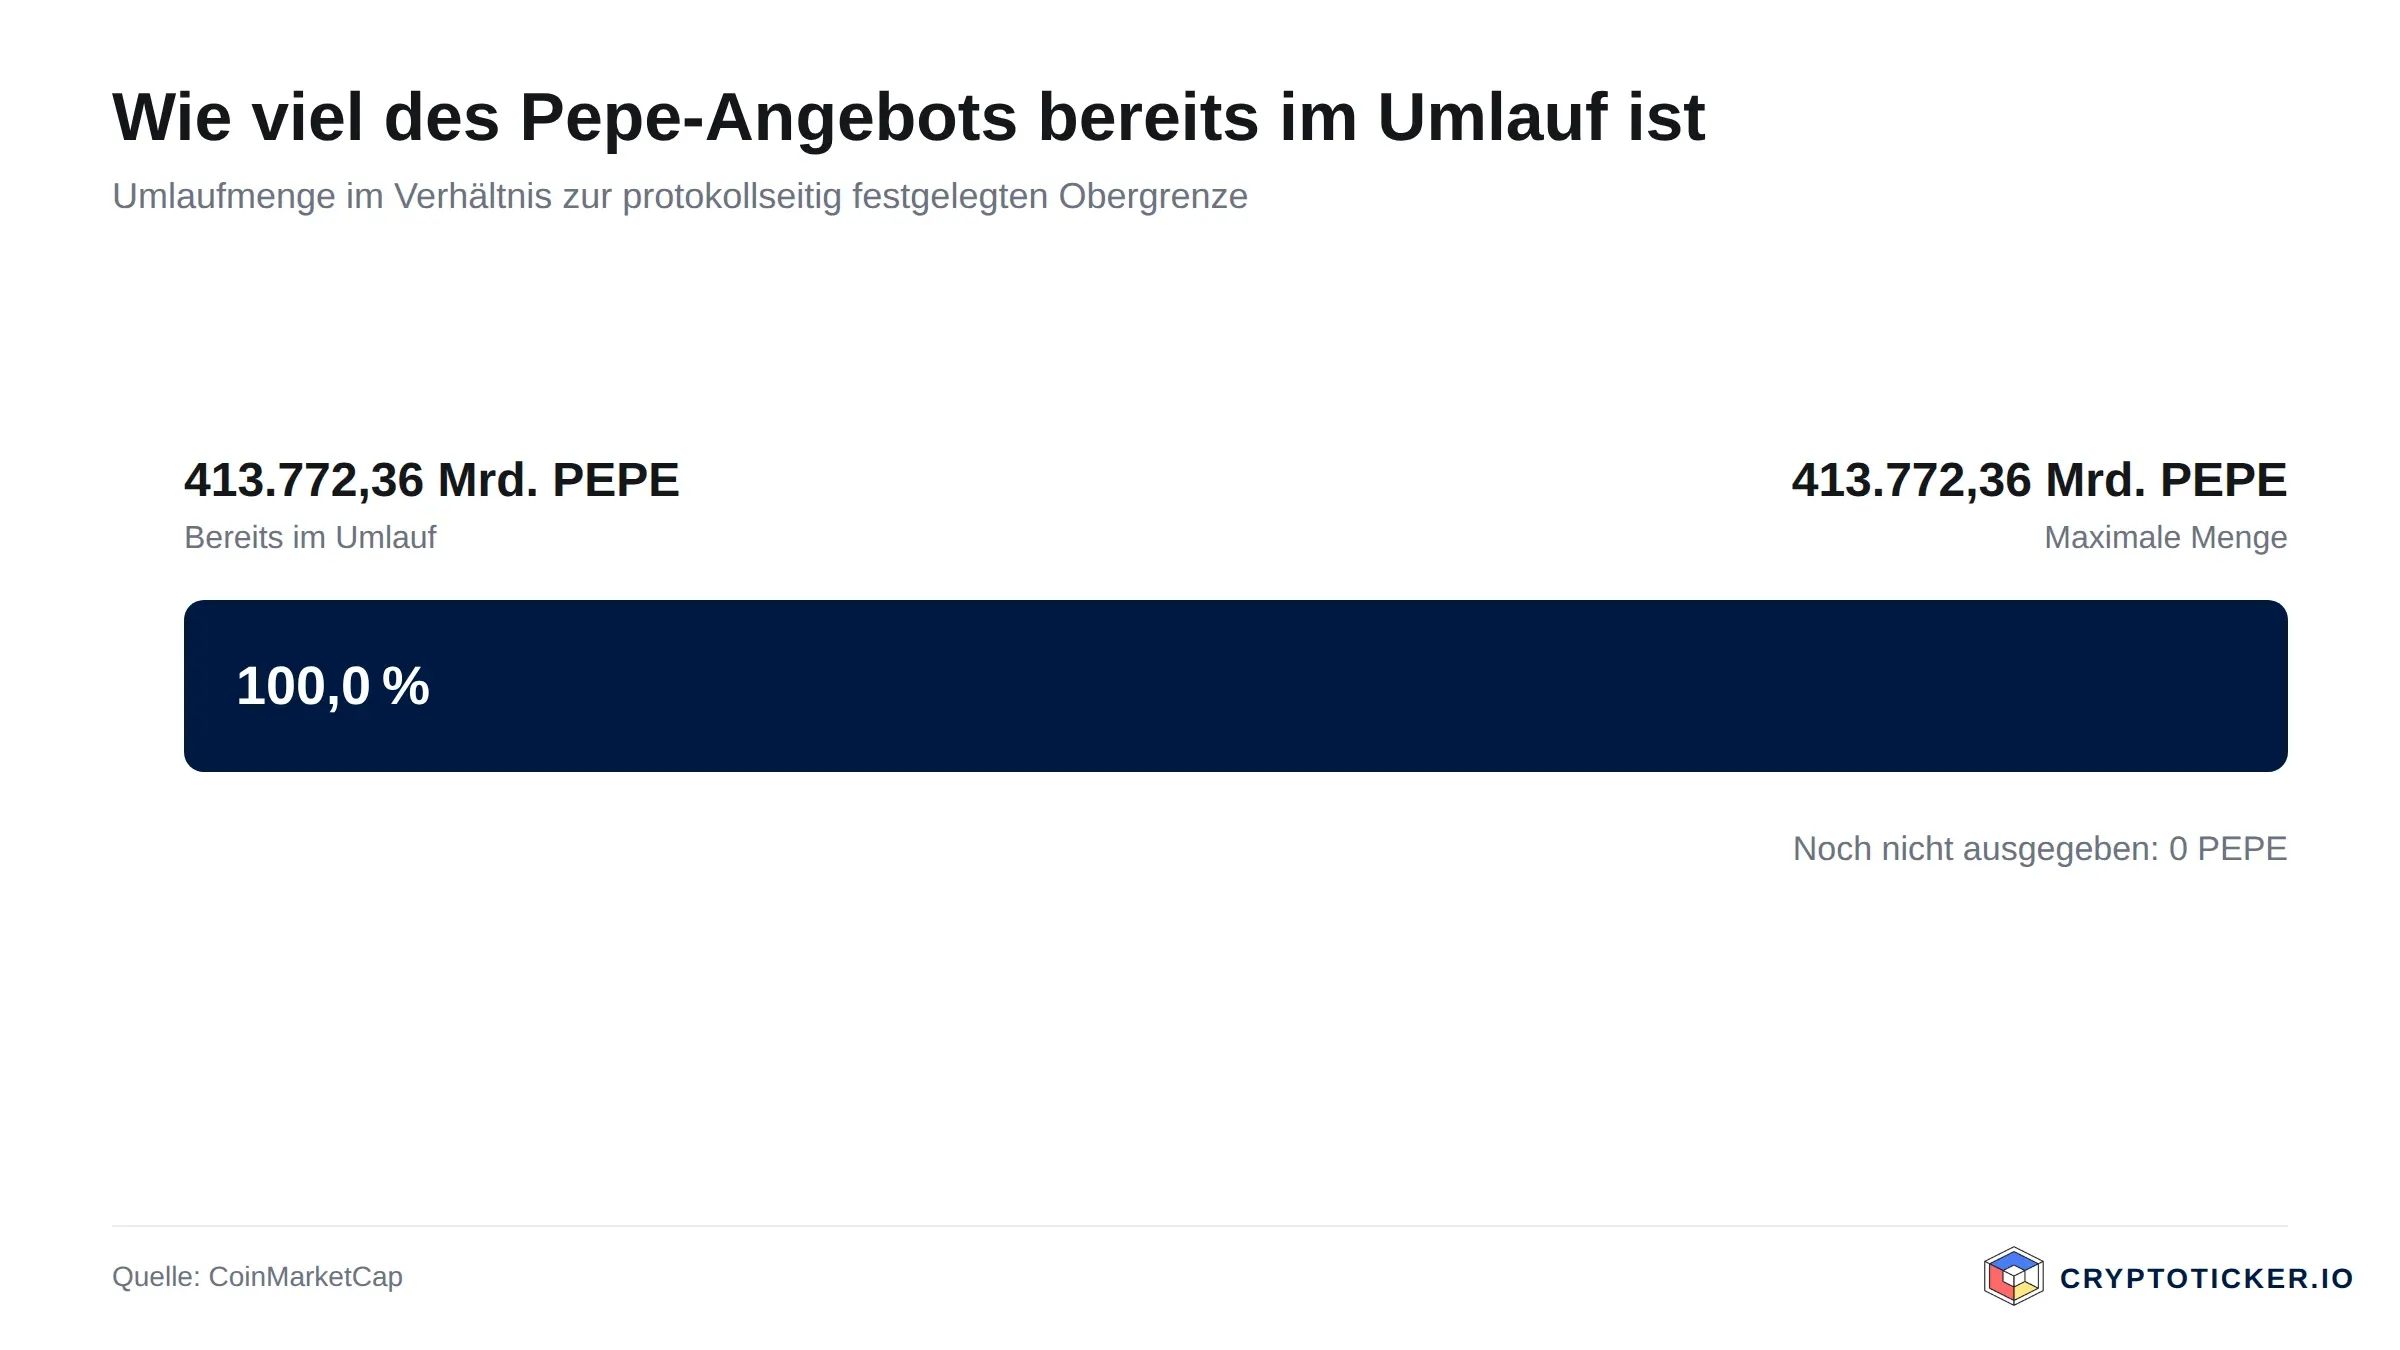
Supply is a second distinctive feature. The circulating amount is 420.69 trillion tokens, and that is at the same time the maximum supply. There is therefore NO inflation. Every price gain is driven purely by demand. With memecoins that carry no cap you cannot say the same. Rank 60 by market capitalisation is stable, and PEPE has been in the top 60 continuously since the end of 2023. For a memecoin that is an unusually long run.
The third point concerns regulation. As a pure memecoin with no utility promise, PEPE does not fall under the MiCA category of utility tokens with strict white paper obligations in Europe. Trading itself remains subject to securities supervision law, and the European supervisory authority ESMA tightened in 2025 what exchanges must disclose on highly speculative assets. Details on European crypto supervision are available on the ESMA website. For you as an investor that means exchanges with a MiCA licence must actively inform you about the loss risks before you buy.
What Speaks FOR Buying PEPE at the Current Price
First, the distance to the upside. From the current level of $0.00000418 to the twelve-month high of $0.00000733 there is around 75 percent of price potential in purely arithmetical terms. Swings of that size are historically documented for PEPE and have occurred several times.
Second, market sentiment. The Fear and Greed Index stands at 55, which places it just inside greed territory, after 53 and neutral at the last update. Greed regimes typically push investors into the riskier segments of the market, and memecoins are the riskiest segment category there is; that tailwind is coming back, but weakly. The potential for capital inflows remains, the trigger for it is still small.
Third, the hard supply cap of 420.69 trillion tokens. No new issuance, no dilution, no vesting unlocks that will weigh on the market later. What is in circulation today stays there.
What Speaks AGAINST Buying PEPE at the Current Price
First, the long-term trend. A twelve-month loss of 41.6 percent is a structure rather than a snapshot. The 200-day line at $0.00000370 has been reclaimed, but only a breakout above the highs of recent weeks removes the suspicion that the recovery is an interim move. The fact that the advance ran on easing volume feeds that suspicion.
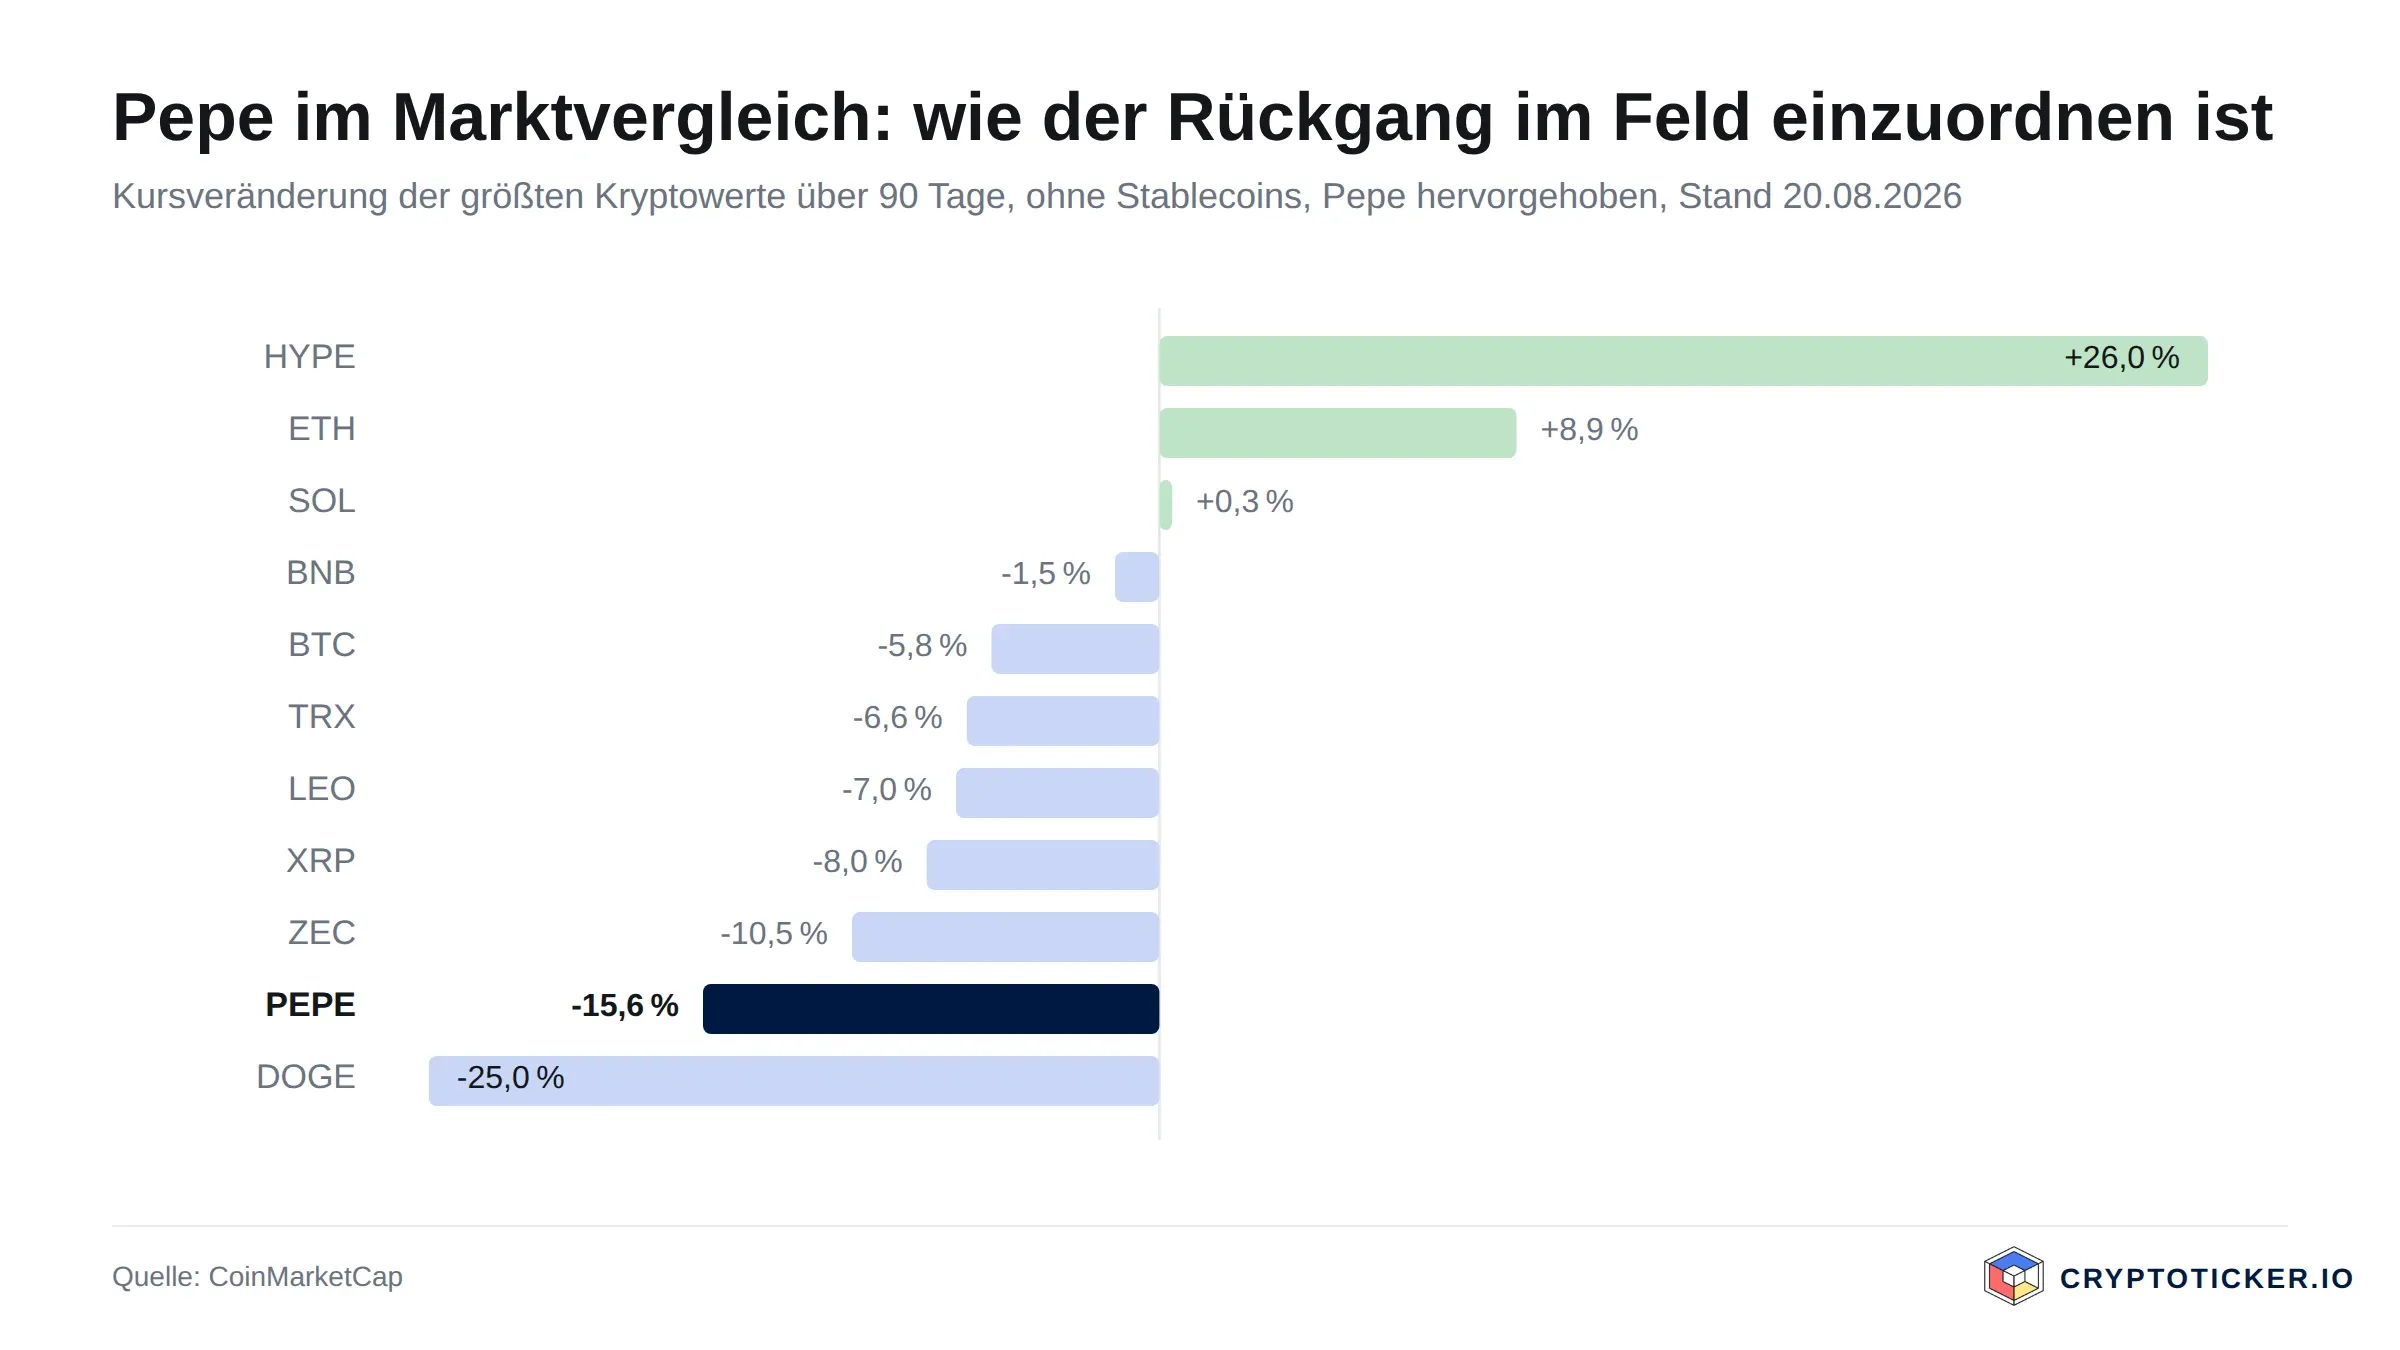
Second, the missing fundamental story. PEPE has no utility application, no staking yield, no protocol roadmap, no cash flow basis. The price rises and falls solely with the attention flowing to the coin. When attention fades, the price fades. Bitcoin and Ethereum have a structural valuation base; PEPE has none.
Third, the competitive environment. New memecoins appear every week. Market share in fresh attention is a zero-sum game: what a new trending coin gains, an existing one loses. PEPE has held its place in the top 60, yet the next hype-driven rival can pull capital away at any time.
How to Buy PEPE at the Current Price
The simplest route runs through a regulated crypto exchange with a MiCA licence in the EU. Providers such as Kraken, Bitvavo or Coinbase offer PEPE against the euro, with purchase fees between 0.15 and 0.26 percent depending on volume. The spread and the withdrawal fee matter, because both eat directly into your return. You will find a comparison of the terms in the overview of the best crypto exchanges.
For longer-term holding the token belongs in your own wallet. Since PEPE is an ERC-20 token, any EVM-compatible self-custody works: software wallets such as MetaMask or Rabby, hardware wallets such as Ledger or Trezor. With a hardware wallet the private key stays offline, which is the more sensible solution for amounts above a few hundred euros. Regulated European providers are listed in the overview of the best regulated crypto exchanges.
One point matters for your entry price: PEPE trades at the weekend just as it does during the week, but volume typically collapses on Sunday. If you are building a larger position, spread it across several buy orders, ideally during active trading hours. And check before every purchase whether your provider actually lists the PEPE token on Ethereum and not a copy of the same name on another chain. The risk of confusion is high with memecoins.
So Is PEPE a Good Buy at the Current Price
In the short term the setup has turned again, this time for the better. At $0.00000418 the price sits 5.9 percent above the 50-day average of $0.00000394, 12.8 percent above the 200-day average of $0.00000370 and 79.7 percent above the twelve-month low. The daily close back above the 50-day line that the last update demanded as confirmation has therefore arrived: the brief slip below it was a test, not a break. Anyone buying now buys 12.8 percent above the line that serves as the hedge, and therefore more expensively than at the last update. On top of that, the advance of the past weeks ran on easing volume; the gap to the monthly average has narrowed from 34 to 27 percent since, but trading remains below that average.
The long term requires a different answer. With no utility promise, no cash flow basis and a twelve-month loss of 41.6 percent, PEPE is no core holding. The coin is a highly speculative addition whose value consists entirely of attention. As such it belongs in the riskiest corner of a diversified portfolio, with a position size that makes a total loss bearable.
The assumption that the upward impulse since the July low is holding counts as refuted if the price falls sustainably below the 200-day average of $0.00000370 on a daily closing basis. Should PEPE drop under the twelve-month low of $0.00000232, the target shifts to $0.000002 and lower. Buying under this assumption always means one thing as well: defining a clear stop.
Buying PEPE: What You Take Away
- The current PEPE price of $0.00000418 sits 5.9 percent above the 50-day average and 12.8 percent above the 200-day average at $0.00000370. If you want to read the technical starting position in detail, you will find the target corridors in our PEPE price prediction.
- As a pure memecoin with no utility promise, PEPE is a highly speculative addition to a portfolio. To choose a suitable trading platform, the overview of the best crypto exchanges helps.
- For longer holding periods the token belongs in an EVM-compatible wallet, ideally a hardware solution. You can see which European providers are regulated for this in the overview of the best regulated crypto exchanges.
Disclosure: some of the providers named in this article work with us through partner programmes. This has no influence on the price analysis or the assessment of the chart situation; the price data comes from a public market data source and can be verified there.
(As of October 20, 2026. This article is not investment advice. Prices and fee structures change; check the terms with the provider before you buy.)
Transparency note: This article was produced with the assistance of artificial intelligence and reviewed by our editorial team before publication. All figures and claims were checked against the primary sources linked in the text. The feature image was generated with AI.
Related articles
Which topics should we dive deeper into?
Select what genuinely interests you. Your picks feed directly into our editorial planning.
Crypto news that's actually worth your time.
Weekly. 60 seconds. Carefully curated by our editors: no hype, no promo flood, no spam.

August 27, 2026 2:21 AM

Is SUI a Good Buy at Current Prices?
SUI is holding its 200-day moving average and trades 51 percent above its twelve-month low, with the 50-day line now above the 200-day. We check whether the coin is a good buy at current prices.
August 16, 2026 12:21 PM

Is Toncoin a Good Buy at Current Prices?
Toncoin, now traded as Gram (GRAM), has fallen back below both moving averages and the September breakout has failed. What the Telegram wallet, volume and the base mean now: is Toncoin a good buy at current prices?

September 28, 2026 9:47 AM
XRP Price Drops Below $1.50: Where Is Ripple Heading This Week?
XRP price slips under $1.50 after a red weekend. Here is the XRP price analysis with the higher and lower targets that matter this week.
August 24, 2026 12:50 AM
Is Bitcoin Cash a Good Buy at Current Prices?
Bitcoin Cash has held its summer gains but the rally has stalled: the price now sits right on its 50-day line with the RSI back to neutral and turnover halved. We work through what speaks for and against buying BCH at current prices.
August 24, 2026 12:34 AM
Is Monero a Good Buy at Current Prices?
Monero broke above the level we named in September as the test for a trend change. What the breakout, an overbought RSI and EU rules mean now: is Monero a good buy at current prices?
August 24, 2026 12:19 AM

Is Zcash a Good Buy at Current Prices?
Zcash has given back part of its September advance and now sits just above its 50-day average. We look at what the trend, the RSI and the turnover actually support, and under which conditions the case for buying ZEC breaks down.
August 3, 2026 10:41 AM
Is XRP Coin a Good Buy At Current Prices?
XRP trades at $1.29 and has lost both moving averages, with the 50-day EMA dropping back below the 200-day on 17 October. Why the $1.20 shelf now decides where the recovery finds its floor.
February 17, 2026 8:06 AM

PEPE Price Prediction: 23% Surge Ignites Recovery as Bitcoin Reclaims $70k
PEPE price jumped 23% as Bitcoin hit $70,000. Analyze the technical breakout, whale accumulation, and why this memecoin remains a high-volatility leader in 2026.

September 20, 2026 1:27 PM

Why Is PEPE Rising Right Now? Three Explanations Circulate, None Is Documented
PEPE has been up by double digits for a week, and three reasons for it are doing the rounds online: whales are buying, a fund is coming, a large buyback is due. We checked all three. What the data really says, and how you tell whether a crypto report is worth anything.
January 13, 2026 10:11 AM

PEPE Was Up 50% in Early 2026: Did PEPE Coin Break the Descending Triangle?
PEPE gained about 50% in the first days of 2026 and pressed against a descending triangle. It broke lower instead: the support at $0.0000040 gave way and PEPE fell to about $0.0000023 in July.
October 21, 2026 12:33 AM

Is Worldcoin a Good Buy at Current Prices?
Worldcoin has reclaimed both of its moving averages, and the 50-day line has crossed above the 200-day line for the first time this year. Whether that makes WLD a buy depends on the locked supply and on whether demand holds.
September 20, 2026 9:21 AM

Is Ethena a Good Buy at Current Prices?
Ethena has rebounded hard off its twelve-month low and still trades far below its high. Is ENA a good buy at current prices? We check the chart, the supply schedule and the source of the yield with our own price data.
October 12, 2026 10:27 AM
Is Bitcoin Still a Good Investment in October 2026?
Spot ETFs have changed who sets the Bitcoin price, and the easy repricing is behind us. What still supports BTC, what could break it, and how much belongs in a portfolio today.
August 27, 2026 11:25 AM
Is Pump.fun a Good Buy at Current Prices?
PUMP now sits only just above its 50-day average and still trades below its twelve-month high. We check with our own price data what argues for and against buying Pump.fun at the current price.
August 27, 2026 6:38 AM

Is NEAR Protocol a Good Buy at Current Prices?
NEAR has nearly tripled since August, and the trend break we defined back then has happened. What ETF buying, leverage and issuance mean now: is NEAR Protocol a good buy at current prices?
August 27, 2026 6:23 AM

Is Bittensor a Good Buy at Current Prices?
Bittensor has passed the trend test we set in August: a weekly close above the 200-day average and a moving-average crossover in September. What the correction since the peak means: is Bittensor a good buy at current prices?
August 27, 2026 3:39 AM

Is Cronos a Good Buy at Current Prices?
Cronos has reclaimed its 200-day line for the first time since the spring, and the RSI is back out of overbought. We weigh what speaks for and against buying CRO at the current price.
August 26, 2026 4:21 AM

Is Uniswap a Good Buy at Current Prices?
Uniswap has gained about three quarters since August, and the trend test we set back then has been passed. What the fee switch, CME futures and the correction since September mean now: is Uniswap a good buy at current prices?
May 18, 2026 1:07 PM

Is Solana a Good Buy in 2026? SOL Price Analysis and Potential ROI
Solana (SOL) trades at $104.40 after clearing the $100 resistance. Here's how SOL's potential returns stack up against BTC, ETH, and XRP.
February 11, 2026 7:05 AM
5 Things to Look for BEFORE Buying Bitcoin
Thinking about entering the crypto market? Discover the 5 essential factors to check before you buy Bitcoin to secure your investment and strategy.
October 10, 2024 10:42 AM
PEPE Price Analysis: How Can PEPE Price Surge 1000% By 2025?
The PEPE token story has been a successful one since its 2023 launch, so here is the PEPE price analysis for 2024 and the PEPE price prediction for 2025...
September 19, 2026 4:20 PM

Is Ondo a Good Buy at the Current Price?
Ondo holds its 200-day line, which the 50-day line crossed above in September, but the price has slipped back under the 50-day line. We examine the chart position, trading volume and supply mechanics, and set out what argues for and against buying the ONDO token.
August 31, 2026 11:20 PM
Is Mantle a Good Buy at Current Prices?
Mantle has rebounded hard from its summer low but still trades below its 200-day line, and nearly half the eventual supply has yet to reach the market. We weigh what speaks for and against buying MNT at the current price.
August 29, 2026 4:26 PM
Is Aster a Good Buy at Current Prices?
Aster sits above both moving averages and at the same time far below its high since listing. We assess whether the token is a good buy at the current price and why the supply still to be released remains the weightiest objection.
August 23, 2026 2:21 PM
Is Hyperliquid a Good Buy at Current Prices?
HYPE slipped below its 50-day average in October, triggering the test we set in September. What buybacks, team sales and leverage mean now: is Hyperliquid a good buy at current prices?
October 9, 2026 1:06 PM

Ethereum Price Under $2,500: Is ETH a Good Buy Right Now?
Ethereum has slipped below $2,500 and the question in every chat group is the same: buy the dip, or stay out? Here is what is driving the price, what the near-term levels are, and what the long-term forecasts actually assume.

July 17, 2026 7:55 PM
Is XRP a Good Investment in 2026? Price Analysis and Prediction
XRP has broken out of its summer range but has traded back below its 200-day average since 13 October 2026 — without the catalyst the market waited a year for. What the chart, the CLARITY Act and 2026 forecasts really say.
More from CryptoTicker