
Is Ethereum a Good Buy at Current Prices?
Ethereum has fallen further than Bitcoin and recovered better of late. What chart structure, the fee mechanism and trading volume say about buying at current prices.





Which topics should we dive deeper into?
Select what genuinely interests you. Your picks feed directly into our editorial planning.
Crypto news that's actually worth your time.
Weekly. 60 seconds. Carefully curated by our editors: no hype, no promo flood, no spam.
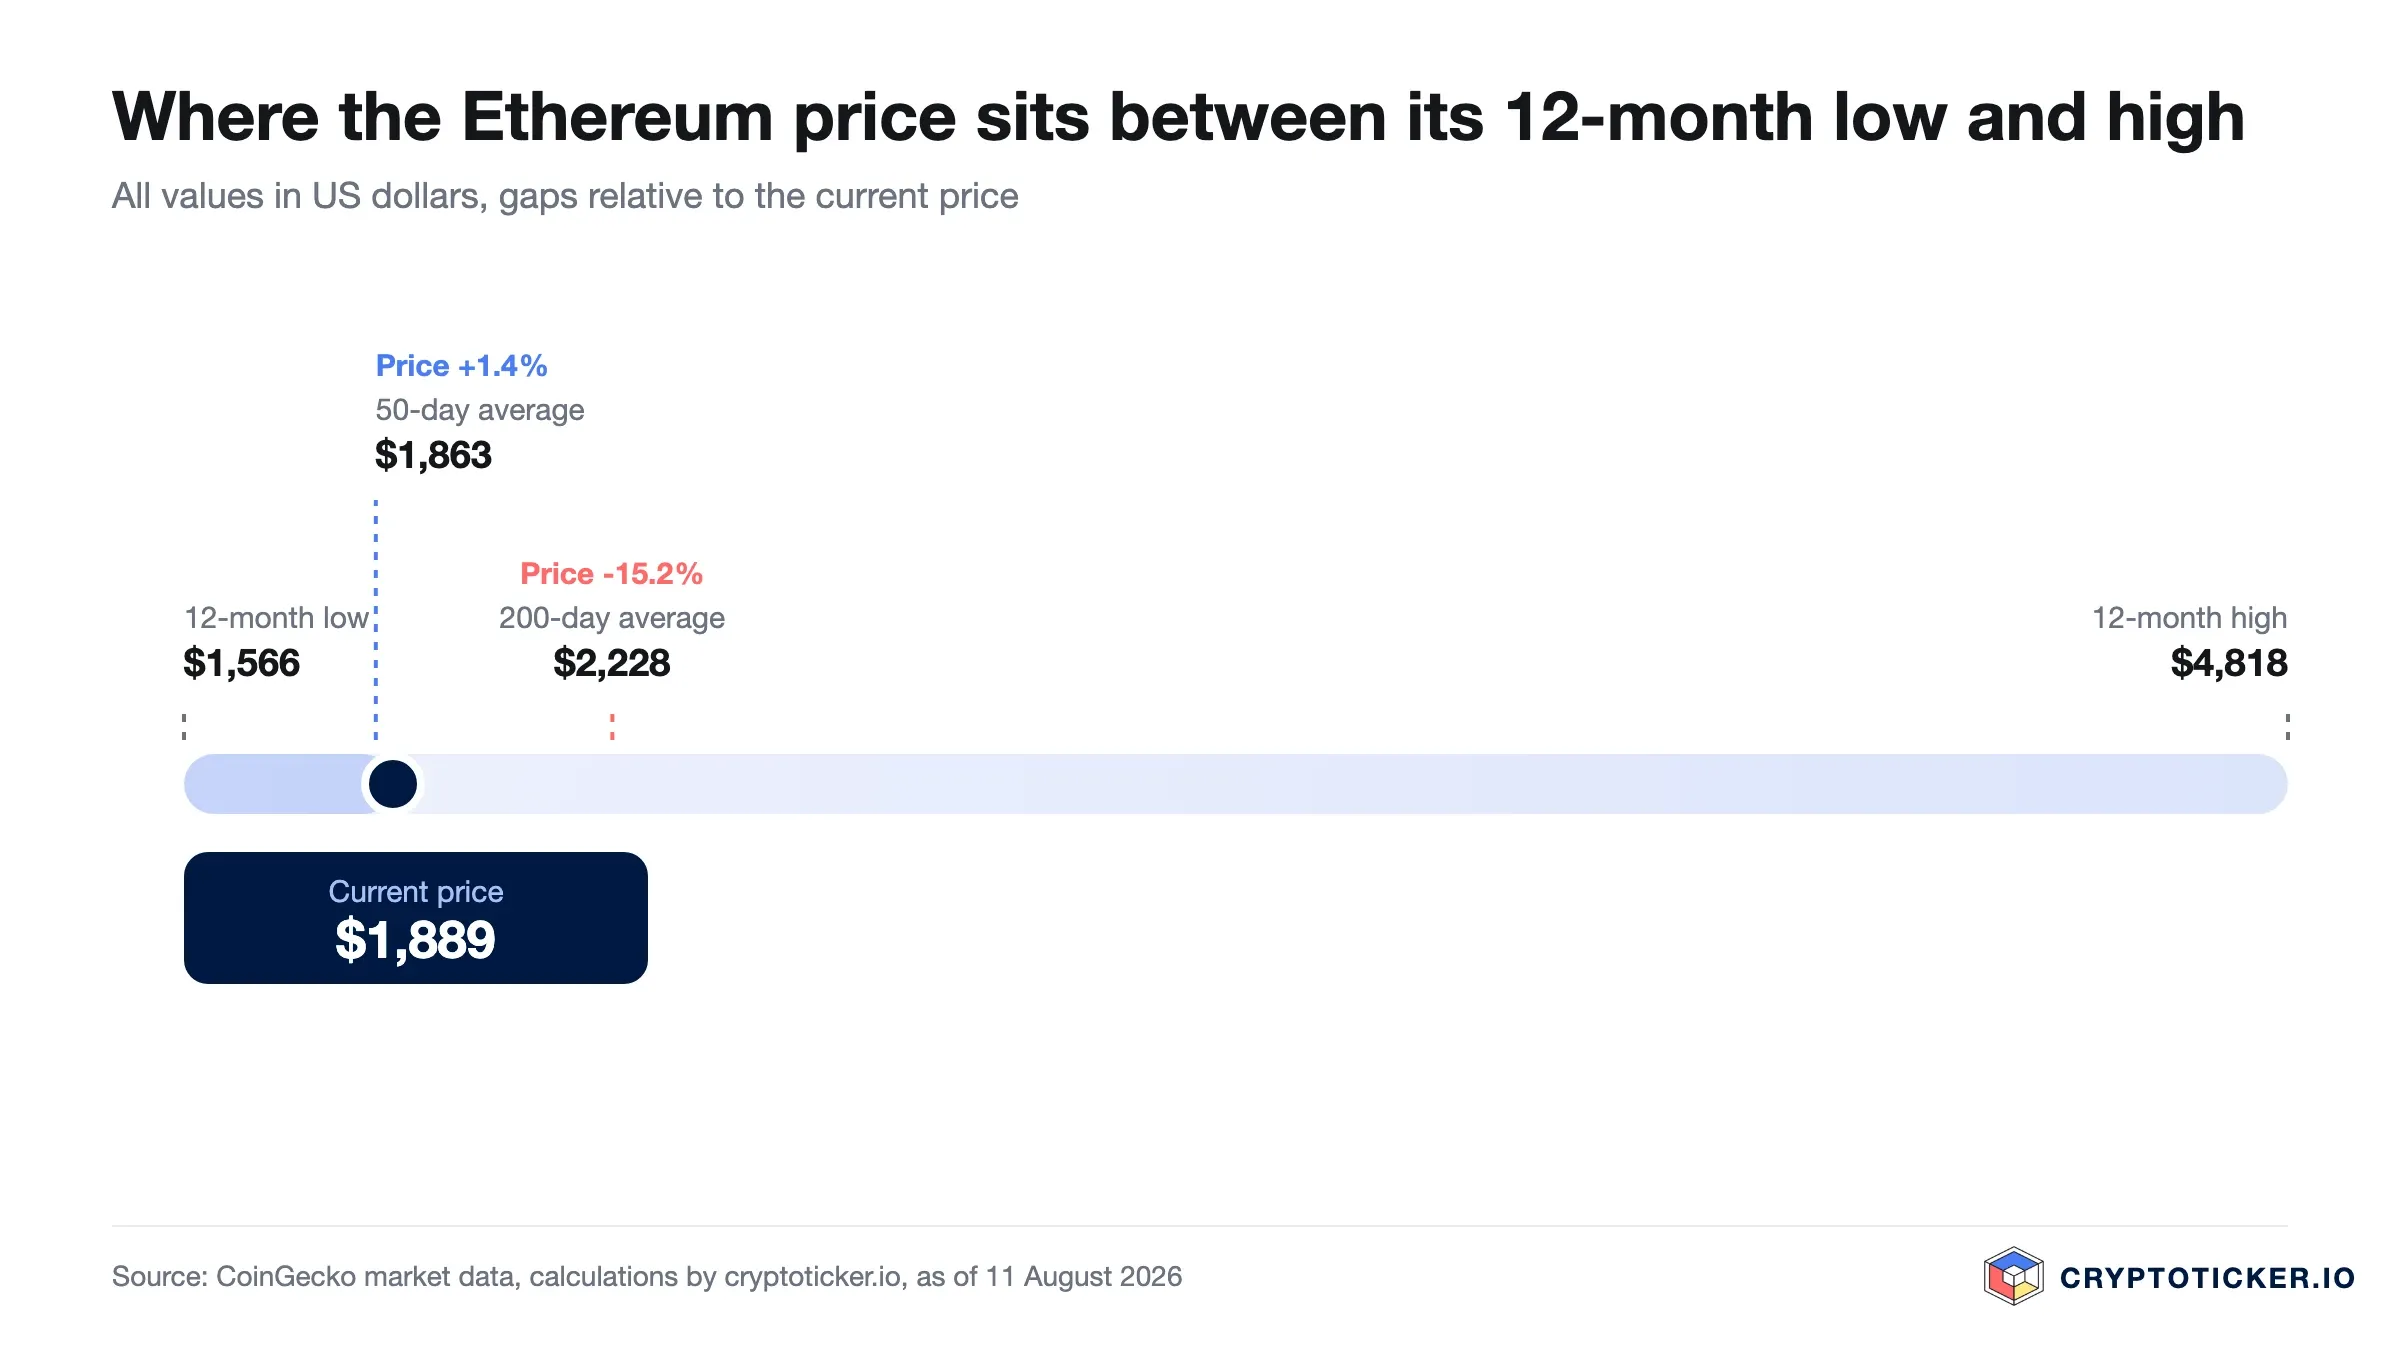
Ethereum trades at roughly $2,722 on 5 October 2026. That leaves it about 42 percent below the twelve-month high of $4,691 and 74 percent above the twelve-month low of $1,566. Over the past 30 days the price is up 9.7 percent.
Over twelve months Ethereum has therefore still fallen considerably further than Bitcoin, yet it has also rebounded more strongly in recent weeks. Taken together, that makes the buying decision harder rather than easier. This article sets out what the chart supports, what demand is saying, and the conditions under which an entry at current prices is defensible.
The price data was compiled by cryptoticker.io on 5 October 2026. It is based on daily closing prices for the past 365 days from CoinGecko; moving averages and the relative strength index were calculated from that series using the standard formulas. Anything beyond the data is marked as assessment.
Ethereum price analysis: where does the Ethereum price stand in October 2026?
The 200-day moving average sits at $2,323. The price trades 17.1 percent above it, and the line keeps rising. The dominant trend has therefore turned.
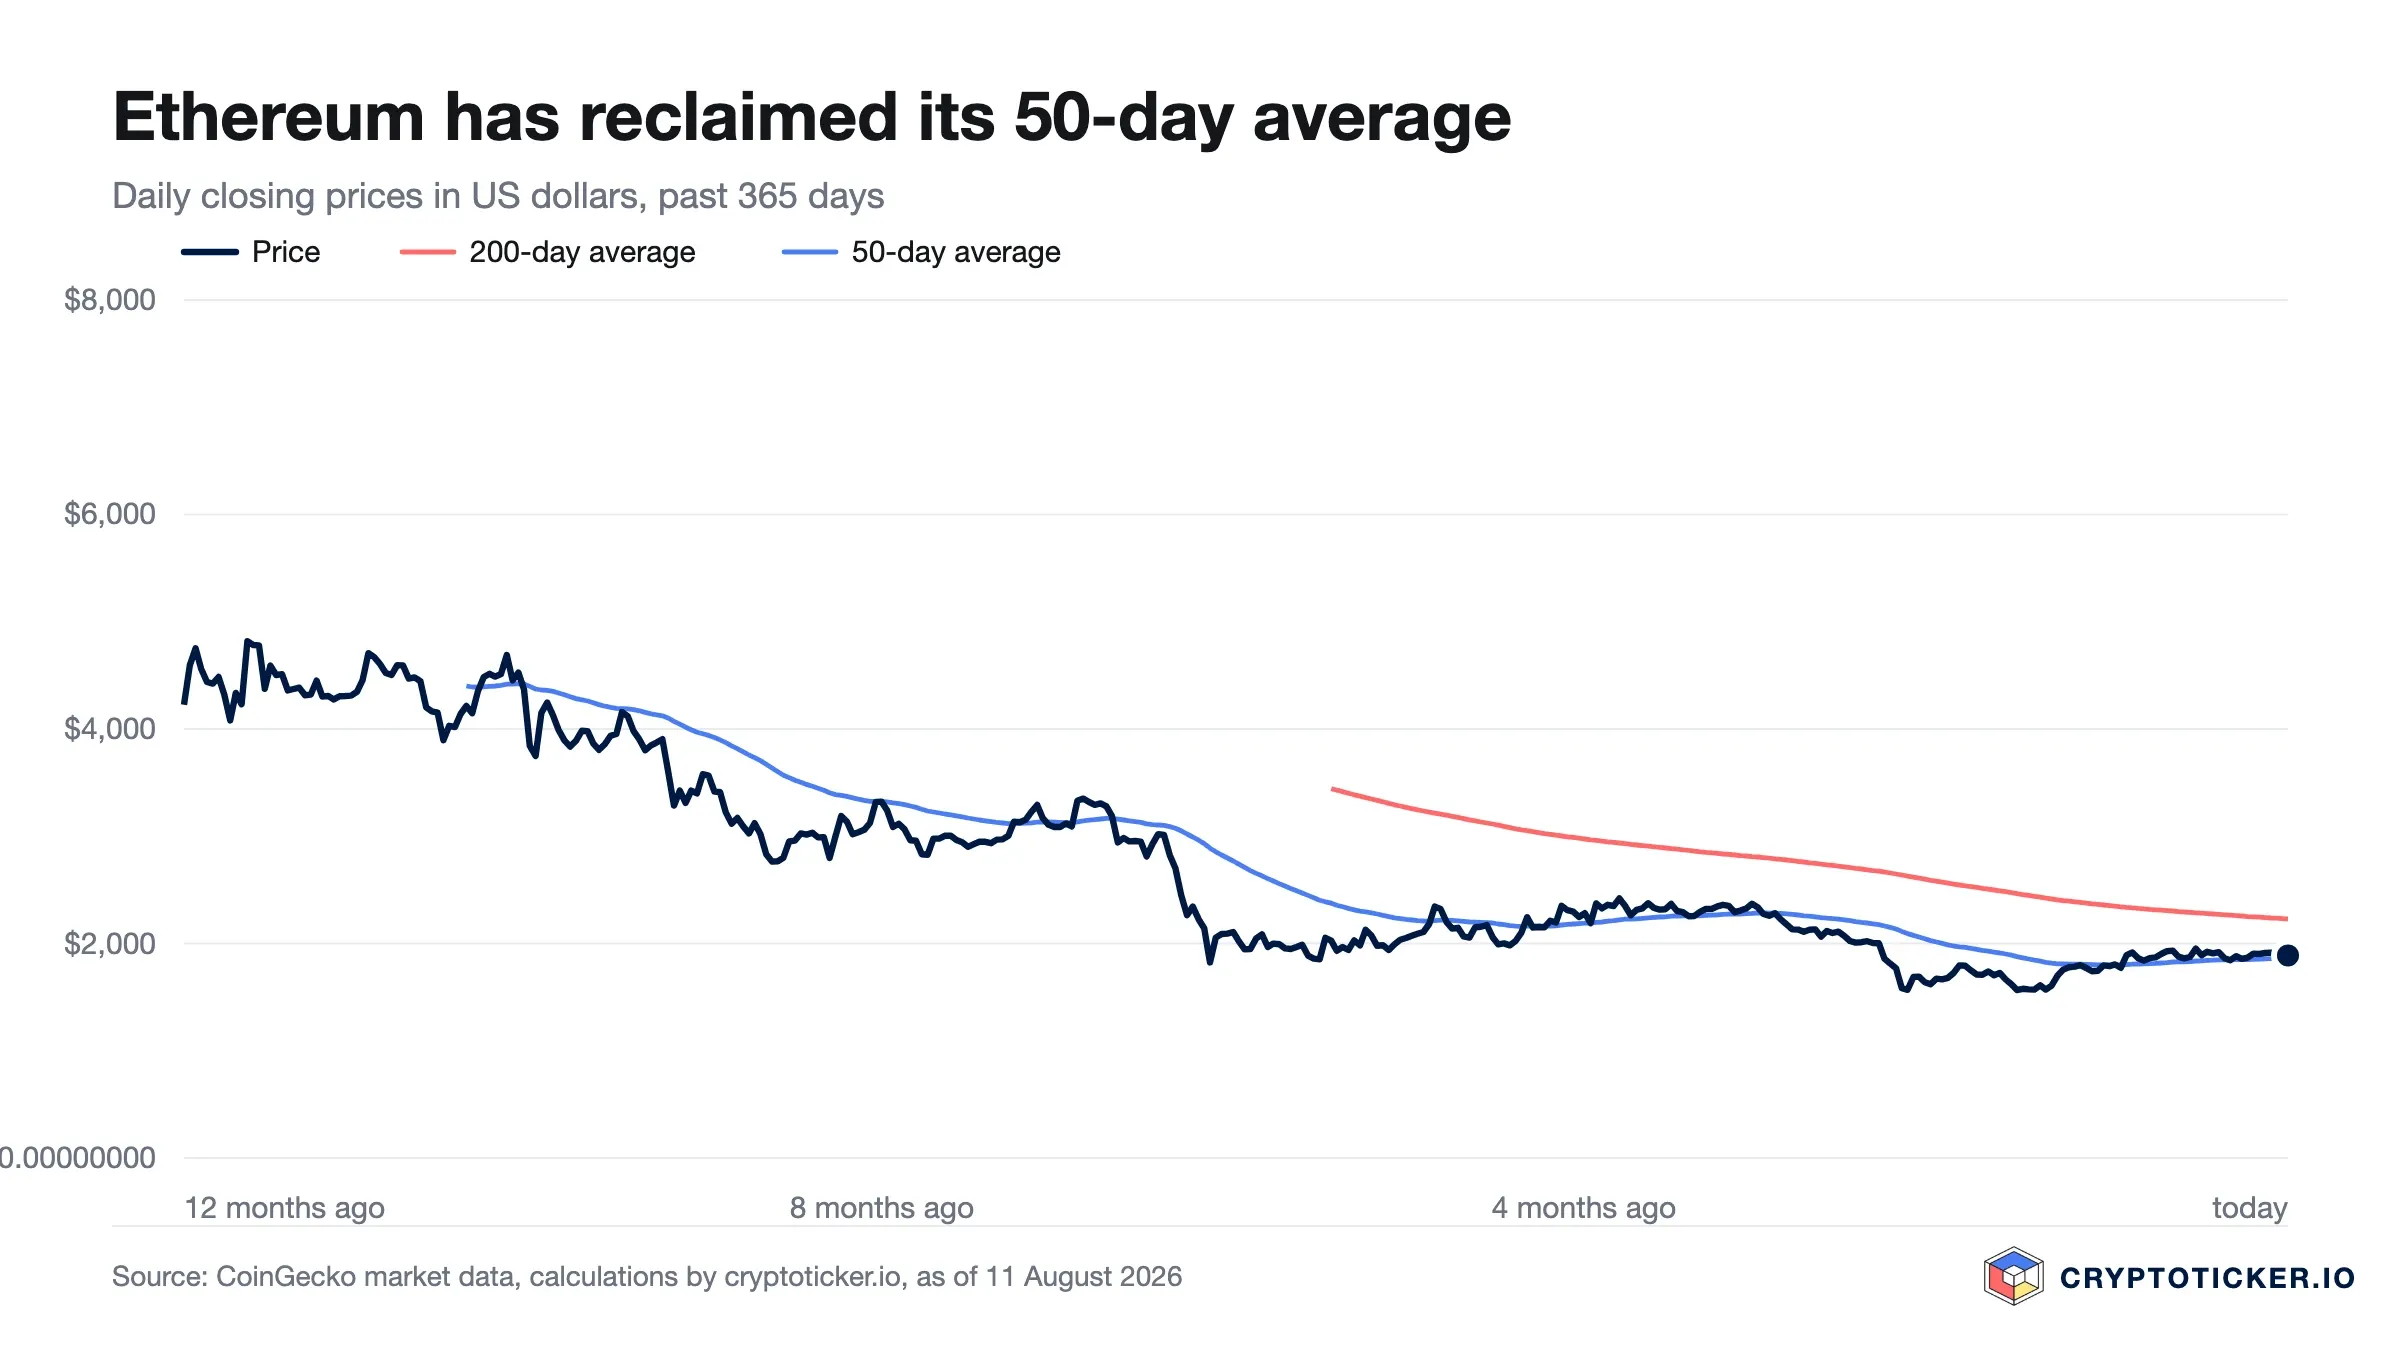
The short-term picture has firmed up as well. The 50-day moving average stands at $2,492, and the price is 9.2 percent above it. On 15 September the 50-day average also crossed above the 200-day average from below. Both lines now sit beneath the price, which was true of neither in August.
The levels that matter for an entry:
- First fallback: $2,492 at the 50-day average and $2,323 at the 200-day average, roughly 8 to 15 percent below the current price.
- Deeper support: $1,566, the twelve-month low from late June, roughly 43 percent below the current price.
- The next hurdle above: $4,691, the twelve-month high from October 2025, some 72 percent away.
Over 90 days the price is up 53.7 percent, over twelve months down 39.7 percent. The twelve-month drawdown is therefore still deeper than Bitcoin's 30.1 percent over the same period.
Is the Ethereum downtrend broken or merely interrupted?
The test that was still outstanding in August has taken place. Ethereum has traded above its 200-day average since 20 August and has not dropped back below the line for any length of time since.
The formal conditions for a change of trend are therefore met: the price sits above both averages, the 200-day line is rising again rather than falling, and the 50-day average crossed it from below on 15 September. What is missing is time. The crossing is twenty days old, and the gap between the two lines has widened to roughly 7.3 percent.
The reading has thus flipped compared with the August version: what was a counter-move inside an intact downtrend is now a young uptrend. Over twelve months the price is still down 39.7 percent. The change of trend has happened; recovering the twelve-month loss has only just begun.
What the RSI says about Ethereum demand
The relative strength index stands at 63.3, further above the 60 mark but clearly below the 70 threshold. For the buying decision this implies that Ethereum is neither overbought nor oversold. The contrarian argument that worked in June at prices around $1,570 no longer exists at this level.
An RSI around 63 describes a market with an upward bias but no excess. The technical buy signal — an RSI above 60 while volume expands — is therefore still only half in place: the reading holds the 60 mark, but volume remains below its monthly average. The 70 level, beyond which setbacks become more likely, is still some way off.
What trading volume reveals about the Ethereum price
Average daily volume over the past seven days was roughly $11.7 billion. Measured over 30 days it was $13.9 billion. Volume therefore sits 15.7 percent below its monthly average, while remaining almost double the August reading, when $6.6 billion was measured.
The caveat of the previous week therefore stands, and it has sharpened: a gap of 8.0 percent to the monthly average has become 15.7 percent. Against August, trading remains at a markedly higher level, but against its own monthly average it keeps cooling. Volume therefore supports the trend without accelerating it any longer — and an advance that continues while trading thins out rests on a narrower base.
Which structural factors support Ethereum
Ethereum is not a pure store of value but the settlement layer for applications. Two quantities follow from that, and both can be observed independently of the price.
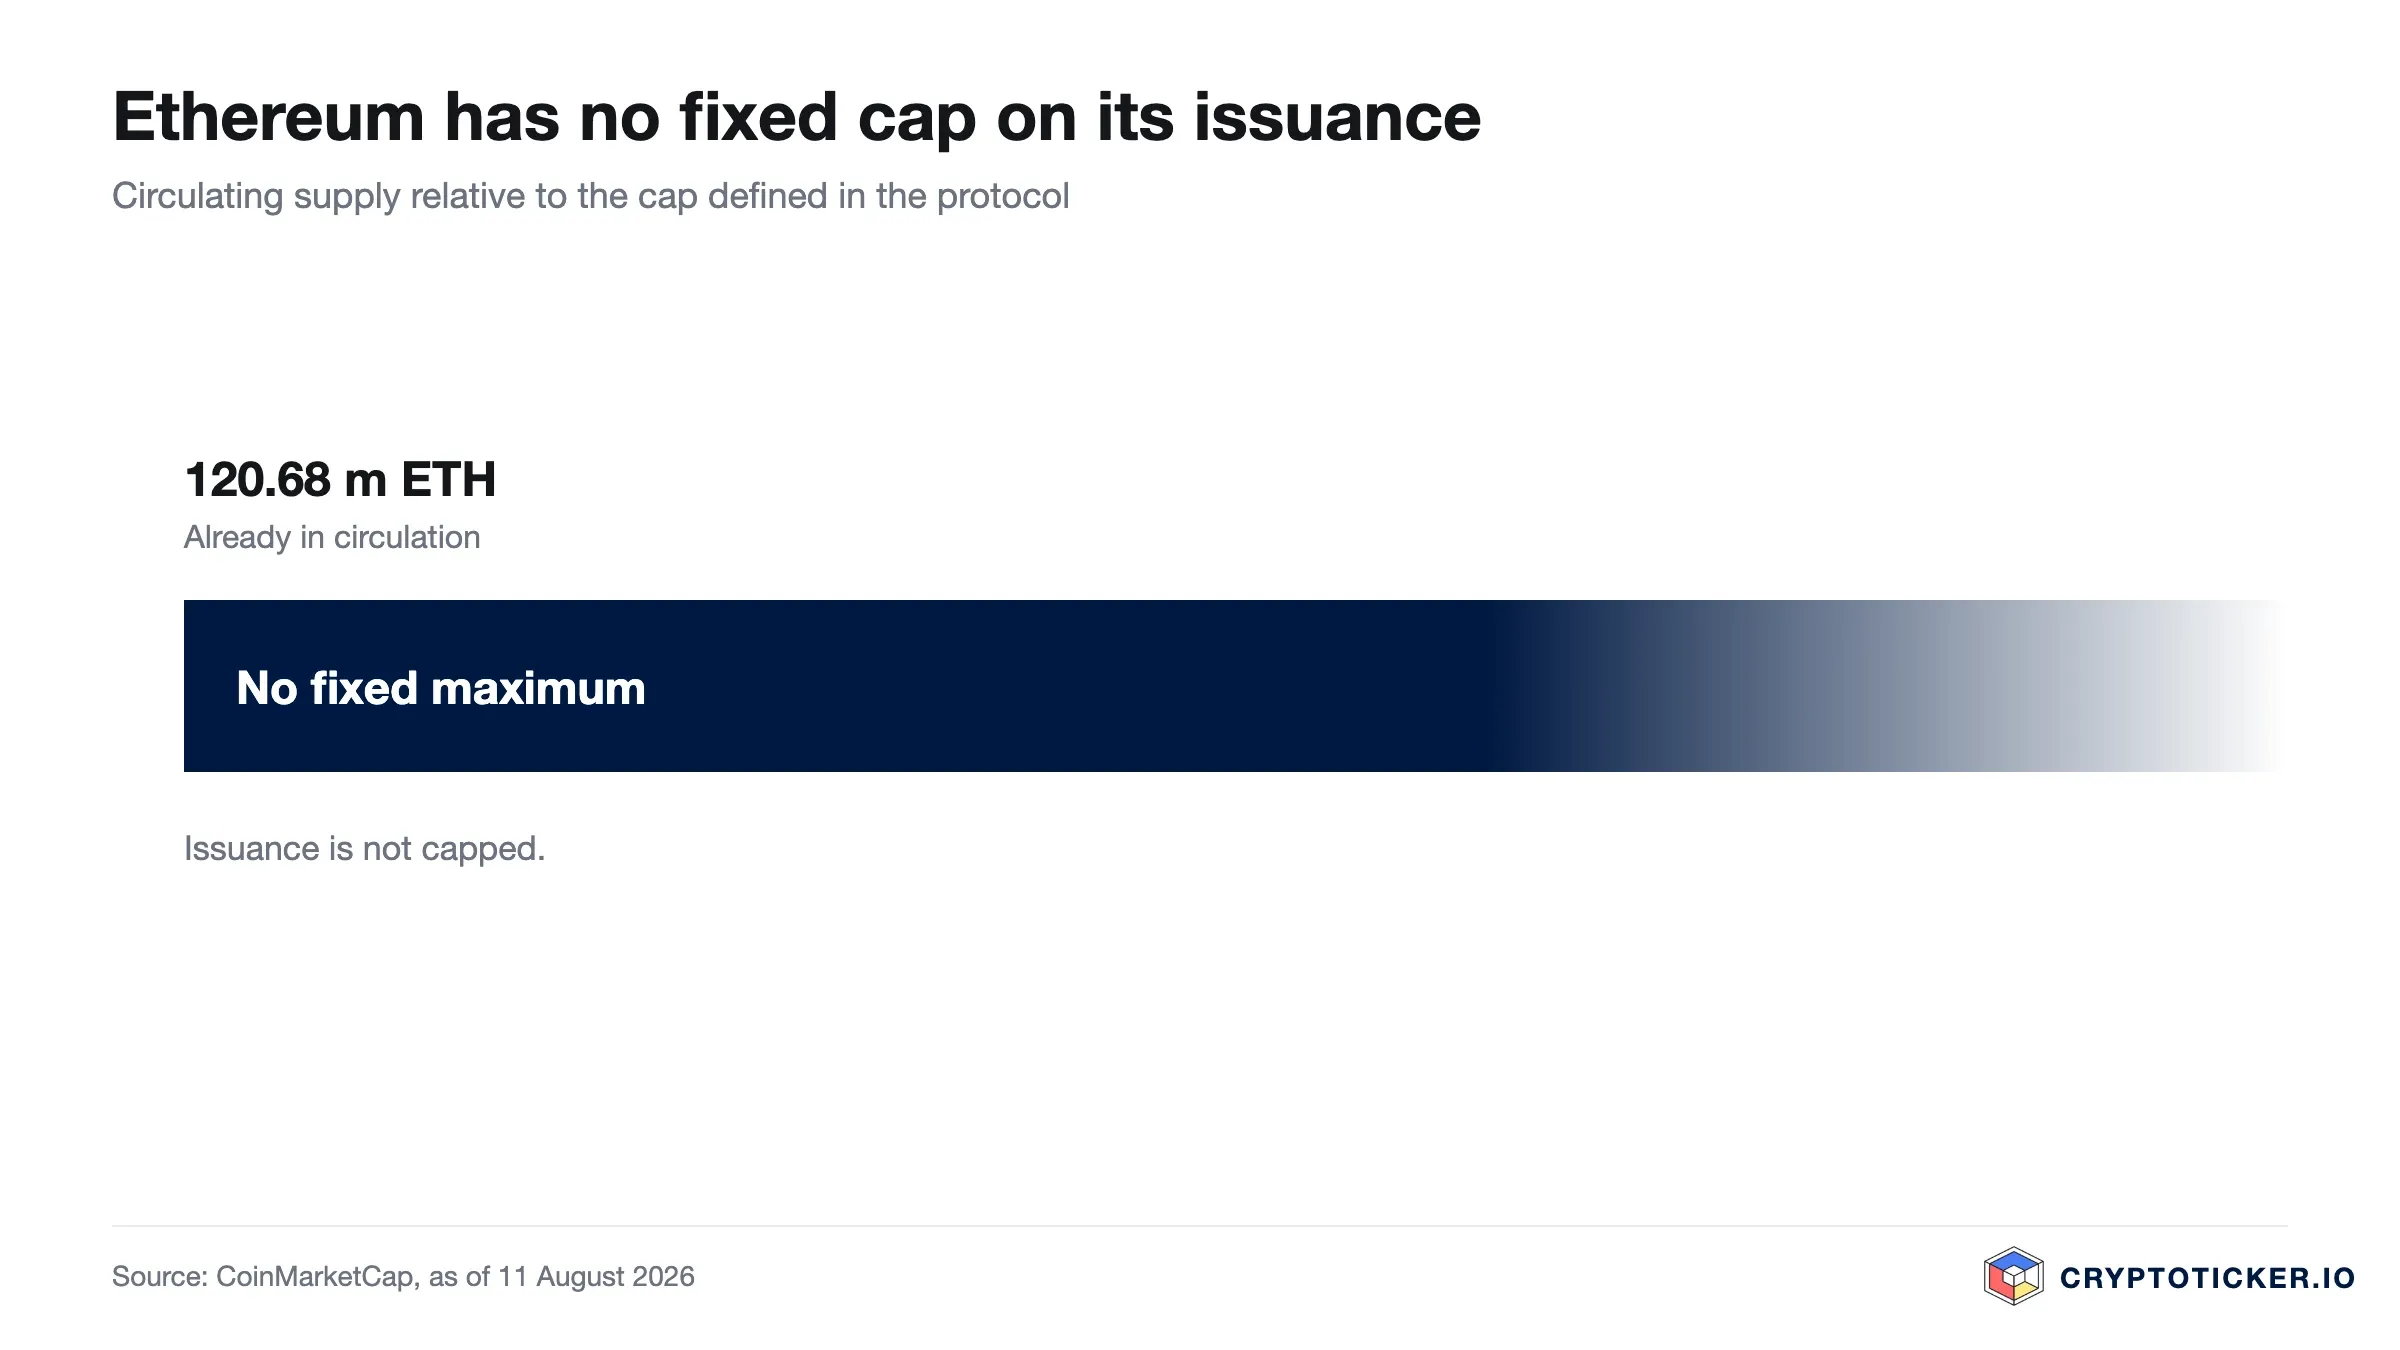
The first is the fee mechanism. Part of every transaction fee is permanently removed from circulation when it is paid. If usage rises, net issuance falls; if usage declines, it rises. Unlike Bitcoin, Ethereum's supply path is therefore tied to actual demand for block space.
The second is the development agenda. The Ethereum Foundation documents the planned upgrade stages publicly in its roadmap, including the respective goals for scaling and data availability. This matters for a buying decision because the network's value rests on whether transactions can be settled there cheaply and reliably.
The honest counterpoint: much of the activity has migrated to downstream networks that use Ethereum as a security anchor while passing considerably fewer fees back to the main chain. If the ecosystem grows without the main chain earning from it, the price does not automatically follow.
What argues in favour of buying Ethereum at current prices
The drawdown of roughly 42 percent from the twelve-month high remains one of the deepest among large crypto assets of comparable market capitalisation. Anyone who assumes the network holds its role is still buying well below last year's level.
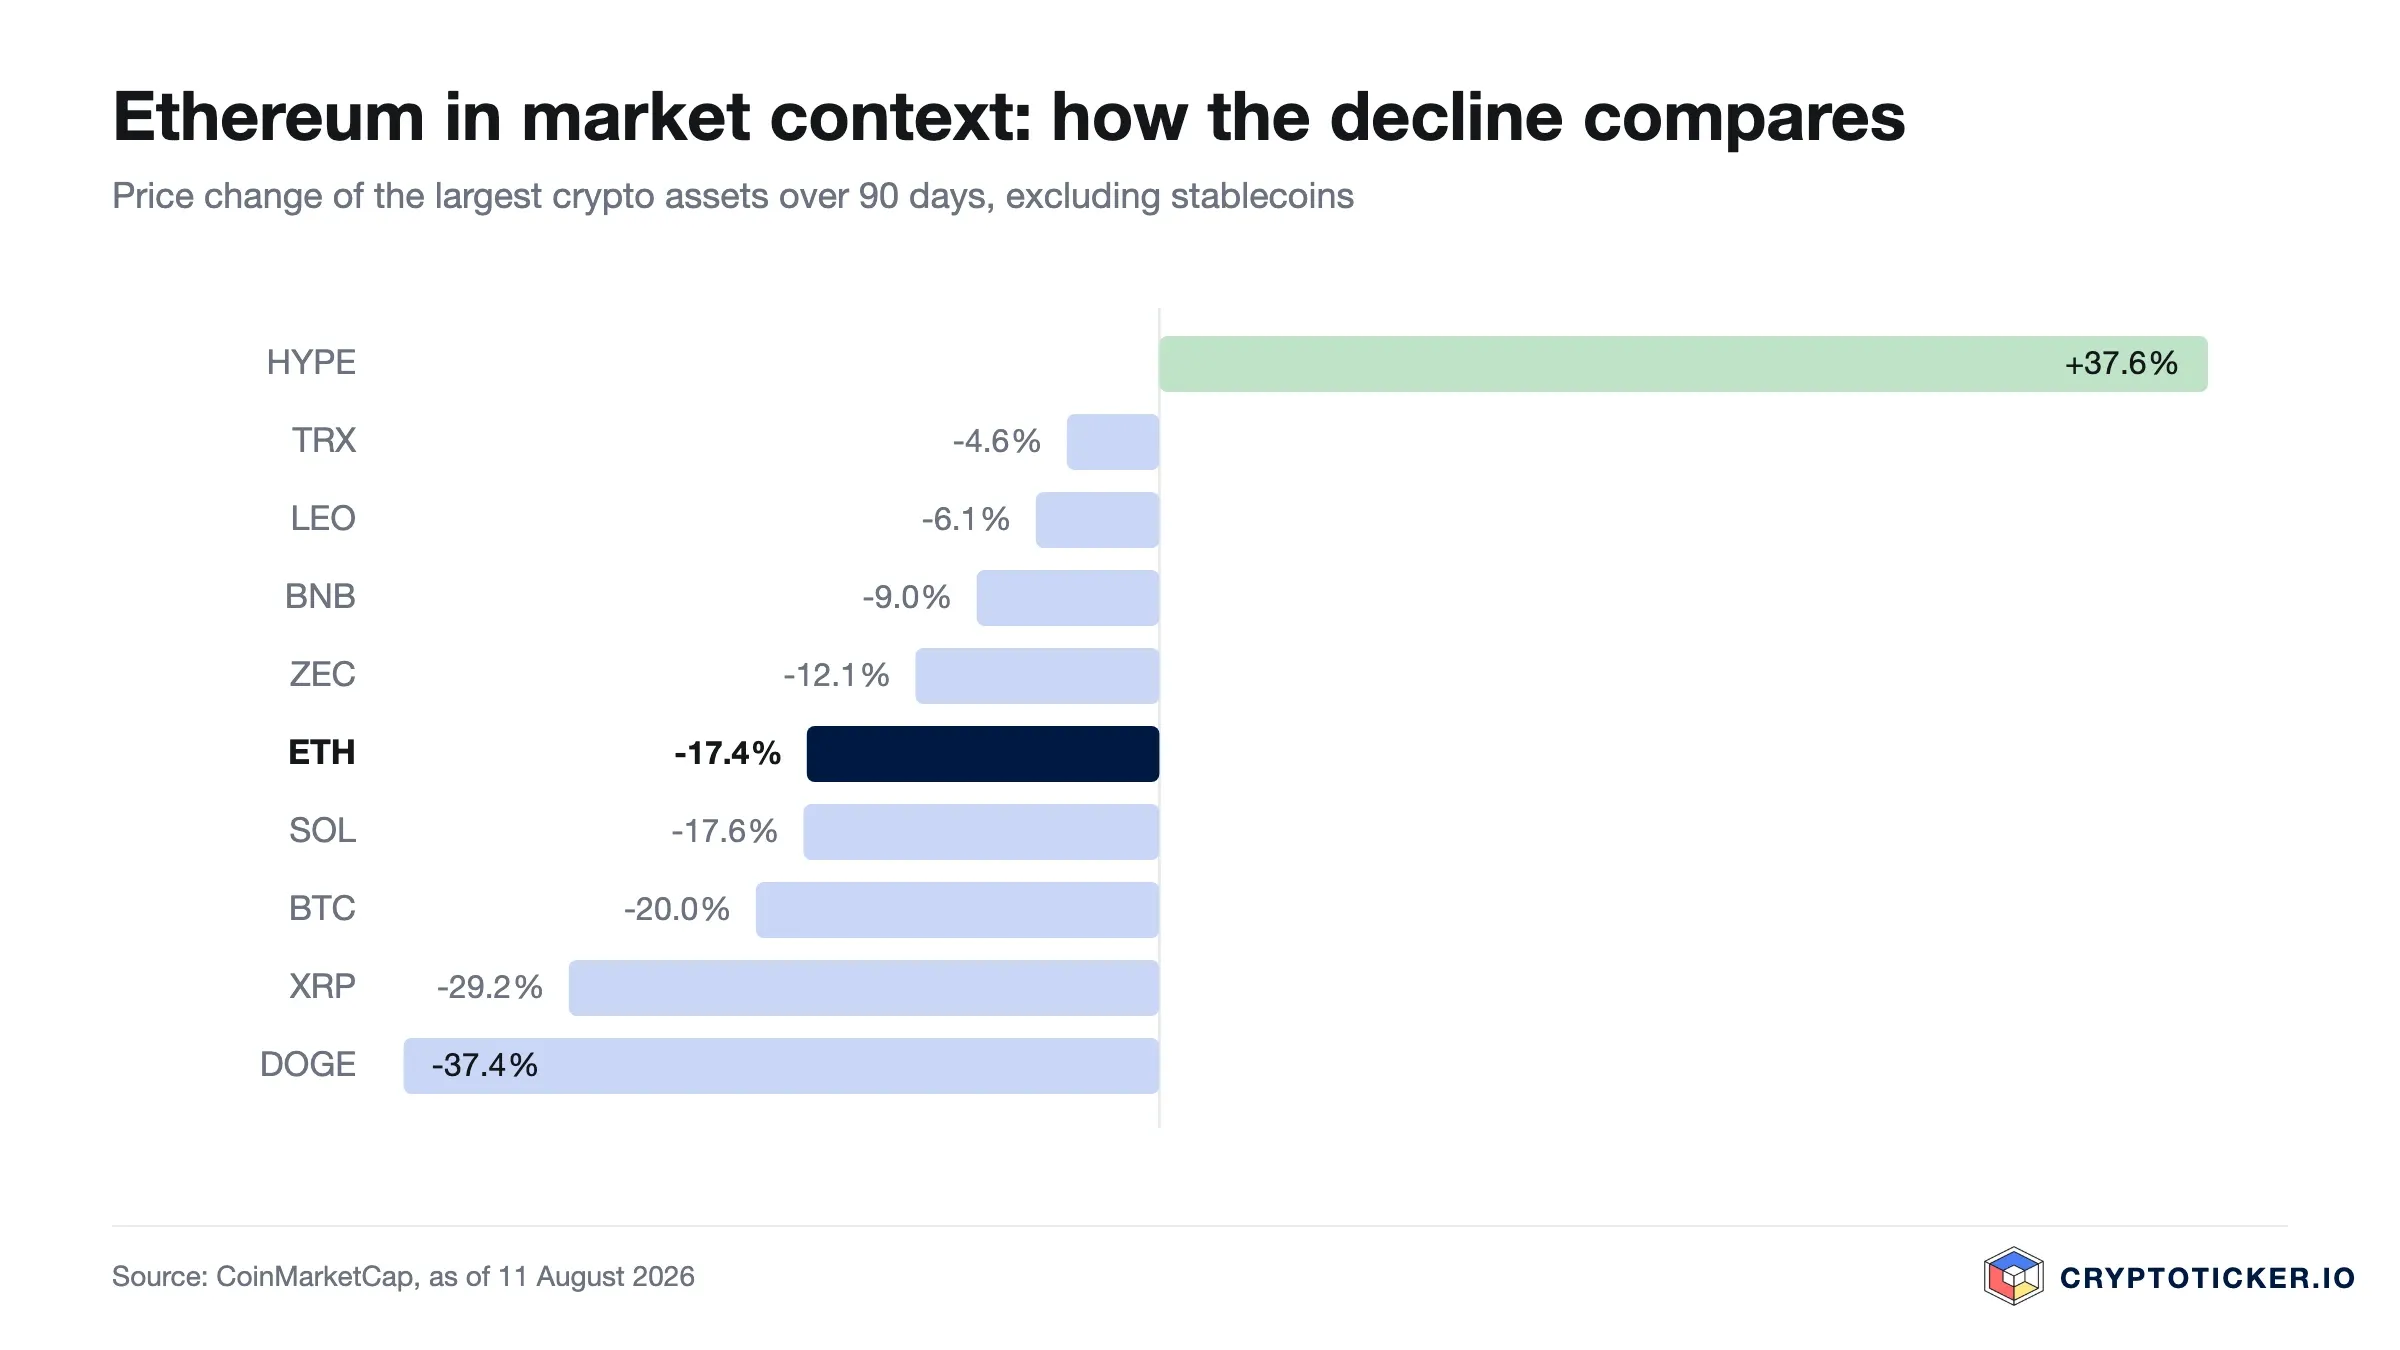
The second point is the trend picture. Ethereum trades above both moving averages, and over 30 days it shows a gain of 9.7 percent against 8.1 percent for the market leader. In recovery phases Ethereum has historically outrun Bitcoin, because it carries the higher beta.
The third point is the definable fallback level. The two averages at $2,492 and $2,323 sit roughly 8 to 15 percent below the price and support it from underneath. How longer-term scenarios follow from this, with the weightings disclosed, is set out in our Ethereum price prediction.
What argues against buying Ethereum at current prices
Higher beta cuts both ways. If Bitcoin falls back, Ethereum has typically fallen further. The distance to the twelve-month low is definable at roughly 43 percent, but markedly wider than Bitcoin's roughly 32 percent.
Then there is the path upward. Reaching the twelve-month high requires roughly 72 percent, and over twelve months the price is still down 39.7 percent. The change of trend is also young: the crossing of the two averages is twenty days old and can be given back quickly on a setback.
The structural caveat remains value capture. A network can gain in importance while its token earns little from that growth. For Ethereum this possibility is real and belongs in any honest assessment.
How to buy Ethereum at current prices
With Ethereum a second question joins the cost question, one that does not arise with Bitcoin in the same way: staking. Holders can commit their coins to securing the network through many providers and receive a reward for it. Whether this is offered, on what terms and with which lock-up period differs considerably between platforms.
The cost side follows the same logic as any crypto purchase: trading fee, spread and withdrawal fee together determine the entry price. An overview of venues ranked by cost, regulation and custody is available in our crypto exchange comparison.
For the European market, providers licensed under the European markets in crypto-assets regulation are the relevant candidates; the supervisor lists them in the public register of the European Securities and Markets Authority. Which ones qualify is set out in our comparison of regulated crypto exchanges. Our detailed assessment of one such provider, including scores for cost, usability and support, is in the Bitvavo review.
So is Ethereum a good buy at current prices?
For a short-term entry the situation remains turned, but the momentum has not come back. The dominant trend points up, the price sits above both averages, and the RSI holds the 60 mark; the recovery, however, is still not carried by expanding volume, and the gap to the monthly average has doubled to 15.7 percent. What is missing is confirmation over time: the price has held above the 200-day average for a good six weeks, and the crossing of the two lines is twenty days old.
For a long-term build-up the situation is defensible but more demanding than with Bitcoin. The price sits roughly 42 percent below the twelve-month high, the first fallback level 8 to 15 percent below it, and the structural question of value capture is open. Buying Ethereum means betting on network usage, not on a fixed supply mechanism.
A smaller position size than for Bitcoin therefore still seems appropriate to us, spread across several purchases, with a clearly defined point at which the assumption counts as refuted. The 200-day average at $2,323 lends itself to being that point: if the price drops below it for any length of time, the change of trend is refuted.
Buying Ethereum: what to take away
- The trend has turned, but it is young. Ethereum has traded above its 200-day average since 20 August, and since 15 September the 50-day average has sat above it too. That is a change of trend, not a guarantee. The longer-term scenarios with disclosed weightings are in our Ethereum price prediction.
- Size the position smaller than your Bitcoin position. Higher beta delivers more in recoveries and more in downturns. Anyone accounting for both buys in tranches rather than all at once.
- Settle the staking terms before you buy, not after. Rewards, lock-up periods and custody differ markedly between platforms and affect the outcome over years more than the entry price does. The terms of the venues are set out in our exchange comparison.
Disclosure: Some of the providers mentioned in this article work with us through partner programmes. This has no bearing on the price analysis or the assessment of the chart; the price data comes from a public market data source and can be verified there.
(As of 5 October 2026. This article is not investment advice. Prices, fees and terms change; check them with the provider before every purchase. Crypto assets are subject to high volatility and a total loss is possible.)
Transparency note: This article was produced with the assistance of artificial intelligence and reviewed by our editorial team before publication. All figures and claims were checked against the primary sources linked in the text. The feature image was generated with AI.
More on Ethereum: All Ethereum news at a glance
Related articles
Which topics should we dive deeper into?
Select what genuinely interests you. Your picks feed directly into our editorial planning.
Crypto news that's actually worth your time.
Weekly. 60 seconds. Carefully curated by our editors: no hype, no promo flood, no spam.

February 7, 2026 6:30 PM

Ethereum Price Prediction 2026: Technical Analysis of ETH Coin During the Crypto Crash
Ethereum price faces a major test at $1,800. This 2026 technical analysis of the ETH coin explores recovery targets and deeper crash support levels.

September 23, 2024 8:44 AM
Is it a Good Idea to Buy XRP below $0.60?
With recent XRP price drops positioning it below the $0.60 mark, investors are left pondering. Is it a good idea to buy XRP below $0.60?
June 17, 2026 1:30 PM

SpaceX or Ethereum: Which Delivered the Better Return?
SpaceX stock versus Ethereum, one year on. We compare the returns, the dollar outcomes, and which is better positioned from here.
March 29, 2026 2:07 PM
Is Ethereum a Good Store of Value?
Is Ethereum a reliable store of value? We analyze ETH price history, the "ultrasound money" narrative, and its long-term potential for 2026 and beyond.
January 15, 2026 4:40 PM

Ethereum Price Prediction: Will ETH Break $4,000 in Q1 2026?
Ethereum is showing strong bullish momentum in early 2026. Can ETH break the $4,000 barrier? Here's what's happening to Ethereum coin price.
July 17, 2026 7:55 PM
Is XRP a Good Investment in 2026? Price Analysis and Prediction
XRP has broken out of its summer range and is holding above its 200-day average — without the catalyst the market waited a year for. What the chart, the CLARITY Act and 2026 forecasts really say.

August 27, 2026 2:21 AM

Is SUI a Good Buy at Current Prices?
SUI has reclaimed its 200-day moving average and trades 82 percent above its twelve-month low. We check whether the coin is a good buy at current prices.
May 13, 2026 11:02 AM

Is PEPE Coin worth Buying in 2026?
PEPE still holds both its 50 day and its 200 day average, while trading volume has slipped back below its yearly norm. What that means for anyone buying at current prices, and the two levels that settle it.
April 6, 2026 6:24 PM

Ethereum Price Analysis: ETH Consolidates Between $1,800 and $2,100, What’s Next?
Ethereum price is stuck in a tight range between $1,800 and $2,100. Analysts warn of a decisive breakout or breakdown as volatility reaches a boiling point.
April 19, 2026 6:34 PM

Ethereum Price Analysis: Key Levels Holding, Will ETH Crash or Bounce Toward $2,500?
Ethereum tests critical support near $2,330. Will ETH bounce toward $2,500 or break lower? Full price analysis and targets.
March 12, 2026 2:52 PM
Ethereum Price Stabilizes Above $1,900: Is the Path to $3,000 Now Clear?
Ethereum price shows resilience above $1,900. Analyzing on-chain data and technical charts suggests a potential recovery toward the $3,000 psychological level.
May 16, 2026 2:22 PM

Ethereum Price Analysis as ETH risks Crashing below the $2,000 Support
Ethereum struggles to stay above key support levels. Technical charts and rising exchange inflows indicate that ETH could drop below $2,000 soon.
August 3, 2026 10:41 AM
Is XRP Coin a Good Buy At Current Prices?
XRP trades at $1.4048 and has given back the $1.50 level. Why the zone around $1.39, where both EMAs now sit together, decides as support whether the reversal holds.
March 25, 2026 10:38 AM

Ethereum News: ETH Targets $2,200 as Geopolitical Tensions Ease and Bitcoin Reclaims $71k
Ethereum nears $2,200 while Bitcoin reclaims $71,000 amid reports of US-Iran peace talks. Here are the latest ETH chart trends and market sentiment for March 2026.
February 18, 2026 6:53 AM

Ethereum Price Prediction: Will the $2,000 Support Hold or Is a Deeper Correction Looming?
Ethereum price struggles to maintain the $2,000 psychological level. Analyze the latest ETH coin news and price predictions for 2026 amid market consolidation.
February 25, 2026 9:24 PM
Ethereum Price Analysis: ETH Rebounds 10% as Market Sentiment Flips
Ethereum price jumps 10% to $2,075 as Trump’s State of the Union address and institutional confidence spark a relief rally across the crypto market.
April 26, 2026 3:14 PM
Will Ethereum Coin Break its $4,900 ATH in 2026?
Ethereum eyes a potential return to its $4,900 ATH in 2026. Discover the technical hurdles and institutional catalysts driving the current ETH price action.
June 5, 2026 9:59 AM

Ethereum Prediction: ETH Coin Falls Below $1,700 – Here Are the Next Supports
Ethereum has crashed below the critical $1,700 level amid a broader crypto selloff. Technical analysis reveals the next crucial targets for ETH price.
September 18, 2026 9:15 PM

Ethereum Breaks Through the $2,600 Mark: What Is Behind the Short Squeeze and What to Check Now
Ethereum rises almost 7 percent to $2,616 and clears the mark it failed at only days ago. Short positions worth $85 million were forcibly closed in the process. What that reveals about the rally and what you should check now.
February 24, 2026 4:28 PM

Can Ethereum Price Crash to $0? Analyzing Ethereum Blockchain
Ethereum's price is under pressure as the crypto market faces a downturn. We analyze if ETH can truly hit $0 and what its ecosystem value means for the future.
August 13, 2025 8:40 AM

Ethereum Price Hits New High at $4,678 – $5K SOON as BlackRock Buys $318.7M in ETH...
Ethereum reached a new high of $4,678, edging closer to its 2021 record. With BlackRock purchasing $318.7M worth of ETH, the $5K milestone may be next.
August 10, 2024 6:02 PM

Ethereum Price Prediction: Amid Mixed Signals What To Expect For ETH Price?
Ethereum faces volatility and competition, but signs of bullish activity and whale accumulation suggest potential recovery. How does it compare to Solana, and what does the future hold for ETH?
February 8, 2025 10:00 PM
Top 3 Reasons Why Ethereum Price Is a Good Buy Today
Despite recent price drops and rising competition, Ethereum shows strong signs of a potential rebound. Discover the key factors making ETH a smart buy right now.
August 11, 2022 9:13 AM

Ethereum Price UP in Anticipation for the Merge – Can you Still Buy ETH?
In this Ethereum price prediction, we analyze where will ETH price reach. Can you still buy ETH? Will Ethereum reach 2000 $ before the Merge?
August 2, 2024 10:32 PM
Ethereum Price Crash: What Next Support Levels For ETH Price Below $3K?
Ethereum fees just hit their lowest since late 2023, and now Ethereum price is trading near $3K with a high potential to drop below it... What's next?
June 14, 2025 3:30 PM

Ethereum to $10,000 in 2025? Why Institutions Are Betting Big on ETH
Ethereum is being loaded up by smart money—and not just for spot ETFs. With BlackRock and others buying $240M in ETH, the $10K target for 2025 might not be so far-fetched. Here’s why.
September 24, 2026 10:36 PM

Ethereum Price Prediction: What to Check on Staking, Leverage and Where You Buy After Three Attempts at $2,800
Ether stands at $2,700 and has bounced off the zone around $2,800 three times in thirty days, without a single daily close above it. What our own count shows, and the three things to settle before the next attempt.
More from CryptoTicker