
Ethereum Price Prediction: What to Check on Staking, Leverage and Where You Buy After Three Attempts at $2,800
Ether stands at $2,700 and has bounced off the zone around $2,800 three times in thirty days, without a single daily close above it. What our own count shows, and the three things to settle before the next attempt.





Which topics should we dive deeper into?
Select what genuinely interests you. Your picks feed directly into our editorial planning.
Crypto news that's actually worth your time.
Weekly. 60 seconds. Carefully curated by our editors: no hype, no promo flood, no spam.
Ether was quoted at $2,700.98 on September 24, 2026. That is 0.7 percent above the level of 24 hours earlier, 10.5 percent above a week earlier and 38.3 percent above 60 days earlier. The figures come from the public price interface of the Kraken exchange, retrieved at the time stated. What is interesting about this situation is less the level itself than the ceiling above it: three times in the past thirty days Ethereum ran up to the zone around $2,800, and not once did a trading day close above it.
Anyone making a buying or selling decision now is making it at precisely that edge. This article sorts out what is documented, and what you as an investor in Germany can concretely take from it.
Ethereum price prediction: the price stands at $2,700 and the zone around $2,800 holds
The daily candle for September 24 shows a high of $2,704.82 and a low of $2,627.68. The range of a single trading day therefore comes to roughly $77, or just under three percent. For Ether that is a quiet session, measured against the swings of the summer.
The view over longer stretches is ambivalent. Against June 26, 2026, the lowest point of the past 90 days at $1,510.00, there is a gain of roughly 79 percent. Against September 24, 2025, when Ether closed at $4,154.62, there is a loss of roughly 35 percent. And against the start of the year on January 2, 2026, with a closing price of $3,124.04, roughly 13.5 percent is still missing.
Both perspectives are correct, and they explain why sentiment in the market is so uneven. Anyone who bought in June is sitting on a considerable gain. Anyone who entered last autumn is still waiting to break even.
Three attempts, no daily close above: what our own count shows
For this article we counted the daily candles of the last thirty completed trading days, meaning the period from August 25 to September 23, 2026. The basis is Kraken's public OHLC interface for the ETH against US dollar pair. We counted on how many days the daily high reached the $2,750 mark, and on how many days the closing price sat above $2,800.
The result is narrow. Three days reached $2,750 at the high: September 21 at $2,806.69, September 22 at $2,776.79 and September 23 at $2,787.89. Not a single day closed above $2,800. The high of September 21 is at the same time the highest point of the past 90 days.
This analysis was carried out by cryptoticker.io itself on September 24, 2026. Thirty daily candles from a single exchange were examined. What we explicitly could not measure: the order book, the distribution of trading volume across the day, and the situation at other venues, whose prices can differ slightly.
What follows from that? A zone tested three times and three times not overcome is a place where sellers sit. That is therefore not a forecast, only the observation of where supply met demand in the recent past. If the price breaks above it on a fourth attempt, that supply falls away and the next point of reference lies considerably higher. If it fails again, the zone grows stronger with every attempt as an argument for taking profits.
Why the rate rise of September 16 did not tip the Ether price over
On September 16, 2026, the Federal Open Market Committee raised the target range for the policy rate by a quarter point to 3.75 to 4.00 percent. The decision was unanimous at twelve votes to none. The statement says inflation remains elevated and that the measure supports a more timely return to the two percent objective. The Federal Reserve statement is publicly available.
A rate rise is classically regarded as a headwind for assets with no running yield. That is exactly what is remarkable here: in the week after the decision, Ether rose by 10.5 percent. The market evidently absorbed the increase, and part of the move is likely to go back to the step having been expected.
In parallel, several trade publications reported substantial outflows from the US spot ETFs on Ether. The figures cited range from $224 million on a single day around the rate decision to $366 million within 48 hours. We did not collect those figures ourselves, and they come from secondary reporting. They remain important for context nonetheless, because they show the price rise was not carried by institutional inflows.

October 28 in the calendar: what the next rate decision means for Ether
The next regular meeting of the Federal Open Market Committee is on October 27 and 28, 2026. That follows from the Federal Reserve's official meeting calendar. After that comes December 8 and 9.
For your planning that means you have roughly five weeks ahead of you with no major monetary policy date. In that time, more will probably be settled at the zone around $2,800 than by the macro picture. Experience suggests a rate date draws volatility in, in both directions. Anyone working with thin collateral should have the date in their calendar before they feel it in their portfolio.
One point of context, so that no expectation arises here which the article cannot support: how the committee decides in October is open. Neither we nor anyone else knows. What can be documented is the date alone, and the direction of the last step.
 Where to buy Ether under supervision
Levels up and down: $2,806, $2,628 and $2,355 in view
Three reference points can be derived from the same daily data, each with a date and a source.
On the upside: $2,806.69, the high of September 21 and at the same time the highest price of the past 90 days. As long as no daily close lies above it, that point remains the ceiling. A closing price above it would be the first hard signal that supply in this zone has been worked through.
As a short-term support line: $2,627.68, the low of the current trading day. If the price falls below it, the run-up of recent days has fizzled out.
As a deeper support line: $2,355.48, the low of the past thirty days. Only below that would the entire upward move since the end of August be in question.
These three numbers are observations, not recommendations. They serve well for formulating your own decision in advance rather than making it in the moment of the move. Anyone who writes down beforehand at which price they will do what acts on gut feeling less often. A cross-check against the market leader pays off: how Bitcoin behaves shapes, in experience, a good part of the direction for Ether.
A year of ownership decides the tax: what Section 23 of the Income Tax Act means for your Ether gain
Here lies the real lever in this situation for investors in Germany, and it has only an indirect connection to the price forecast.
The sale of crypto assets held privately falls under the rules on private disposals in Section 23 of the German Income Tax Act. What matters is the time between acquisition and disposal. If more than a year lies between purchase and sale, the gain is free of income tax. If less, the gain is charged at your personal income tax rate, not at the 25 percent flat-rate withholding tax. For gains within the year, an exemption limit of €1,000 per year applies. Exceed it by one euro and you pay tax on the full amount, not just the part above the line.
Run that through on the current situation. Anyone who bought on June 26, 2026 near the low at $1,510 is up roughly 79 percent today. That gain is tied up for tax purposes until June 26, 2027. A sale into the zone around $2,800 would therefore be a sale within the period, and depending on your personal rate, noticeable portions of it go to the tax office. Waiting nine months costs price risk but may save more than the move brings in by then.
The reverse holds just as much: anyone who bought their Ether more than a year ago can sell tax free. For that group, a resistance zone tested three times is a distinctly more attractive exit point than for someone still inside the period. That supply appears at precisely such levels therefore has more than chart-technical reasons.
Two notes on this, because much is misunderstood here. First, you need a date for every single acquisition, otherwise the period cannot be evidenced. A clean record of your purchases is the prerequisite, and there are specialised tax and portfolio tools for that which allocate inflows and outflows automatically. Second, this section does not replace tax advice. It names the rule and the source; your individual case is for a tax adviser to assess.

Staking with Ether: how the lock-up narrows your selling decision
Ether is a proof-of-stake network. That means anyone depositing coins in the network secures its operation and receives a reward for doing so. That reward is widely stated at an order of magnitude of around three percent a year, though it fluctuates with the number of participants.
For the question this article asks, another point matters more than the yield. Staked Ether is not immediately available. Releasing it from the network runs through a queue, and the length of that queue depends on how many others are doing the same thing at the same time. Precisely when many want to sell, the queue is at its longest.
In practice that means: if you have staked your Ether and want to sell at the $2,800 zone, your exit is not the press of a button. You should know how long the release takes at your provider, whether it offers its own instant payout at a discount, and what that costs. Anyone comparing staking providers should therefore examine the payout periods just as closely as the advertised yield.
One tax addition that often causes uncertainty: in its circular on crypto assets of March 6, 2025, the German Federal Ministry of Finance clarified that the one-year period is not extended to ten years by staking. The ten-year worry that circulated earlier is thereby laid to rest. The rewards themselves are to be treated separately, and here too the individual case belongs with a tax adviser.
 Staking providers and their payout periods
Leverage and liquidation at a level tested three times: what can go wrong
At a zone that has rejected price several times, leveraged positions accumulate on both sides. For you as an investor, a very practical warning follows from that.
With a leveraged product, the distance between your entry and your liquidation price determines how much movement you can withstand. For Ether the daily range today came to roughly three percent, and considerably more on the busy days of the summer. A leverage of ten means a counter-move of ten percent consumes your stake entirely. Ether has shown such a move several times within a single day over the past months.
On top of that comes an effect that is readily overlooked: just above a known resistance zone sit many stops from short sellers, just below it many stops from buyers. If one of those clusters is triggered, the move accelerates, and the price can briefly run further than the order situation justifies. Anyone calculating tightly is stopped out in precisely those seconds.
Three things you should check specifically before working with leverage at this level: your actual liquidation price in dollars, not in percent. The financing costs of your position per day, because they eat into the gain if you hold for longer. And the question of whether your provider has a margin call obligation. Anyone trading derivatives will find the terms compared in our overview of venues for perpetual contracts.
Where you buy under MiCA: how to recognise an authorised exchange in Germany
Since the European Markets in Crypto-Assets Regulation became fully applicable, providers addressing customers in the EU need authorisation as a crypto asset service provider. In Germany, BaFin exercises supervision. For you that is no bureaucratic detail but the difference between a supervised counterparty and one that leaves you standing alone in a dispute.
How to check it: the provider names its authorisation and the competent supervisor in its imprint or legal notices. It holds client funds separately from its own assets. It provides you with a comprehensible schedule of fees in which the mark-up in the price itself is also stated, not only the visible order fee. And it supplies trading data in a form with which you can later evidence the periods from the previous section.
That last point is almost never considered when buying and almost always regretted at tax time. An overview of supervised venues and their fee models is in our crypto exchange comparison.
Custody and payout: what to set up before the next attempt
Two things can be dealt with today, regardless of where the price runs.
The first is custody. Ether you intend to hold for longer than a year does not belong permanently in a trading account. Your own wallet, whose keys you control, takes the counterparty risk off you. The price for that is personal responsibility: lose the recovery phrase and the balance is gone, and nobody can retrieve it.
The second is the payout route. Before you need it, check whether your bank account is verified with the provider, what daily limit applies to withdrawals, and how long a transfer takes in practice. Anyone who sells on a volatile day and then discovers verification is still pending loses days.
Both cost half an hour today and cannot be caught up on the day you need them.
Ethereum price prediction: what to take away
- Write your levels down before the fourth attempt runs. Upside $2,806.69 as a daily close, downside $2,627.68 and $2,355.48. If you determine in advance what you will do at which price, you will not decide on impulse. Where you trade is something to check in the exchange comparison.
- Check the acquisition date of every position before you sell. A sale within a year costs your personal tax rate, a sale after it costs nothing. With a gain of roughly 79 percent since the end of June, that is the most expensive figure in this article. A portfolio and tax tool allocates the periods automatically.
- Settle your staking payout period today, not on the day of the sale. Locked-up Ether cannot be sold at the press of a button, and the queue is at its longest precisely when time is short. The providers' periods are in the staking comparison.
(As of September 24, 2026. This article is not investment advice. Prices and fee structures change; check the terms with the provider before you buy.)
Transparency note: This article was produced with the assistance of artificial intelligence and reviewed by our editorial team before publication. All figures and claims were checked against the primary sources linked in the text. The feature image was generated with AI.
More on Ethereum: All Ethereum news at a glance
Related articles
- ETH Price Prediction: What to Check at the $2,800 Mark Now
- Bitcoin Price Prediction: What to Check on Levels, Holding Period and Leverage Before the October 28 Rate Decision
- Ethereum price prediction: Citi raises its twelve-month target to $3,028, and what you can do now
- Ethereum Price Prediction: What to Check on ETH Before the Quarter Turns
- 17 of 20 top coins down, Ethereum at $2,380: where the sell-off is measured
Which topics should we dive deeper into?
Select what genuinely interests you. Your picks feed directly into our editorial planning.
Crypto news that's actually worth your time.
Weekly. 60 seconds. Carefully curated by our editors: no hype, no promo flood, no spam.

September 27, 2026 10:16 PM

Dogecoin Price Prediction: Which Levels Decide the Fourth Quarter
Dogecoin trades at $0.0973 on September 27 and has gained 12.2 percent in seven days. Which three measured levels frame the fourth quarter, how accurate the circulating price targets proved in September, and which four checks are due before the quarter turns.

September 24, 2026 1:34 PM

Cardano Slides Below $0.24: What ADA Holders Should Check on Leverage, Liquidation and Holding Period
Cardano has given back its move above $0.25 and trades around seven percent below the high of the past 24 hours. What that means for leveraged positions, the holding period of your tranches and the buying route under MiCA.
October 12, 2026 4:28 PM

XRP price prediction: $160 million behind Solana, 13 weeks of inflows against a 9 percent weekly loss
The XRP funds are only $160 million behind the Solana funds and have been taking in fresh money for 13 weeks. Why the price is falling anyway at $1.38, and what that means for the $2.80 year-end target.
September 30, 2026 4:14 AM

Bitcoin Price Before the Core PCE at 14:30 CEST: Will the $82,735 Level Hold?
At 14:30 CEST today the Bureau of Economic Analysis publishes the core PCE deflator for August, the inflation gauge the Fed anchors its 28 October rate decision to. Bitcoin stands at $83,329, less than $600 above its daily low, and anyone holding on leverage decides this morning.

September 27, 2026 10:14 AM

Shiba Inu Price Prediction: What to Check on SHIB Before the December 31 Deadline
SHIB trades at $0.00000592 on September 27, 2026, around 93 percent below its all-time high. For German investors one date matters more than the chart right now: December 31, 2026.
October 15, 2026 7:22 AM

Cardano breaks the $0.2439 level: ADA is falling more than twice as fast as Bitcoin
Cardano has lost 7.13 percent over 24 hours to $0.2207 and now stands at its lowest since September 18. Bitcoin gave up only 2.95 percent in the same period, and our own count shows 15 of the 20 largest coins falling harder than BTC.
September 24, 2026 4:16 AM

Trump-Xi Summit at the White House: The Crypto Positions to Check Before the Meeting
Xi Jinping is on a state visit to Donald Trump today, and the crypto market comes into the meeting carrying the gains of an exceptionally strong week. What to check on leverage, holding period and custody before the first headline runs.
September 25, 2026 7:24 PM

Bitcoin Forecast: What to Check on Levels, Holding Period and Buying Route Before the Quarter Ends
Bitcoin stands at $83,877 at 16:40 UTC on September 25, 2026, and the measured volatility of the past 30 days spans a band of $73,600 to $94,200 for the coming month. More important than that band before the quarter ends are three checks: holding period, buying route under MiCA and the reporting duty in force since January 2026.
September 21, 2026 1:13 PM

Ethereum Rises While ETF Money Leaves: What ETH Holders Should Check Now
US ether funds lost $140 million in the week to September 18, ending four weeks of inflows. The ETH price still gained a good 5 percent.
September 25, 2026 7:14 PM

Chainlink Above the September High: What Open Interest, Funding Rate and Liquidation Risk Mean for LINK
Chainlink stands at $13.86, 11.2 percent higher than 24 hours ago. Our own query at OKX and Hyperliquid shows funding at the baseline rate, and what that means for leverage, buying route and tax.

September 24, 2026 10:38 AM

Fed Rate Hike in October: What to Check on Leverage, Liquidation and Holding Period After the PMI Jump
The flash US purchasing managers' index has jumped to 58.4 points, its highest level since July 2021, and input prices are rising at a pace last seen in October 2022. The futures market now prices a further Fed rate hike on October 28 at almost 70 percent, and the crypto market is falling broadly.
September 30, 2026 10:15 AM

Ethereum Price Prediction: 1.6 Million ETH Face a 28-Day Wait for Activation, and What You Can Do Now
1,603,958 ETH are standing in the entry queue for Ethereum staking and waiting almost 28 days for activation. What that tied-up supply means for the price levels, for your yield and for the 256 euro exemption limit at the German tax office.
April 19, 2026 6:34 PM

Ethereum Price Analysis: Key Levels Holding, Will ETH Crash or Bounce Toward $2,500?
Ethereum tests critical support near $2,330. Will ETH bounce toward $2,500 or break lower? Full price analysis and targets.
August 25, 2024 11:08 AM
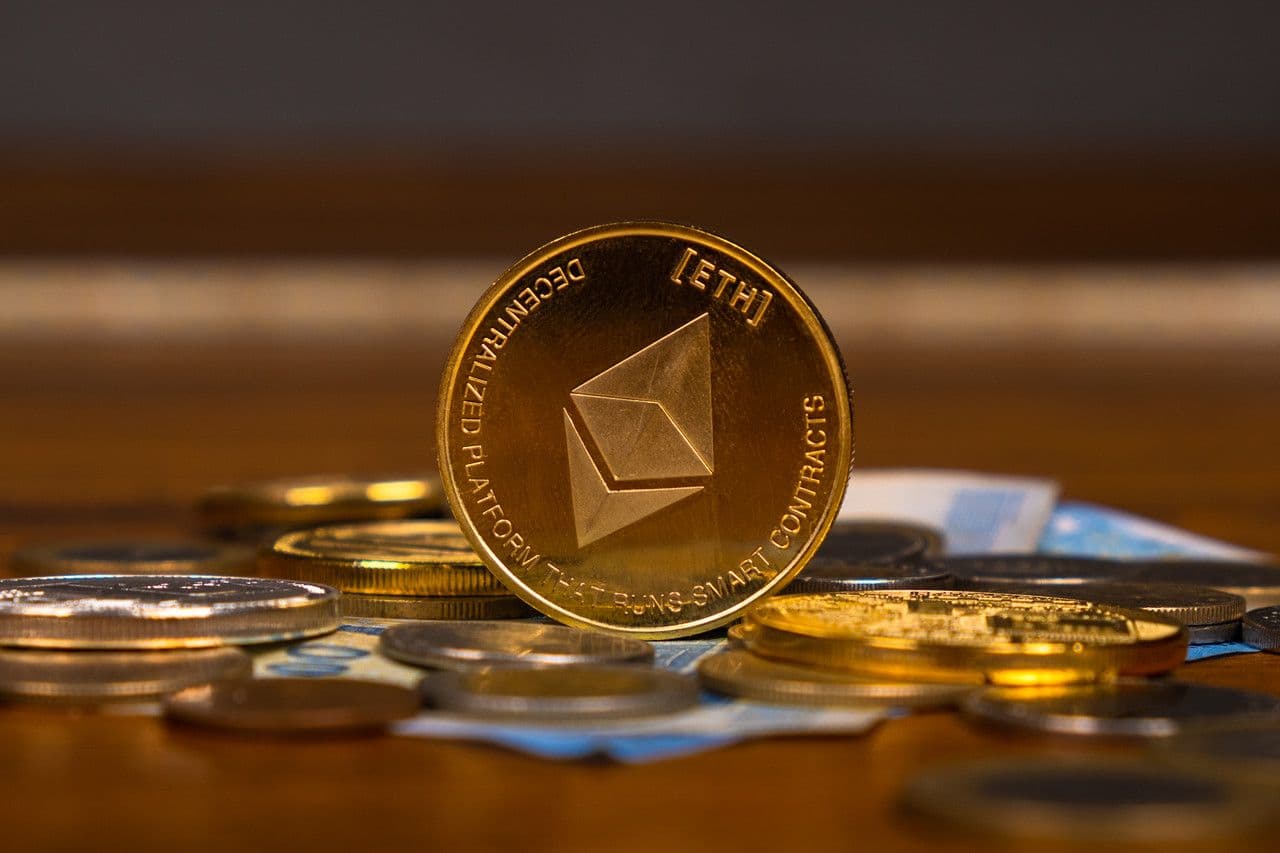
Ethereum Price Prediction: ETH Eyes $3,000 After 5% Weekly Gain
Ethereum price gained 5% over the past week, reaching the critical price area of $2,750. Can Ethereum break through the psychological barrier of $3,000?
May 2, 2026 4:56 PM
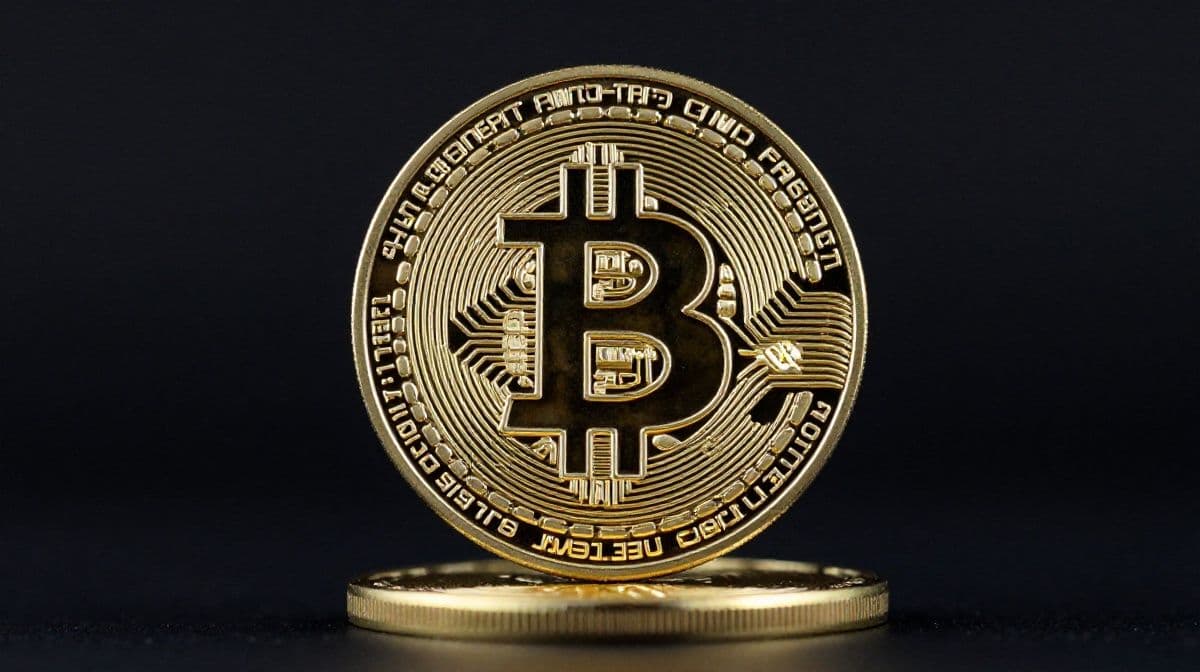
Crypto Price Prediction May 2026: Bitcoin Targets $90,000 as Altcoins Prep for Breakouts
Bitcoin eyes $90,000 in May 2026. Ethereum, XRP, and Cardano prepare for major breakouts contingent on a bullish BTC trend.
March 27, 2026 9:50 PM

Ethereum Price Prediction for 2026: Can ETH Hold Its Long-Term Structure?
Ethereum heads into 2026 at a critical level. After years of volatility, ETH’s long-term structure may define the next move.
December 19, 2024 11:38 AM

Is an Ethereum Price Crash Imminent?
Ethereum price has dipped igniting fears of a potential price crash. Analysts highlight bearish signals, but some still predict a recovery. Which is it next?
July 8, 2024 7:51 AM

Crypto Market Crash News As BTC Price Crash Back To 56K
With the crypto market crash, and Bitcoin price drop to below 56k with recent dormant BTC whales activity, what comes next: a correction or further crash soon?
September 12, 2026 10:11 PM

Crypto CFD or Buying Real Coins? How Leverage, Margin Calls and Tax Differ
With a crypto CFD you own a contract; with a direct purchase you own the crypto asset itself. From that one difference follow the 2:1 leverage cap, forced close-out, the tax burden and the question of who is liable for your money if things go wrong.
February 7, 2026 6:30 PM

Ethereum Price Prediction 2026: Technical Analysis of ETH Coin During the Crypto Crash
Ethereum price faces a major test at $1,800. This 2026 technical analysis of the ETH coin explores recovery targets and deeper crash support levels.
October 2, 2026 5:02 PM

Bitcoin or Ethereum in the fourth quarter of 2026: the two largest crypto-assets compared
Bitcoin is scarce by protocol rule, Ethereum only as scarce as its utilisation, and on access and tax in Germany the paths part again. This comparison puts the verifiable figures on supply, usage, staking and purchase route side by side, without making a price call.
March 8, 2026 10:06 AM
Ethereum Price Prediction: ETH Is Preparing for a Breakout From This Ascending Channel Formation
Ethereum trades near $1,960 inside an ascending channel formation. A breakout could push ETH toward $2,200 if key support holds.
October 13, 2026 10:16 AM

337 million dollars of leverage gone in five days: where does Ether stand now?
Ether trades at $2,533.59 on Tuesday morning after the $2,495 level gave way. In the derivatives market, $337 million of open interest has disappeared in five days.
October 7, 2026 1:18 PM

2,598 dollars and a sixth day of ETF outflows: will Ethereum hold the 2,500 line?
The Ethereum price stands at $2,598 on Wednesday morning, 3.9 percent below the previous day, while the US spot ETFs report a sixth consecutive trading day of net outflows. This article shows which levels below still hold, how far your leverage sits from the liquidation price, and what the German one-year rule under section 23 of the Income Tax Act means for a sale at a loss.
October 5, 2026 10:14 AM

Solana price 108.46 euros: a 2.4 percent gain in euros, a 2.5 percent loss in dollars: what to check now
Solana is quoted at 108.46 euros and $121.30 on Monday morning. That leaves a gain of 2.4 percent for 2026 in euros and a loss of 2.5 percent in dollars. The difference comes purely from the exchange rate, and in Germany it decides the holding period, the tax threshold and the figure that ends up on the tax return.
September 27, 2026 7:14 PM

Solana Price at $121.93: What to Check on Staking Yield, Unstaking and Tax
SOL stands at $121.93 on September 27 at 16:42 UTC, after a 12.7 percent gain over seven days. More important than the weekly move is a calculation almost nobody makes: of the staking yield usually quoted, roughly a quarter is left in real terms, and the epoch decides when you can reach your coins again.
September 26, 2026 10:12 PM

Solana Price Above $120: What to Check on Staking Yield, Holding Period and Spread
Solana is trading at $121.00 on September 26, 2026, 8.6 percent above its level a week earlier. What a self-measured staking yield of 5.27 percent is worth, how the one-year holding period applies to staked SOL, and what an order in euros really costs.
More from CryptoTicker