Ethereum Price Analysis: Key Levels Holding, Will ETH Crash or Bounce Toward $2,500?
Ethereum tests critical support near $2,330. Will ETH bounce toward $2,500 or break lower? Full price analysis and targets.


Ethereum Price Analysis: What the Chart Shows Right Now
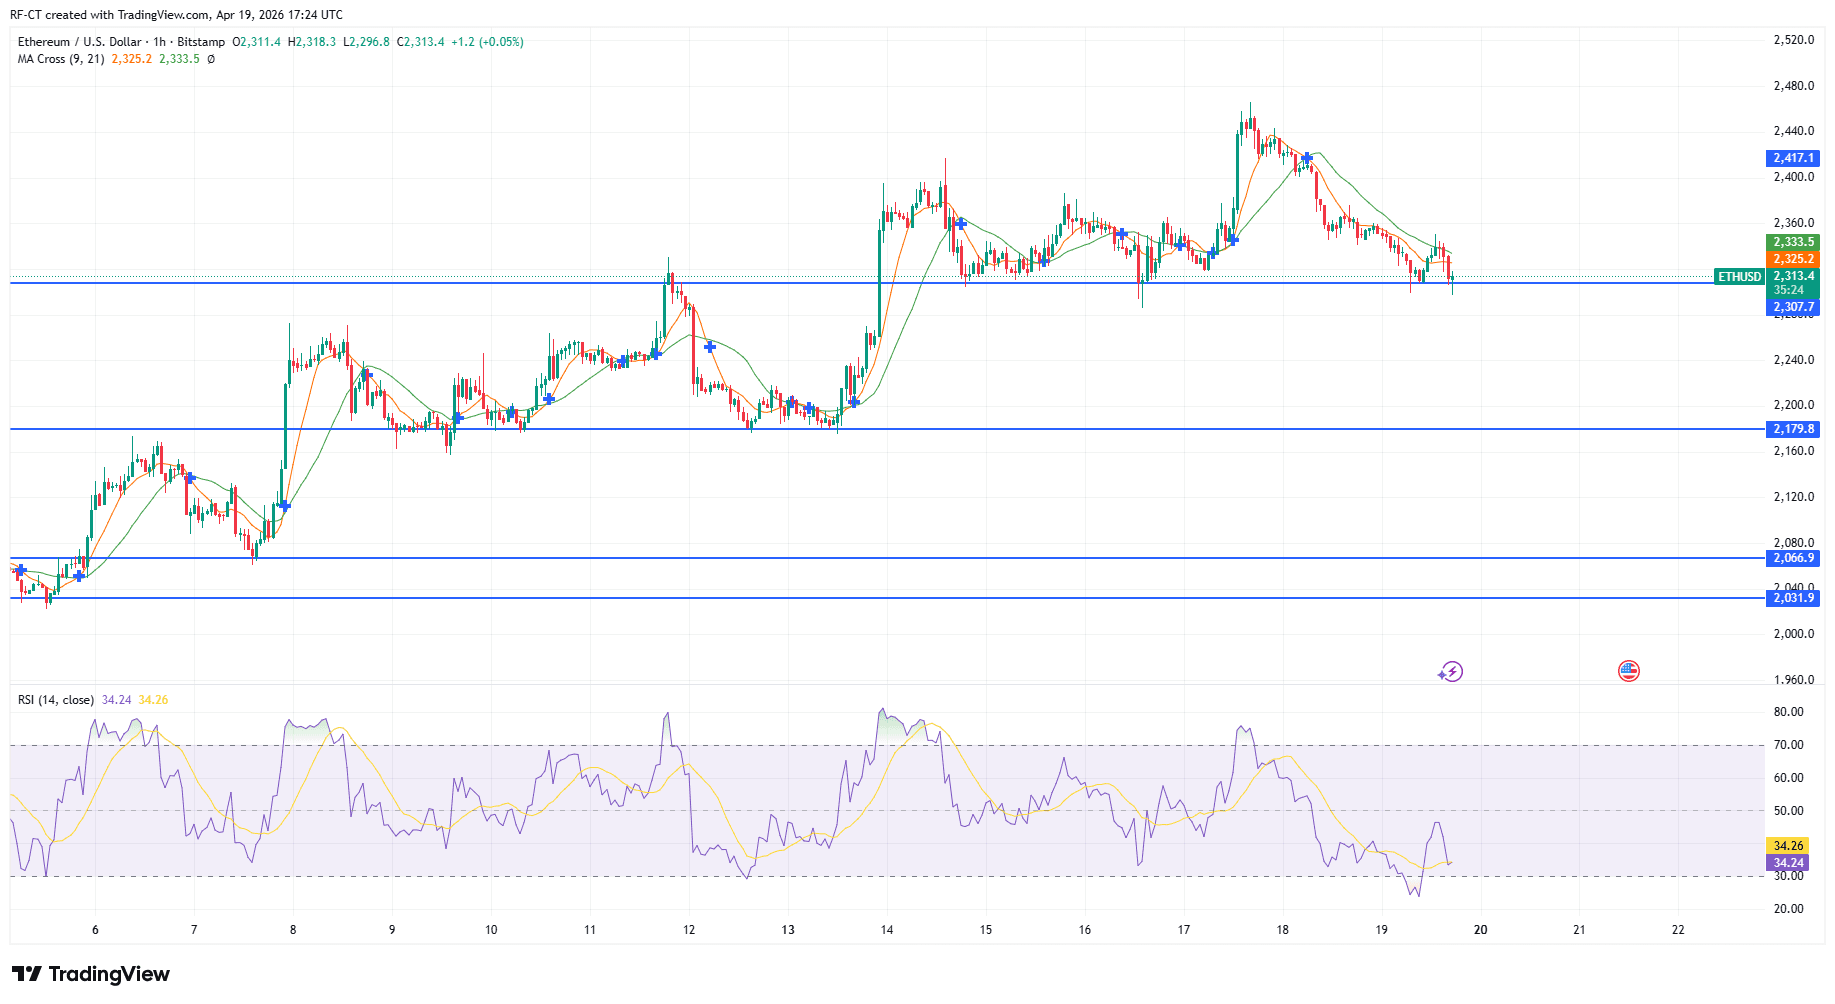
Ethereum is trading around the $2,330–$2,350 zone, sitting directly on a strong support level that has been tested multiple times. This area is clearly acting as a short-term decision point for the market.
The key structure is tightening between nearby resistance and deeper support:
- Resistance sits around $2,417 – $2,450
- Immediate support holds at $2,300
- Lower supports extend toward $2,179 and $2,066
The recent failure to hold above $2,400 signals that bullish momentum is fading, with price starting to form lower highs in the short term.
Trend Breakdown: From Breakout to Cooling Phase
$Ethereum previously surged from the $2,200 region to nearly $2,450 in a strong breakout move. That rally, however, quickly met selling pressure at the top, leading to a gradual slowdown.
Since then, price has slipped below short-term moving averages, which are now flattening. This shift doesn’t confirm a full trend reversal yet, but it clearly shows that the market has entered a cooling and consolidation phase rather than continuation.
 Crypto taxes made simple: Compare the top-rated tools for 100% compliance and efficiency
RSI Signals: A Bounce, But Not a Reversal Yet
The RSI is currently near 34, hovering just above oversold territory. It recently dipped lower and is now attempting a small recovery, which often hints at a potential short-term bounce.
Still, the signal remains weak:
- No clear bullish divergence has formed
- Momentum recovery is limited
This suggests that while a bounce is possible, it may not be strong enough to immediately reverse the trend.
Key Levels to Watch
Ethereum is sitting at a critical support zone around $2,300, and the reaction here will likely define the next move.
If buyers defend this level, the recovery path becomes clearer:
- First target: $2,360
- Then: $2,417
- Breakout zone: $2,450+
A move above $2,450 would shift momentum back in favor of bulls and open the path toward $2,500.
On the flip side, if this support breaks, the downside could accelerate quickly:
- First drop toward $2,179
- Then deeper into $2,066 – $2,030
Market Structure: A Transition Phase
The chart reflects a classic post-rally structure. After a strong upward move, $ETH entered a distribution phase, followed by a gradual decline toward support.
This type of structure often leads to a decisive move once compression ends. Right now, price is caught between holding support and breaking down, making this a make-or-break zone for the short term.
Ethereum Price Prediction (Short-Term Outlook)
The most likely scenario is continued consolidation between $2,300 and $2,400 as the market builds momentum.
- Bullish case: Hold support → reclaim $2,417 → target $2,450–$2,500
- Bearish case: Lose $2,300 → drop toward $2,180–$2,060
The breakout from this range will likely be sharp, as volatility is currently compressing.