Ethereum Price Analysis as ETH risks Crashing below the $2,000 Support
Ethereum struggles to stay above key support levels. Technical charts and rising exchange inflows indicate that ETH could drop below $2,000 soon.


Ethereum ($ETH) has found itself under intense selling pressure over the past few weeks. Despite several attempts by bulls to push the asset back into higher trading tiers, market dynamics have shifted drastically in favor of the bears.
Is Ethereum Crashing Below $2,000?
According to current technical structures on the chart and broader market indicators, there is a substantial risk that the Ethereum price could break below $2,000. The asset is currently facing strong overhead resistance and a lack of immediate buy walls. Market data confirms that whale distribution has accelerated, heavily impacting spot market liquidity.
While short-term relief bounces are always possible in derivatives-driven markets, the overarching multi-week trend highlights a series of lower highs and lower lows. If the current support zones fail to hold back the bears, a continuation toward the next major demand zone below $2,000 appears highly probable before the end of the second quarter.
Ethereum Price Analysis in May 2026
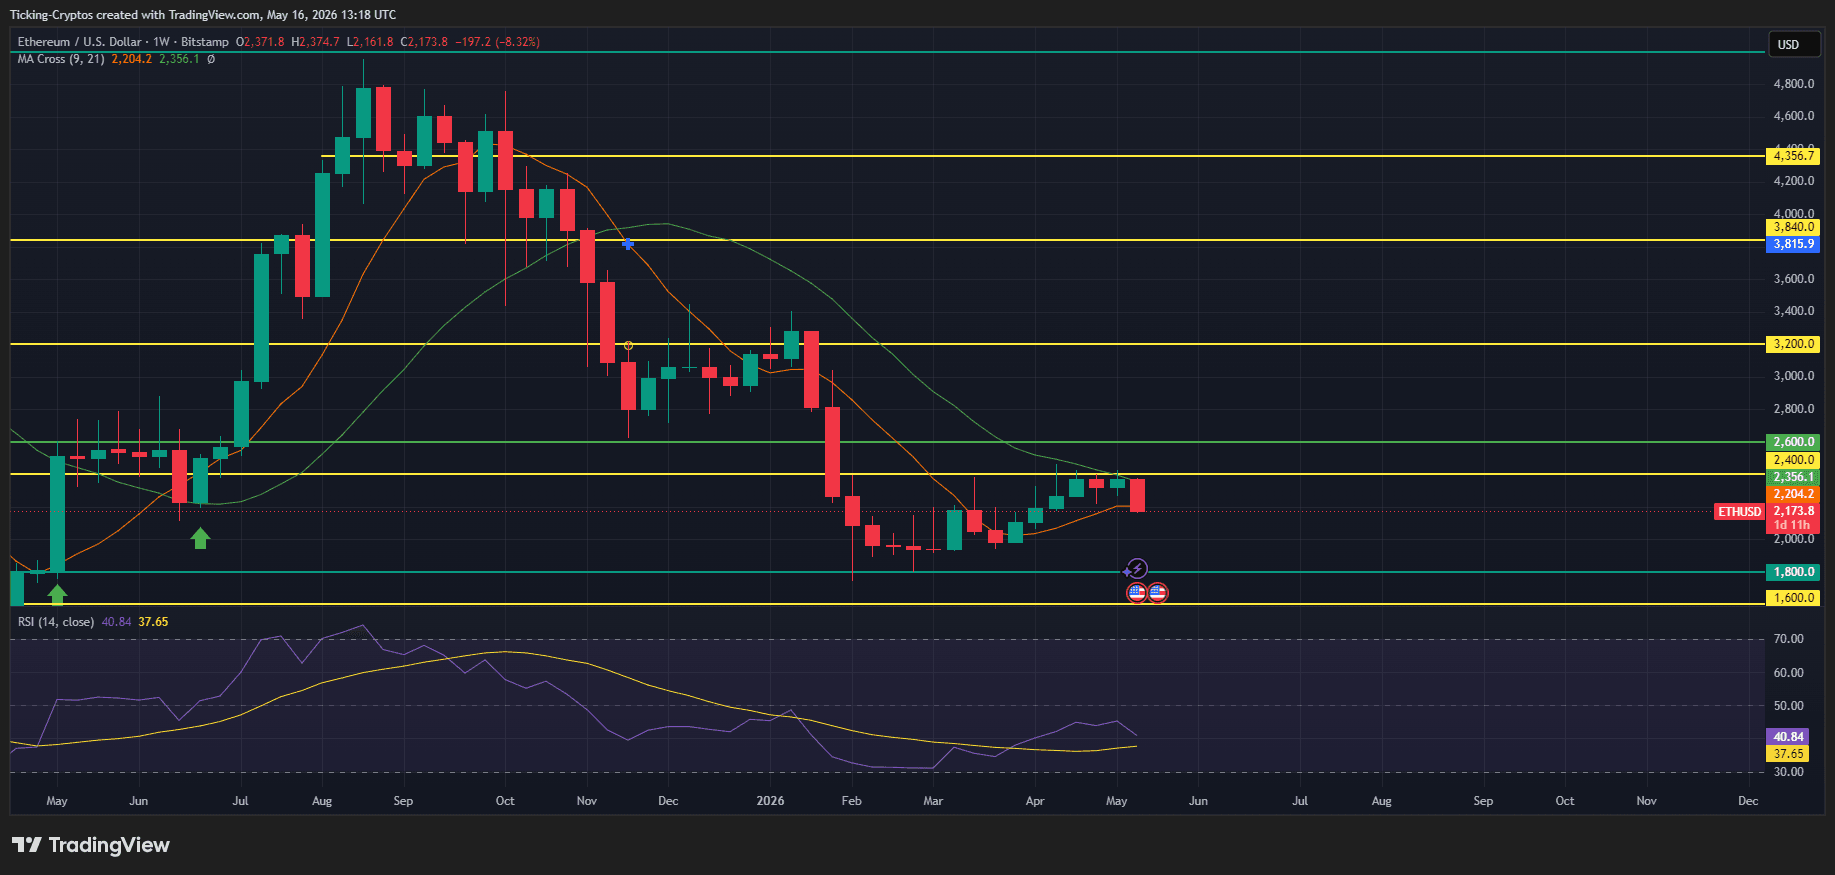
A detailed examination of the weekly ETH/USD chart reveals a distinct breakdown of the mid-term bullish structure.
The Moving Average Crossover and Bearish Sentiment
- The chart shows the 9-period and 21-period Moving Averages (MA Cross) tracking above the current price action. The 9-period MA sits at $2,204.3, while the 21-period MA hovers higher at $2,356.1.
- The fact that the current price is trading at $2,174.5—well below both short-term moving averages—proves that the immediate momentum is firmly controlled by sellers. A sustained position below these lines often transforms previous support areas into firm overhead supply walls.
Horizontal Support and Resistance Levels
Several key horizontal zones are mapped out on this weekly timeframe:
- The Overhead Ceilings: Strong resistance lines are established at $2,400, $2,600, and $3,200. These levels previously acted as consolidation floors before the major distribution phase began.
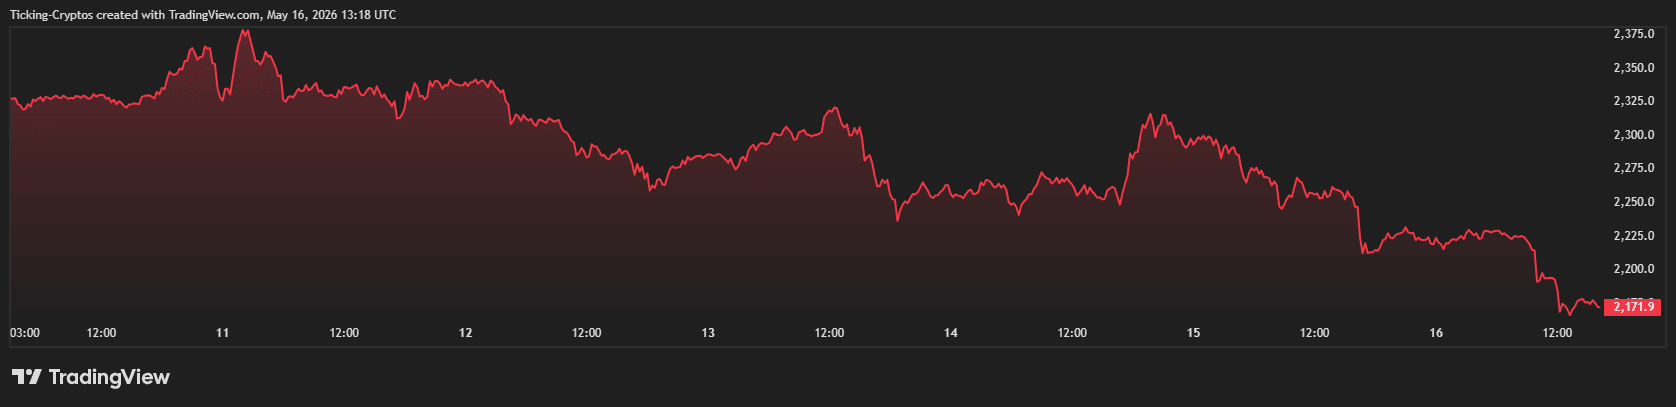
- The Current Battleground: The immediate line of defense for buyers is situated around the green support band between $2,161 and $2,180. The current weekly candle is testing the very bottom of this range, registering a net loss of over 8.29% for the current period.
- The Sub-$2,000 Floors: If the $2,161 floor crumbles, the chart reveals a massive liquidity void. The next structured support bands wait lower at the $1,800 green line and the ultimate macro support level of $1,600.
RSI Indicator Overview
At the bottom of the chart, the Relative Strength Index (RSI) with a 14-period setting is currently printing at 40.86, with its signal line at 37.66. While an RSI reading near 40 shows that the asset is approaching an oversold territory, it has not yet hit the traditional extreme oversold threshold of 30. This implies that there is still ample room for a downward extension before the market forces a structural, momentum-based trend reversal.
Why Is Ethereum Crashing?
Accelerated Whale Distribution and Exchange Inflows
Data from blockchain analytics platforms highlights a worrying trend for Ethereum bulls. Over the past two weeks, exchange reserves for ETH have risen dramatically. Hundreds of thousands of ETH have been transferred onto centralized trading venues, heavily noting an intent to liquidate assets.
This distribution is primarily led by large-scale institutional wallets and "whales" holding between 10,000 and 100,000 ETH. When large entities transfer their holdings onto exchanges, it floods the order books with supply that retail buyers struggle to absorb.
Declining Institutional Inflows
The institutional narrative that pushed Ethereum upward throughout the previous quarters has cooled down. Net outflows from US spot $Ethereum ETFs have added pressure onto the market, dampening overall spot demand. Concurrently, major treasury firms have reported lower staking rewards and decreased yield revenue due to compressed network valuations, pushing institutional players to adjust their portfolios for maximum capital flexibility rather than long-term holding.
 Crypto taxes made simple: Compare the top-rated tools for 100% compliance and efficiency
What Can Save the Bulls?
To invalidate this highly bearish scenario, Ethereum buyers need to step up immediately and force a daily close back above the 9-period moving average at $2,204. Reclaiming this minor level would signal that local demand is active. However, a full macro trend invalidation requires a strong push past the $2,335–$2,400 resistance cluster. Only a weekly close above $2,400 would reliably turn the structural bias back to neutral or bullish.
As macro asset trends undergo these aggressive distribution phases, securing digital assets off centralized exchanges becomes highly recommended. Utilizing cold storage options, which can be explored in detail through our hardware wallets comparison, guarantees that market volatility won't affect asset custody.