
Fed Rate Hike in October: What to Check on Leverage, Liquidation and Holding Period After the PMI Jump
The flash US purchasing managers' index has jumped to 58.4 points, its highest level since July 2021, and input prices are rising at a pace last seen in October 2022. The futures market now prices a further Fed rate hike on October 28 at almost 70 percent, and the crypto market is falling broadly.




Which topics should we dive deeper into?
Select what genuinely interests you. Your picks feed directly into our editorial planning.
Crypto news that's actually worth your time.
Weekly. 60 seconds. Carefully curated by our editors: no hype, no promo flood, no spam.
The most important date for the crypto market in the coming weeks is October 28. That is when the US Federal Reserve decides on the policy rate again, and since September 23 the futures markets have held a further increase to be more likely than a pause. One economic figure caused that turn: the flash purchasing managers' index for the United States jumped to 58.4 points, its highest level since July 2021.
For you as an investor in Germany, what counts is less the figure itself than the chain it sets off. Rising rate expectations make credit more expensive, lift the return on safe assets and therefore weigh on everything that throws off no running income. On the morning of September 24, Bitcoin was trading around 2.8 percent below the previous day's level, with individual names in the top 25 considerably weaker. This piece places the data in context and then works through what there is to check in concrete terms: leveraged positions, the one-year deadline under Section 23 EStG, the buying route and custody.
US PMI Jumps to 58.4: What the Purchasing Managers' Index Actually Measures
The purchasing managers' index, or PMI, is a monthly survey of company purchasing managers that puts every answer on a scale around 50 points: readings above 50 mean growth against the previous month, readings below it contraction. The index therefore measures the direction and pace of change; it says nothing about the absolute size of the economy.
The flash reading for September 2026, published on September 23, took the composite index for the United States to 58.4 points. In August it had stood at 56.0. The jump of 2.4 points carries the index to its highest value since July 2021. S&P Global converts the survey readings into annualised growth of roughly 5 percent. That is the relevant order of magnitude: not a mild pick-up but a pace that makes a central bank with inflation concerns sit up.
A second finding from the same survey is often overlooked. Supplier delays were as widespread as at any time since July 2022. S&P Global attributes that to a lack of operating capacity, meaning that companies can no longer serve demand with the plant and workforces they have. Whoever is short on supply has pricing power. That finding therefore leads straight to the second part of the survey.
Input Prices at Their Highest Since October 2022
Alongside activity, the survey also records how companies' input prices are developing. That sub-index came in at 66.4 points in September, and the rate of input price inflation derived from it reached its highest level since October 2022. S&P Global names higher fuel and transport costs along with wage pressure as the drivers. The figures are in the S&P Global press release, which is blocked to automated retrieval but reads normally in a browser.
Why that matters for crypto prices can be said in one sentence: costs that rise at the input stage travel into consumer prices with a lag, and consumer prices are the measure against which the Fed has its 2 percent target judged. A survey nonetheless remains a leading indicator: available earlier than an official price index, and more volatile for it. Reading it as inflation already settled stretches it too far.
Fed Funds Rate at 3.75 to 4.00 Percent: What Was Decided on September 16
The starting point for the current expectation lies a week back. On September 16, 2026, the Fed's Open Market Committee raised the target range for the overnight rate by a quarter point to 3.75 to 4.00 percent, the first increase since July 2023. The decision was unanimous at twelve votes to none. In the text the committee records that inflation remains elevated and justifies the step on the grounds that it supports a more timely return to the 2 percent target. You can read that in the FOMC decision of September 16, 2026.
The direction is what stands out. For two years the question was when the Fed would cut. Since September the question has been how much further it will raise. That reversal is the frame in which the PMI data is read: a central bank that has just raised and expressly calls inflation elevated is handed two arguments for a further step by a jump in activity and firming input prices.
 Supervised crypto exchanges compared
A Rate Hike on October 28: What the Futures Market Prices In Under CME FedWatch
The CME FedWatch tool is not a bank's forecast but a derivation: it works back from the prices of futures contracts on the US overnight rate traded on the CME to establish which rate decision the market is pricing in for each meeting date. The value is a market opinion in percent, and it changes with every trading day.
Following the PMI release, the daily market report of the KuCoin exchange dated September 24 gives a probability of 69.7 percent for an increase of 25 basis points in October. A German-language analysis of the same futures market data most recently put the October 28 meeting at 41.1 percent. Both values were read off at different moments, and the tool updates continuously. What is reliable is therefore the range: the market moved within a few days from a good 40 to almost 70 percent. Treating either figure as settled confuses a snapshot with a decision.
The next meeting falls on October 28, 2026. Several official data releases lie before it, among them the final PMI reading and US consumer prices. Any of them can turn the priced-in probability back the other way.
Crypto Market Falls Broadly: Bitcoin, Ether and the Top 25 Over 24 Hours
We counted for ourselves how broad the reaction is. This analysis was compiled by cryptoticker.io on September 24, 2026. Basis: the list of the 25 largest cryptocurrencies by market capitalisation from CoinGecko, with a count of the 24-hour change for each asset excluding stablecoins and the tokenised credit products in the list.
Of the 18 assets remaining, 17 were in the red. Seven lost at least 5 percent, the weakest 10.51 percent. Exactly one gained, by 5.83 percent. Bitcoin traded at $84,160 and therefore 2.75 percent below the previous day, within a daily range of $83,654 to $86,459. Ether stood at $2,688, down 2.53 percent, with a daily range of $2,643 to $2,754. What share of that move came from the spot market and what share from futures positions remains open; the market data does not show that split.
The picture is therefore clear: the move hits the whole market, not individual projects, and it hits the smaller names harder than the two large ones. The weekly comparison puts it in perspective at the same time. Despite the pullback, Bitcoin stood 9.85 percent above its level seven days earlier, Ether 9.97 percent. The decline gives back part of a strong week.
Inflows into exchange-traded crypto products run the other way. On one trading day of the current week, market reports put $925.82 million into US crypto ETFs, of which $714.7 million went into Bitcoin products; BTC-Echo puts the two trading days of September 21 and 22 together at around $1.7 billion and speaks of the strongest days in months, expressly not of an all-time record. For you in Germany the access route is what matters here: the US spot ETFs cannot be traded here, and the exchange route runs through debt securities on crypto, that is ETNs and ETPs. What that means for your account, fees and taxation is set out in our overview of crypto ETFs in Germany.
Why Rising Rates Weigh on Crypto Prices
The relationship holds for any asset without a running distribution and is therefore no crypto peculiarity. If the yield on short-dated government bonds rises, so does the return an investor receives without price risk. Everything that draws its return solely from a future price gain has to compete against that. Financing becomes more expensive at the same time: anyone holding positions on credit pays more for them, and part of those positions is closed as soon as the arithmetic no longer holds.
That second channel explains why a moderate decline in Bitcoin coincides with considerably larger swings in smaller names. In thinner order books the same amount sold moves the price further. An analyst's view of how much further this runs deliberately has no place here; the mechanism is evidenced, its end point is not.

Leverage and Liquidation: How a Rate Shock Closes a Position Early
Liquidation means that an exchange closes a position held on credit of its own accord, because the collateral lodged no longer covers the loss. The position then ends at the market price at that moment, regardless of what you had expected. In a market-wide pullback such as the one on September 24, that is the point at which a paper loss becomes a realised one.
Liquidation Price, Funding Rate and Margin Call: The Three Numbers That Count
The liquidation price is shown in your exchange's position overview and shifts as soon as you add or withdraw collateral. Check it against the measured daily range: if Bitcoin's daily low was $83,654 and your liquidation price sits close to it, the question is not theoretical. The funding rate is the payment that flows at fixed intervals between the long and short side on perpetual futures; it is the running price of your leverage and accrues regardless of whether the price moves. The margin call, finally, is the collateral you have to supply to avert a liquidation, and the deadline for it is shorter than a trading day at many houses.
In practice that means: note down your liquidation price, the current funding rate and the distance to the collateral threshold before the next data release comes up. Which venues for perpetual contracts set which fees, leverage limits and liquidation rules you will find in our comparison of perp DEX platforms. The rules differ considerably from house to house and are set out in the respective contract terms.
 Perp DEX: leverage, fees and liquidation rules
Holding Period and Tax: What Selling Into the Pullback Triggers With the Tax Office
Section 23 EStG applies in Germany to privately held cryptocurrencies. Gains from a sale within a year of purchase are taxable as a private disposal transaction and charged at your personal income tax rate; once a year has passed since acquisition, the gain remains tax free. The deadline runs per acquisition, not per holding, and that is the point at which a pullback can become expensive.
Anyone selling in September 2026 disposes, under the sequence usually applied, of the oldest acquisitions first. With purchases made in the summer of 2026 the one-year deadline cannot arithmetically have been met. A sale made out of nerves ahead of a rate decision can therefore trigger a tax charge that would not have arisen had you sat still. For that you need an unbroken record for each acquisition: date of acquisition, quantity, acquisition cost and venue.
The exemption limit of Section 23(3) EStG also has to be borne in mind. If that amount is exceeded, the entire gain is taxable and not just the excess. The amount in force is best checked against the statutory text or with a tax adviser, because it has been adjusted several times in recent years. Which tools carry acquisitions, deadlines and sequence along automatically is set out in our comparison of crypto tax software.

Buying Route and Custody: Exchange, ETN or Your Own Keys Under MiCA
Since the EU regulation on markets in crypto assets, MiCA for short, has been in application, providers addressing customers in the EU need authorisation as crypto asset service providers. For you that has two practical consequences. First, it is visible who operates under supervision and who does not; the authorisation can be traced with the provider and in the supervisor's registers. Second, the authorisation changes nothing about the question of ownership: a balance in an exchange account is a claim against that company, not direct access to the coins.
Three routes are open to you, and they differ in cost, tax treatment and access. Buying directly on a supervised trading platform and then withdrawing to a wallet of your own gives you the keys and keeps the one-year deadline under Section 23 EStG open. Holding on the exchange account is convenient and lets you act quickly if in doubt, but ties you to the solvency and the trading rules of the house. The exchange route through ETNs and ETPs runs in your usual securities account but follows the taxation of investment products and not the private one-year deadline. Ahead of a rate decision it is worth looking above all at two points: how long a withdrawal takes at your provider, and up to what time of day trading happens at all.
Levels Above and Below: Which Price Levels Are in View Now
Levels here are measured values, not price targets. To the downside sits Bitcoin's daily low of September 24 at $83,654; below that begins territory the retrieved daily range no longer covers. To the upside, the daily high of $86,459 marks the zone in which the week had begun, and market reports place the price on September 24 close to its highest level of the past eight months. For Ether the day spans $2,643 to $2,754.
The frame for that is the calendar. Until October 28 it is the data rather than the chart that decides: final PMI figures, US consumer prices, statements from the board of governors. Anyone setting markers in this phase sensibly sets them against dates and not against prices alone.
Fed Rate Hike and the Crypto Market: What to Take Away
- Check leverage first. Open your position overview and note the liquidation price, the funding rate and the distance to the collateral threshold. Compare the liquidation price against the daily low. Which platform sets which leverage limits and liquidation rules is set out in the perp DEX comparison.
- Settle the buying route and trading hours. Check before October 28 how quickly your provider pays out and takes deposits and whether it is authorised under MiCA. A side-by-side of supervised venues with fees and withdrawal routes is under best crypto exchanges.
- Document acquisitions and deadlines. Record the date, quantity, cost and venue for every acquisition, so that a sale does not fall unintentionally within the one-year deadline of Section 23 EStG. Tools that carry this along continuously are in the tax tool comparison.
(As of September 24, 2026. This article is not investment advice. Prices and fee structures change; check the terms with the provider before you buy.)
Transparency note: This article was produced with the assistance of artificial intelligence and reviewed by our editorial team before publication. All figures and claims were checked against the primary sources linked in the text. The feature image was generated with AI.
Related articles
- Bitcoin Price Prediction: What to Check on Levels, Holding Period and Leverage Before the October 28 Rate Decision
- Bitcoin Price Before the Core PCE at 14:30 CEST: Will the $82,735 Level Hold?
- Trump-Xi Summit at the White House: The Crypto Positions to Check Before the Meeting
- Chainlink Above the September High: What Open Interest, Funding Rate and Liquidation Risk Mean for LINK
- Fed Rate Decision of September 16: What It Means for Your Bitcoin Savings Plan
Which topics should we dive deeper into?
Select what genuinely interests you. Your picks feed directly into our editorial planning.
Crypto news that's actually worth your time.
Weekly. 60 seconds. Carefully curated by our editors: no hype, no promo flood, no spam.

September 24, 2026 1:34 PM

Cardano Slides Below $0.24: What ADA Holders Should Check on Leverage, Liquidation and Holding Period
Cardano has given back its move above $0.25 and trades around seven percent below the high of the past 24 hours. What that means for leveraged positions, the holding period of your tranches and the buying route under MiCA.

September 24, 2026 10:36 PM

Ethereum Price Prediction: What to Check on Staking, Leverage and Where You Buy After Three Attempts at $2,800
Ether stands at $2,700 and has bounced off the zone around $2,800 three times in thirty days, without a single daily close above it. What our own count shows, and the three things to settle before the next attempt.

October 8, 2026 4:38 AM

Crypto Market Slides: Bitcoin Loses 4.2 Percent and $651 Million of Long Bets Are Liquidated
Bitcoin has lost 4.2 percent since Tuesday afternoon, and ether and XRP more still. Three reasons can be documented: outflows from the US ETFs, $651 million of forcibly closed long bets and Fed minutes holding out the prospect of another rate rise. A crash it is not, and what to check before buying more is set out here.
September 25, 2026 7:24 PM

Bitcoin Forecast: What to Check on Levels, Holding Period and Buying Route Before the Quarter Ends
Bitcoin stands at $83,877 at 16:40 UTC on September 25, 2026, and the measured volatility of the past 30 days spans a band of $73,600 to $94,200 for the coming month. More important than that band before the quarter ends are three checks: holding period, buying route under MiCA and the reporting duty in force since January 2026.
September 18, 2026 10:14 PM

Bitcoin Back Above $80,000: Buy More, Hold or Take Profits? What to Check Now
Bitcoin is back above $80,000, for the first time since September 7. Whether you buy more, hold or take profits depends less on the daily price than on three things you can check yourself: your holding period, the way you buy, and where your coins are kept.
September 20, 2026 1:11 PM

Bitcoin Golden Cross: What Twelve Signals Since 2014 Really Show
Bitcoin's 50-day line has crossed its 200-day line. We evaluated all twelve golden crosses since 2014 ourselves and measured what happened afterwards. The result argues against the common reading of the signal.
June 18, 2026 9:43 AM

Oil Crashes 38% to a 3.5-Month Low — Why This Is Bullish for Crypto
Oil crashed 38% to $74, near pre-war levels. Lower oil means lower inflation and more rate-cut odds — and that's a tailwind for Bitcoin and crypto.
September 14, 2024 12:01 PM

Bitcoin Surges Past $60K: The Start of a Major Rally or Just Another Bull Trap?
Bitcoin has surged past $60,000, sparking optimism among investors. But with looming market volatility and whale activity, is this the start of a new rally or just another bull trap?
October 8, 2026 4:33 PM

Fed Minutes Point to a Rate Hike by Year-End, Bitcoin at $82,439: The Level That Decides Your Stop
The minutes of the September meeting, published on October 7, show a majority on the Fed committee that considers a further rate hike by the end of the year appropriate. Bitcoin stands at $82,439, and for holders in Germany the holding period, leverage and custody hang on it.

October 5, 2026 10:14 AM

Solana price 108.46 euros: a 2.4 percent gain in euros, a 2.5 percent loss in dollars: what to check now
Solana is quoted at 108.46 euros and $121.30 on Monday morning. That leaves a gain of 2.4 percent for 2026 in euros and a loss of 2.5 percent in dollars. The difference comes purely from the exchange rate, and in Germany it decides the holding period, the tax threshold and the figure that ends up on the tax return.
September 24, 2026 1:24 PM

NEAR Falls Almost 8 Percent After a 62 Percent Week: What to Check on Perps, Buying Route and Holding Period
NEAR Protocol loses up to 7.9 percent on September 24, 2026 and is still more than 55 percent higher over the week. The rally was carried by a confidential perp offering via Hyperliquid, which raises questions of its own on buying route, leverage and holding period in Germany.
September 9, 2026 4:22 PM
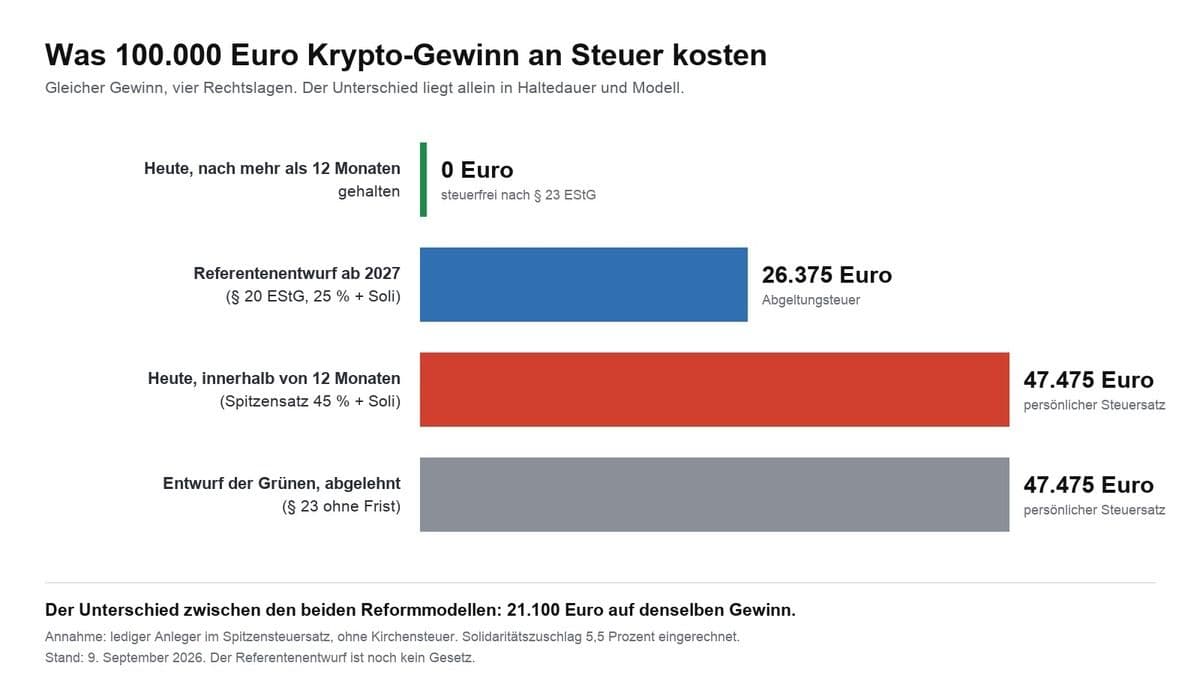
Crypto Tax in Germany: What Applies in 2026 and What Is Set to Change in 2027
Crypto gains are tax-free after twelve months; before that your personal tax rate of up to 45 percent applies. What triggers tax, how the holding period is calculated, what happens with staking and losses, and what the draft bill would change from 2027.
September 8, 2026 10:21 PM

Crypto Holding Period and Grandfathering: Why December 31, 2026 Becomes the Cut-Off in Germany's Draft Bill
A ministerial draft bill from Germany's finance ministry names a cut-off date for the first time: crypto assets acquired after December 31, 2026 are to fall under the flat-rate withholding tax. What that means for legacy holdings, running savings plans and staking income, and why nothing has been decided yet.
October 5, 2026 4:26 PM

Shiba Inu price up 4.4 percent: outperforms the market, but 88 trillion SHIB sit on exchanges
Shiba Inu adds 4.4 percent on Monday, making it the strongest of the six big names. At the same time 88.08 trillion SHIB worth $525 million sit on trading venues, almost five times a single day of turnover.
October 1, 2026 7:25 AM

US core inflation falls to 3.0 percent: what investors need to know before the Fed decision on October 28
US core inflation ran at 3.0 percent in August, clearly below the expected rate. That shifts expectations for the Fed meeting on October 28 and helps decide how much room the Bitcoin price gets in the fourth quarter.
September 24, 2026 10:19 AM

Uniswap Falls 11.8 Percent After a 114 Percent Month: What to Check on Profit Taking, Holding Period and Leverage
UNI lost 11.75 percent on Wednesday morning but is still up 113.85 percent over the month. Anyone realising gains now almost certainly triggers a taxable disposal in Germany.
September 27, 2026 1:17 PM

Dogecoin Price: What to Check on Holding Period and Custody Before the Year End
The Dogecoin price stands at $0.0977 on September 27, 2026 and has barely moved in a day. That calm is exactly the moment to work through the holding period, the reporting duty from 2026 and custody without any time pressure.
August 21, 2026 1:33 PM
Bitcoin With No Cost Basis: How Austria Taxes the Sale
Bitcoin purchase price no longer provable? How Austria works out the capital gains tax, when a flat-rate cost basis applies and what investors can do.
January 14, 2026 2:47 PM

Crypto Markets on Edge on 14 January 2026: US PPI Surprise Ahead of the Tariff Ruling
Hot US producer prices and a pending Supreme Court tariff ruling kept crypto on edge on 14 January 2026. The ruling came on 20 February, and the Fed later raised rates.
September 24, 2026 10:12 AM

XRP Falls 9.7 Percent: What to Check on Holding Period and Buying Route
XRP is down around 9.7 percent on the morning of September 24, twice as much as the typical large crypto asset. Our count of 18 coins shows who the pullback hits and which three things hold true regardless of the price.
September 17, 2026 12:32 PM
Trump Says Oil Will Tumble When the Iran War Ends: What That Would Mean for Crypto
Trump expects the Iran war to end after the midterms and oil to fall hard. Oil is near a four-month high instead. Here is why crypto should still care.
September 17, 2026 10:40 AM

Crypto News Today: Bitcoin Holds $76,000 After Fed Hike and CLARITY Act Collapse
The CLARITY Act died in the Senate, the Fed hiked for the first time since 2023, and Zcash ripped anyway. Here is the full crypto market update.
September 9, 2026 4:13 PM

Bitcoin 29 Percent Below Last Year: Which Crypto Losses You Can Still Use Before the One-Year Holding Period Expires
Nine out of ten major crypto assets trade lower today than exactly twelve months ago, Bitcoin alone by 29.2 percent. We measured the price series ourselves and show why the purchase date alone decides the tax value of your loss.
September 8, 2026 1:19 AM

Germany's Crypto Holding Period: What Happens Now Signing for Petition 201716 Closed on September 15
Recap as of September 27, 2026: the signature period for German parliamentary petition 201716, which asks for the one-year crypto holding period to be preserved, closed on September 15, 2026. This article explains what ended that day, how the petitions committee proceeds and why no investor has to sell because of it.
September 3, 2026 4:04 PM

Bitcoin Price Smashes Back Through $80,000: Here Is What Just Set It Off
Bitcoin price surged to $80,477 in a matter of hours after a dovish Fed signal crushed rate hike bets. Here is the chart and the real driver.
October 12, 2026 7:53 PM

Bitcoin Forecast: Last Inflation Print Before the Fed, and $82,500 Is the Level That Decides
Bitcoin trades at $82,663 on Monday evening, below its 20-day line but above its 50-day line. Wednesday brings the last US inflation print before the Fed decision of October 28, and it sets the range for the next two weeks.
October 6, 2026 1:23 AM

50 euros a month in Bitcoin, 118 instalments since 2017: savings plan vs lump sum
118 monthly instalments of 50 euros since January 2017 add up to €5,900 paid in and around €54,500 today. The same instalment since January 2024 is up only 14.5 percent, and since October 2025 the savings plan beats the lump sum by almost 39 percentage points.
More from CryptoTicker