
Bitcoin Golden Cross: What Twelve Signals Since 2014 Really Show
Bitcoin's 50-day line has crossed its 200-day line. We evaluated all twelve golden crosses since 2014 ourselves and measured what happened afterwards. The result argues against the common reading of the signal.





Which topics should we dive deeper into?
Select what genuinely interests you. Your picks feed directly into our editorial planning.
Crypto news that's actually worth your time.
Weekly. 60 seconds. Carefully curated by our editors: no hype, no promo flood, no spam.
Bitcoin's 50-day moving average is back above its 200-day line. Chart analysts call this pattern a golden cross and treat it as a buy signal. We ran the numbers on what it has actually been worth: across eleven measurable golden crosses since 2014, Bitcoin stood higher 90 days later in eight cases, by an average of 15.9 percent. After the opposite signal, the death cross, the median gain over the same period was higher still. That makes the signal a gauge of sentiment rather than a moment to act.
cryptoticker.io compiled this analysis itself on September 20, 2026. How we calculated it, and what we could not measure, is set out openly further down. For you as an investor in Germany, what a sale on a signal does to your holding period, your exemption limit and your custody matters more in the end than any line on a chart.
Golden cross explained: when the 50-day line crosses the 200-day line
A moving average is the mean of the closing prices of the last n days, recalculated every day. The 50-day line therefore tracks the average price of the past fifty days, the 200-day line that of the past two hundred. Because the short line reacts faster to fresh prices, it eventually climbs above the sluggish long line during an upward phase.
That intersection is the golden cross. Its counterpart, where the short line falls below the long one, is the death cross. Neither term describes a cause or a forecast. Both describe a property of the calculation: they only ever occur after the price has already moved in one direction for weeks. A golden cross is therefore a lagging signal. It confirms a move that has already happened.
The current Bitcoin price and the two lines are a long way apart at the moment, which is typical of a fresh signal. More important than the gap is whether the crossover holds. In our analysis, that is precisely the weak point.
Bitcoin price today: $80,307, with the 50-day line at $73,189 and the 200-day line at $70,502
Bitcoin trades at $80,307 on September 20, 2026, the equivalent of 69,960 euros. That is 0.86 percent less than the previous day. Over the week it is up 3.89 percent, over the month 6.51 percent. Over twelve months, by contrast, Bitcoin is down 30.62 percent. The daily high was $81,864, the daily low $80,187. Market capitalization stands at $1.614 trillion on daily turnover of $25.35 billion. The price is 36.3 percent below its all-time high of $126,080 set on October 6, 2025. All figures come from the public CoinGecko endpoint, retrieved at the time stated.
Our own time series of Bitstamp daily closing prices puts the 50-day line at $73,189 and the 200-day line at $70,502 for September 20. The short line therefore sits around 3.8 percent above the long one. The CoinGecko series arrives at $72,822 and $70,448 for the same day, a gap of 3.4 percent. Both series show the same picture at slightly different resolution.
The relationship between price and lines is what stands out. At $80,307, Bitcoin sits almost ten percent above its own 50-day line. A pullback to that line would arithmetically mean a loss of around seven percent, and would have nothing to do with the signal itself.
September 8 or September 16? Why the date of the golden cross depends on the data source
Our research turned up a discrepancy that we are not smoothing over: the date of the crossover is not unambiguous. Our calculation on Bitstamp daily closes puts the intersection on September 8, 2026. Bitcoin closed at $78,449 that day, with the 50-day line at $69,957 and the 200-day line at $69,869. The cross-check on the independent CoinGecko daily series gives September 9 at $78,451, $69,958 and $69,845. One day apart, explained by the differing daily cut-off of the two series.
Part of the trade press names September 16 instead, putting the 50-day line at $73,535 and the 200-day line at $73,077. The second figure lies around $2,600 above our value for the same period. That suggests a different index or a different averaging method underlies it. We cannot prove it, so what stands here is the range and no verdict.
A third, independent signal supports our reading. The trade publication Decrypt wrote on September 10, 2026 that the crossover was expected to confirm over the following days, and classified it as the first golden cross since the death cross of November 2025. Our series puts exactly that death cross on November 16, 2025. In practice this means that anyone tying a trading rule to such a date is tying it to a data source they have to know and document.
 Buying Bitcoin: the exchanges compared
Twelve golden crosses since 2014: what our analysis measures after 30, 90, 180 and 365 days
We identified every crossover of the two lines since the start of our time series and measured how the price developed afterwards. There are 24 crossovers in total, twelve golden crosses and twelve death crosses. The current signal naturally has no follow-up period yet, which leaves eleven measurable golden crosses.
After 30 days, Bitcoin stood higher in six of eleven cases, by an average of 5.5 percent and a median of 3.2 percent. The range runs from minus 39.3 to plus 42.5 percent. After 90 days it was eight of eleven, averaging plus 15.9 percent with a median of plus 19.1 percent, on a range of minus 43.4 to plus 86.7 percent. After 180 days, again eight of eleven, averaging plus 29.3 percent, median plus 35.4 percent, range minus 56.6 to plus 95.1 percent. After one year, eight of eleven, averaging plus 102.6 percent, median plus 90.7 percent, range minus 59.1 to plus 412.3 percent.
The gap between mean and median reveals more than the figures themselves. In the one-year column, a single case pulls the average up: the golden cross of February 18, 2020 returned 412.3 percent over twelve months. The same entry was down 39.3 percent after thirty days, because the Covid crash fell in between. An investor who had followed the signal and failed to sit out the collapse would have exited at a loss on the best signal in the series.
At the other end sits the golden cross of September 15, 2021. It was 28.1 percent ahead after thirty days and 59.1 percent behind after a year. The signal of July 12, 2014 lost 43.4 percent within 90 days. For the longer history, the trade publication CoinDesk arrives, in an analysis dated September 3, 2026, at twelve golden crosses since 2012, a three-month average of 24.9 percent across nine measurable cases, and the finding that only three of the twelve crossovers survived a full year without being broken by a death cross. Those three returned an average of 250 percent. The number of signals matches ours; the three-month average lies above our 15.9 percent. Both values stand here side by side.
Death cross beats golden cross: the finding that devalues the buy signal
The most revealing part of our analysis does not concern the buy signal at all. We repeated the same measurement for the twelve death crosses, that is, for the supposed sell signal. After 90 days, Bitcoin stood 21.6 percent higher there on average and 29.4 percent higher at the median. Both values exceed what the buy signal delivered over the same period.
Individual cases are drastic. The death cross of September 12, 2023 was followed by a gain of 167.1 percent within 180 days. The one of March 25, 2020 was followed by 667.0 percent over twelve months. Anyone who had sold on both occasions would have missed the strongest phases of those years.
This is not an argument for inverting the sell signal and buying on death crosses. The sample is too small, and the median of the one-year values for death crosses sits clearly in the red at minus 9.1 percent. It is an argument for crediting neither crossover with any steering function. They measure what has been. About what is coming, they say little of substance in our sample.
Method and limits: which data we checked and what we could not measure
The basis is a time series of 5,513 daily closing prices for the BTC/USD pair from Bitstamp via the exchange's public price interface. It runs from August 18, 2011 to September 20, 2026 and contains no gap, which we verified programmatically. From these closing prices we formed simple moving averages over 50 and 200 days and counted every change of sign in their difference as a crossover. The follow-up compares the closing price on the day of the crossover with the closing price 30, 90, 180 and 365 calendar days later. A second, independent series of 365 daily points from CoinGecko served as the cross-check.
Four limitations apply. First, our series begins in August 2011, and the first two hundred days yield no 200-day line; crossovers before April 2014 are therefore not included. Second, we work exclusively with daily closing prices and therefore cannot see whether a crossover was briefly reversed during the trading day. Third, the prices come from a single venue and one aggregate series; other indices may differ, and the date question above shows exactly that. Fourth, all returns are gross figures before fees, spreads and taxes. In practice the result comes out lower.
Anyone wanting to reproduce the calculation does not need a trading account for it. The interfaces used are public, and the method is described in full above.

Crypto capital gains holding period under Section 23 EStG: what selling on a signal costs you
In Germany, Bitcoin counts among the other assets within the meaning of Section 23 of the Income Tax Act. If you sell within one year of buying, the gain is taxable as a private disposal transaction and is charged at your personal income tax rate. Once a year has elapsed it is tax-free, with no upper limit. That is the core of the rule, and you can look it up in the official statutory text.
From that follows a calculation that beats any chart signal. Suppose you have held Bitcoin at a profit for eight months and sell now because one line has crossed another. You then pay tax on the entire gain at your personal rate, which for many people in employment lies between 30 and 42 percent. Had you waited four months, the same gain would have been tax-free. The signal would first have to earn you that difference before it delivers anything at all.
Two further points belong here. For allocation, the first-in-first-out method applies, so you are deemed to sell your oldest holdings first. And losses from private disposal transactions can only be offset against gains of the same kind, not against employment income or investment income. Anyone trading frequently on signals therefore produces transactions that have to be documented and declared in the Anlage SO schedule. The exemption limit for private disposal transactions is 1,000 euros per year; once the total reaches 1,000 euros, the entire gain is taxable and not merely a part of it.
Correction (30 September 2026): An earlier version said the entire gain only becomes taxable once it exceeds 1,000 euros. Under section 23(3) sentence 5 of the German Income Tax Act, total gains from private disposals remain tax-free only if they amount to less than 1,000 euros in the calendar year; from 1,000 euros the entire gain is taxable.
 Self-custody: hardware wallets compared
The ministerial draft and December 31, 2026: why the cut-off date counts for new purchases
Since September 2026, a draft has been on the table that would change this system. On September 8, 2026, a ministerial draft bill from the Federal Ministry of Finance became known which would classify crypto assets as investment income in future, charge them a flat 25 percent withholding tax and thereby remove the one-year period. It provides for entry into force on January 1, 2027 and for application exclusively to holdings acquired after December 31, 2026; the automatic tax deduction by service providers is to take effect from January 1, 2028. A bill for higher taxation of crypto assets is before the Bundestag in parallel.
What matters is the stage of the process: none of it has been passed. The 2026 Annual Tax Act does not contain the abolition of the holding period, and a ministerial draft is a working version from the ministry, not applicable law. We set out the content here because it explains the cut-off date, and not because it is certain to arrive.
For you, a sober rule of thumb follows from it. Holdings you buy before December 31, 2026 would, under this draft, continue to fall under the old rule with a tax-free sale after one year. Purchases after that would not. Anyone already considering topping up therefore has a date in the calendar that is more reliable than any chart line. That is expressly not a recommendation to buy for that reason; whether a draft becomes law is decided by the legislature and not by a timetable from the ministry.
Where you buy under MiCA: what has applied to German investors since the transition period ended
The transition period of the European crypto regulation MiCA has expired: EU-wide on July 1, 2026 at the latest, in Germany already on December 31, 2025. Providers serving retail customers in the EU have needed a CASP authorization since then. Those without one may not lawfully continue their retail business. For you that is a verifiable fact and not a matter of taste: your provider's authorization status is recorded in the BaFin register and in the European ESMA register, and a look there takes a few minutes. What the license means in day-to-day terms we have written up in our overview of the MiCA obligations for crypto companies.
Correction (September 30, 2026): An earlier version gave July 1, 2026 as the end of the transition period without the German rule. Under Article 143(3) MiCA (Regulation (EU) 2023/1114), the transitional regime applied EU-wide until July 1, 2026 at the latest, and member states could shorten it. Germany did: under section 50(2) no. 3 of the German Crypto Markets Supervision Act (KMAG), the continued authorisation expired on December 31, 2025 at the latest.
A chart signal changes nothing about that check, but it does shift the order of things in your head. In phases when a buy signal is running through the media, experience shows that offers appear promising quick access and favorable terms. BaFin publishes warnings on a rolling basis about providers offering crypto asset services without authorization. Comparing against the register costs less time than the later search for your money.

Leverage and liquidation: why a hit rate of 8 out of 11 carries no borrowed money
Eight positive outcomes out of eleven after 90 days sounds like a usable rate. It becomes worthless as soon as borrowed capital is involved, because a leveraged holding is not settled on the reporting date but continuously. What counts then is the lowest point between entry and reporting date, and in our series that point was repeatedly deep enough to close a position beforehand.
The golden cross of February 18, 2020 is the clearest example. It ended twelve months later 412.3 percent up and stood 39.3 percent down after thirty days. A doubly leveraged entry would arithmetically have been liquidated in that interim low before the signal paid off. With five times leverage, a decline of around twenty percent would have been enough. Anyone trading via brokers with leveraged products should therefore know the liquidation threshold of their position before invoking a chart signal as justification.
Funding comes on top of that. Perpetual contracts carry a funding rate, a periodic payment between the buy and sell sides that in upward phases is typically borne by the buy side. Over weeks it adds up and eats into precisely the return the signal supposedly delivers. Holdings held physically without credit do not have this problem; there the question shifts to where the coins sit and who holds the key to them.
Putting the golden cross in context: what you take away from it
- Treat the crossover as confirmation, not as an instruction. Eight positive outcomes out of eleven after 90 days, on a range of minus 43.4 to plus 86.7 percent, are no basis for entering on a fixed date. If you want to change your allocation, first check which provider you are buying from and whether it is authorized: the overview of regulated crypto exchanges names the houses with European authorization.
- Do the tax math before the chart. A sale within the one-year period costs you your personal tax rate on the entire gain, a sale after it costs nothing. Record when which quantity was bought and keep the transactions cleanly; the tools for that are in the comparison of crypto tax software and portfolio trackers.
- Take the weight off the timing. The signal's biggest weakness is that it forces a single date. Anyone buying in fixed installments instead does not need to know the date of the crossover at all; how that works in practice is set out in the overview of Bitcoin savings plans.
(As of September 20, 2026. This article is not investment advice. Prices and fee structures change; check the terms with the provider before you buy.)
Transparency note: This article was produced with the assistance of artificial intelligence and reviewed by our editorial team before publication. All figures and claims were checked against the primary sources linked in the text. The feature image was generated with AI.
Related articles
- Dogecoin price at $0.0929: why the 200-day line sits at $0.0878 and not at $0.093
- Cardano at a three-month high, the golden cross fell on October 1: the last one ended 42.4 percent lower
- Bitcoin Price Prediction: What to Check on Levels, Holding Period and Leverage Before the October 28 Rate Decision
- Bitcoin Savings Plan in Austria: How the Purchase Price Is Calculated
- Bitcoin Forecast: What to Check on Levels, Holding Period and Buying Route Before the Quarter Ends
Which topics should we dive deeper into?
Select what genuinely interests you. Your picks feed directly into our editorial planning.
Crypto news that's actually worth your time.
Weekly. 60 seconds. Carefully curated by our editors: no hype, no promo flood, no spam.

September 30, 2026 4:14 AM

Bitcoin Price Before the Core PCE at 14:30 CEST: Will the $82,735 Level Hold?
At 14:30 CEST today the Bureau of Economic Analysis publishes the core PCE deflator for August, the inflation gauge the Fed anchors its 28 October rate decision to. Bitcoin stands at $83,329, less than $600 above its daily low, and anyone holding on leverage decides this morning.
September 18, 2026 10:14 PM

Bitcoin Back Above $80,000: Buy More, Hold or Take Profits? What to Check Now
Bitcoin is back above $80,000, for the first time since September 7. Whether you buy more, hold or take profits depends less on the daily price than on three things you can check yourself: your holding period, the way you buy, and where your coins are kept.

September 9, 2026 4:22 PM
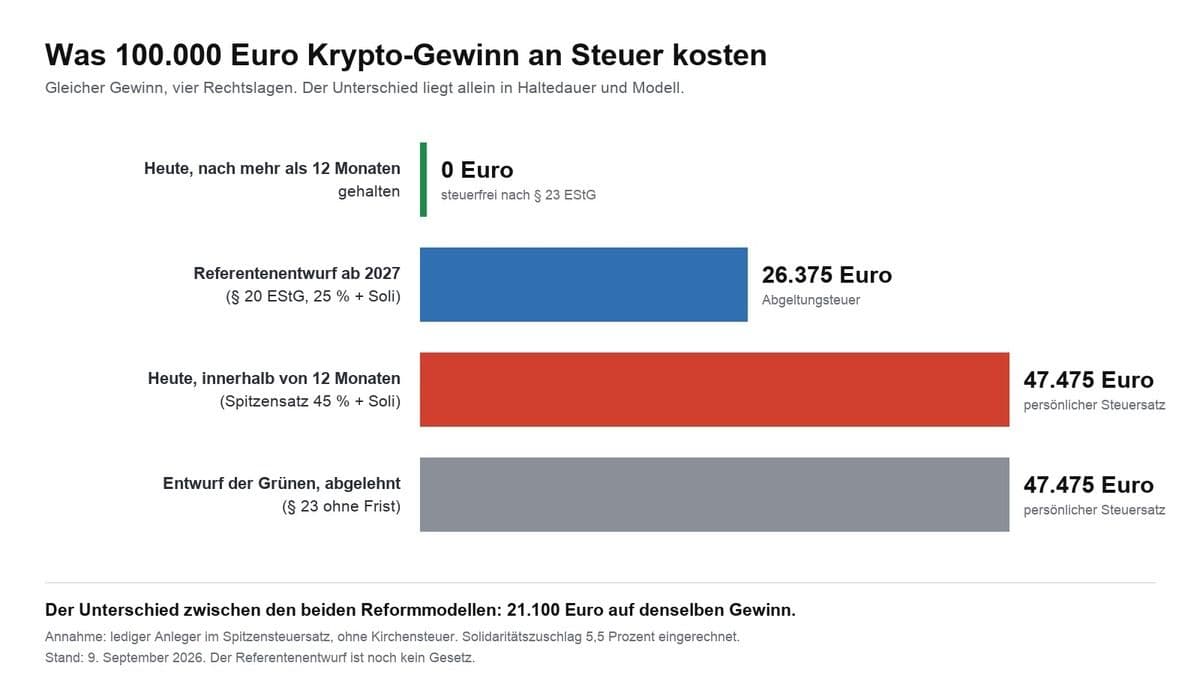
Crypto Tax in Germany: What Applies in 2026 and What Is Set to Change in 2027
Crypto gains are tax-free after twelve months; before that your personal tax rate of up to 45 percent applies. What triggers tax, how the holding period is calculated, what happens with staking and losses, and what the draft bill would change from 2027.

September 24, 2026 10:38 AM

Fed Rate Hike in October: What to Check on Leverage, Liquidation and Holding Period After the PMI Jump
The flash US purchasing managers' index has jumped to 58.4 points, its highest level since July 2021, and input prices are rising at a pace last seen in October 2022. The futures market now prices a further Fed rate hike on October 28 at almost 70 percent, and the crypto market is falling broadly.
September 27, 2026 1:17 PM

Dogecoin Price: What to Check on Holding Period and Custody Before the Year End
The Dogecoin price stands at $0.0977 on September 27, 2026 and has barely moved in a day. That calm is exactly the moment to work through the holding period, the reporting duty from 2026 and custody without any time pressure.

September 24, 2026 10:12 AM

XRP Falls 9.7 Percent: What to Check on Holding Period and Buying Route
XRP is down around 9.7 percent on the morning of September 24, twice as much as the typical large crypto asset. Our count of 18 coins shows who the pullback hits and which three things hold true regardless of the price.
September 9, 2026 4:13 PM

Bitcoin 29 Percent Below Last Year: Which Crypto Losses You Can Still Use Before the One-Year Holding Period Expires
Nine out of ten major crypto assets trade lower today than exactly twelve months ago, Bitcoin alone by 29.2 percent. We measured the price series ourselves and show why the purchase date alone decides the tax value of your loss.
September 8, 2026 1:19 AM

Germany's Crypto Holding Period: What Happens Now Signing for Petition 201716 Closed on September 15
Recap as of September 27, 2026: the signature period for German parliamentary petition 201716, which asks for the one-year crypto holding period to be preserved, closed on September 15, 2026. This article explains what ended that day, how the petitions committee proceeds and why no investor has to sell because of it.
October 6, 2026 1:23 AM
50 euros a month in Bitcoin, 118 instalments since 2017: savings plan vs lump sum
118 monthly instalments of 50 euros since January 2017 add up to €5,900 paid in and around €54,500 today. The same instalment since January 2024 is up only 14.5 percent, and since October 2025 the savings plan beats the lump sum by almost 39 percentage points.
October 9, 2026 1:18 PM

Bitcoin Tax: One Year Past the $126,080 Peak, Losses No Longer Count
Bitcoin trades at $82,558 on Friday morning, 34.5 percent below an all-time high that is now a good year old. Anyone who bought back then loses more than the prospect of a quick recovery when the one-year period expires: the tax value of the loss goes with it.
October 6, 2026 4:32 AM
Bitcoin for a gift card: what paying with crypto means for your holding period
Paying for a gift card with Bitcoin is a sale for tax purposes. What counts as the disposal proceeds, when the twelve-month holding period bites, and the four records the tax office expects.
September 25, 2026 10:26 PM

Selling bitcoin privately: the tax in Germany and the records you need
A direct sale to a private individual falls under the same one-year rule as an exchange sale, but there is no tax report to go with it. This guide walks through the calculation, the 1,000 euro threshold and the records the tax office wants to see.
September 24, 2026 10:19 PM

Bitcoin for Retirement: What Applies from 2027 and What You Decide Now
Bitcoin is not permitted in any state-subsidised retirement product, including the new retirement savings account from 2027. Anyone who still wants to use crypto assets for their own pension goes through private assets, and there a cutoff date at the end of 2026 is shifting the tax rules right now.
October 10, 2026 7:15 PM

ING and Bitcoin: Around 50 Crypto ETNs in the Portfolio, and What the Delivery Claim Means for Your Holding Period
Bitcoin can be bought at ING, but only as an exchange-traded note: around 50 crypto ETNs from five issuers, as a one-off purchase or a savings plan from one euro. What the offer really costs, and what the one-year holding period hangs on, is not in the advertising but in the key information document.
September 27, 2026 10:14 AM

Shiba Inu Price Prediction: What to Check on SHIB Before the December 31 Deadline
SHIB trades at $0.00000592 on September 27, 2026, around 93 percent below its all-time high. For German investors one date matters more than the chart right now: December 31, 2026.
September 24, 2026 1:34 PM

Cardano Slides Below $0.24: What ADA Holders Should Check on Leverage, Liquidation and Holding Period
Cardano has given back its move above $0.25 and trades around seven percent below the high of the past 24 hours. What that means for leveraged positions, the holding period of your tranches and the buying route under MiCA.
September 17, 2026 7:12 PM

Gifting Bitcoin to Children: Allowance, Holding Period and the Tax Office Report
Transferring Bitcoin to your child hands over your holding period and your entry price along with the coins. This guide sets out what really applies in Germany on the allowance, the reporting deadline, representation and custody.
July 8, 2024 7:51 AM

Crypto Market Crash News As BTC Price Crash Back To 56K
With the crypto market crash, and Bitcoin price drop to below 56k with recent dormant BTC whales activity, what comes next: a correction or further crash soon?
October 7, 2026 7:18 AM

Certificate, Bitcoin ETN or the coin itself: what each route means for tax and custody
A Bitcoin certificate, an ETN and the coin itself all lead to the same price, but to three different tax treatments and three different risks. The comparison shows which route fits your portfolio and why December 31, 2026 becomes the cut-off date.
September 27, 2026 4:12 AM

Bitcoin ETF Inflows Turn 2026 Positive: How to Tell If the Demand Holds
US spot Bitcoin ETFs took in roughly $2.4 billion in the week to September 25, the strongest week since October 2025, and that turns the 2026 year-to-date balance positive. Why the daily inflow fell 87 percent within the same week, and what to check on buying route, holding period and custody.
September 10, 2026 4:15 PM

BW-Bank Opens Bitcoin Trading Inside the Securities Account: What to Check Before Your First Buy
Since September 9, 2026, BW-Bank customers have been able to trade ten crypto assets through their securities account, executed and held in custody by Bitpanda. The familiar securities-account setting hides three points you should settle before your first order.
October 2, 2026 5:02 PM

Bitcoin or Ethereum in the fourth quarter of 2026: the two largest crypto-assets compared
Bitcoin is scarce by protocol rule, Ethereum only as scarce as its utilisation, and on access and tax in Germany the paths part again. This comparison puts the verifiable figures on supply, usage, staking and purchase route side by side, without making a price call.
September 24, 2026 4:16 AM

Trump-Xi Summit at the White House: The Crypto Positions to Check Before the Meeting
Xi Jinping is on a state visit to Donald Trump today, and the crypto market comes into the meeting carrying the gains of an exceptionally strong week. What to check on leverage, holding period and custody before the first headline runs.
September 17, 2026 10:22 PM

Selling Bitcoin at a Loss and Buying It Straight Back: What That Does to Your Holding Period
Germany has no wash sale rule: the loss stays deductible even if you buy back immediately. The buyback, however, restarts the one-year period for every new unit.
September 16, 2026 7:12 PM

Borrowing Against Bitcoin Instead of Selling: When German Tax Still Applies
Posting Bitcoin as collateral for a loan is not a sale in Germany, because section 39 of the Fiscal Code keeps the coins attributed to you for tax purposes. Tax arises only when the collateral is liquidated, and then the one thing that decides the bill is how long you held the coins beforehand.
August 20, 2026 4:24 PM

Bitcoin Across Multiple Wallets: How Austria Works Out the Acquisition Cost
Bitcoin spread across several wallets? How Austria works out the acquisition cost and the rolling average price for tax purposes.
October 6, 2026 1:34 AM

93.56 million dollars out of the Zcash ETF in one week: what changes for ZEC holders in Europe
The Grayscale Zcash ETF lost money for the first time since launch in the week to October 5, 2026, a net $93.56 million. What the figure says about demand and what it means for ZEC holders in Europe.
More from CryptoTicker