
Is Aster a Good Buy at Current Prices?
As of November 11, 2026: Aster has fallen below both moving averages, while the warning mark from August still holds. We assess what chart, volume and supply now mean for buying at current prices.


Which topics should we dive deeper into?
Select what genuinely interests you. Your picks feed directly into our editorial planning.
Crypto news that's actually worth your time.
Weekly. 60 seconds. Carefully curated by our editors: no hype, no promo flood, no spam.
As of November 11, 2026: Aster with updated figures
Aster closed at $0.6378 on November 10, 2026, 8.6 percent below the $0.6976 on which the analysis below, dated August 29, 2026, is based. The figures in this section are daily closing prices from CoinGecko; cryptoticker.io calculated the moving averages and the RSI from them.
| Metric | November 10, 2026 |
|---|---|
| Closing price | $0.6378 |
| 50-day average | $0.6947 |
| 200-day average | $0.6943 |
| RSI (14 days) | 32.7 |
| Change over 30 days | −10.8% |
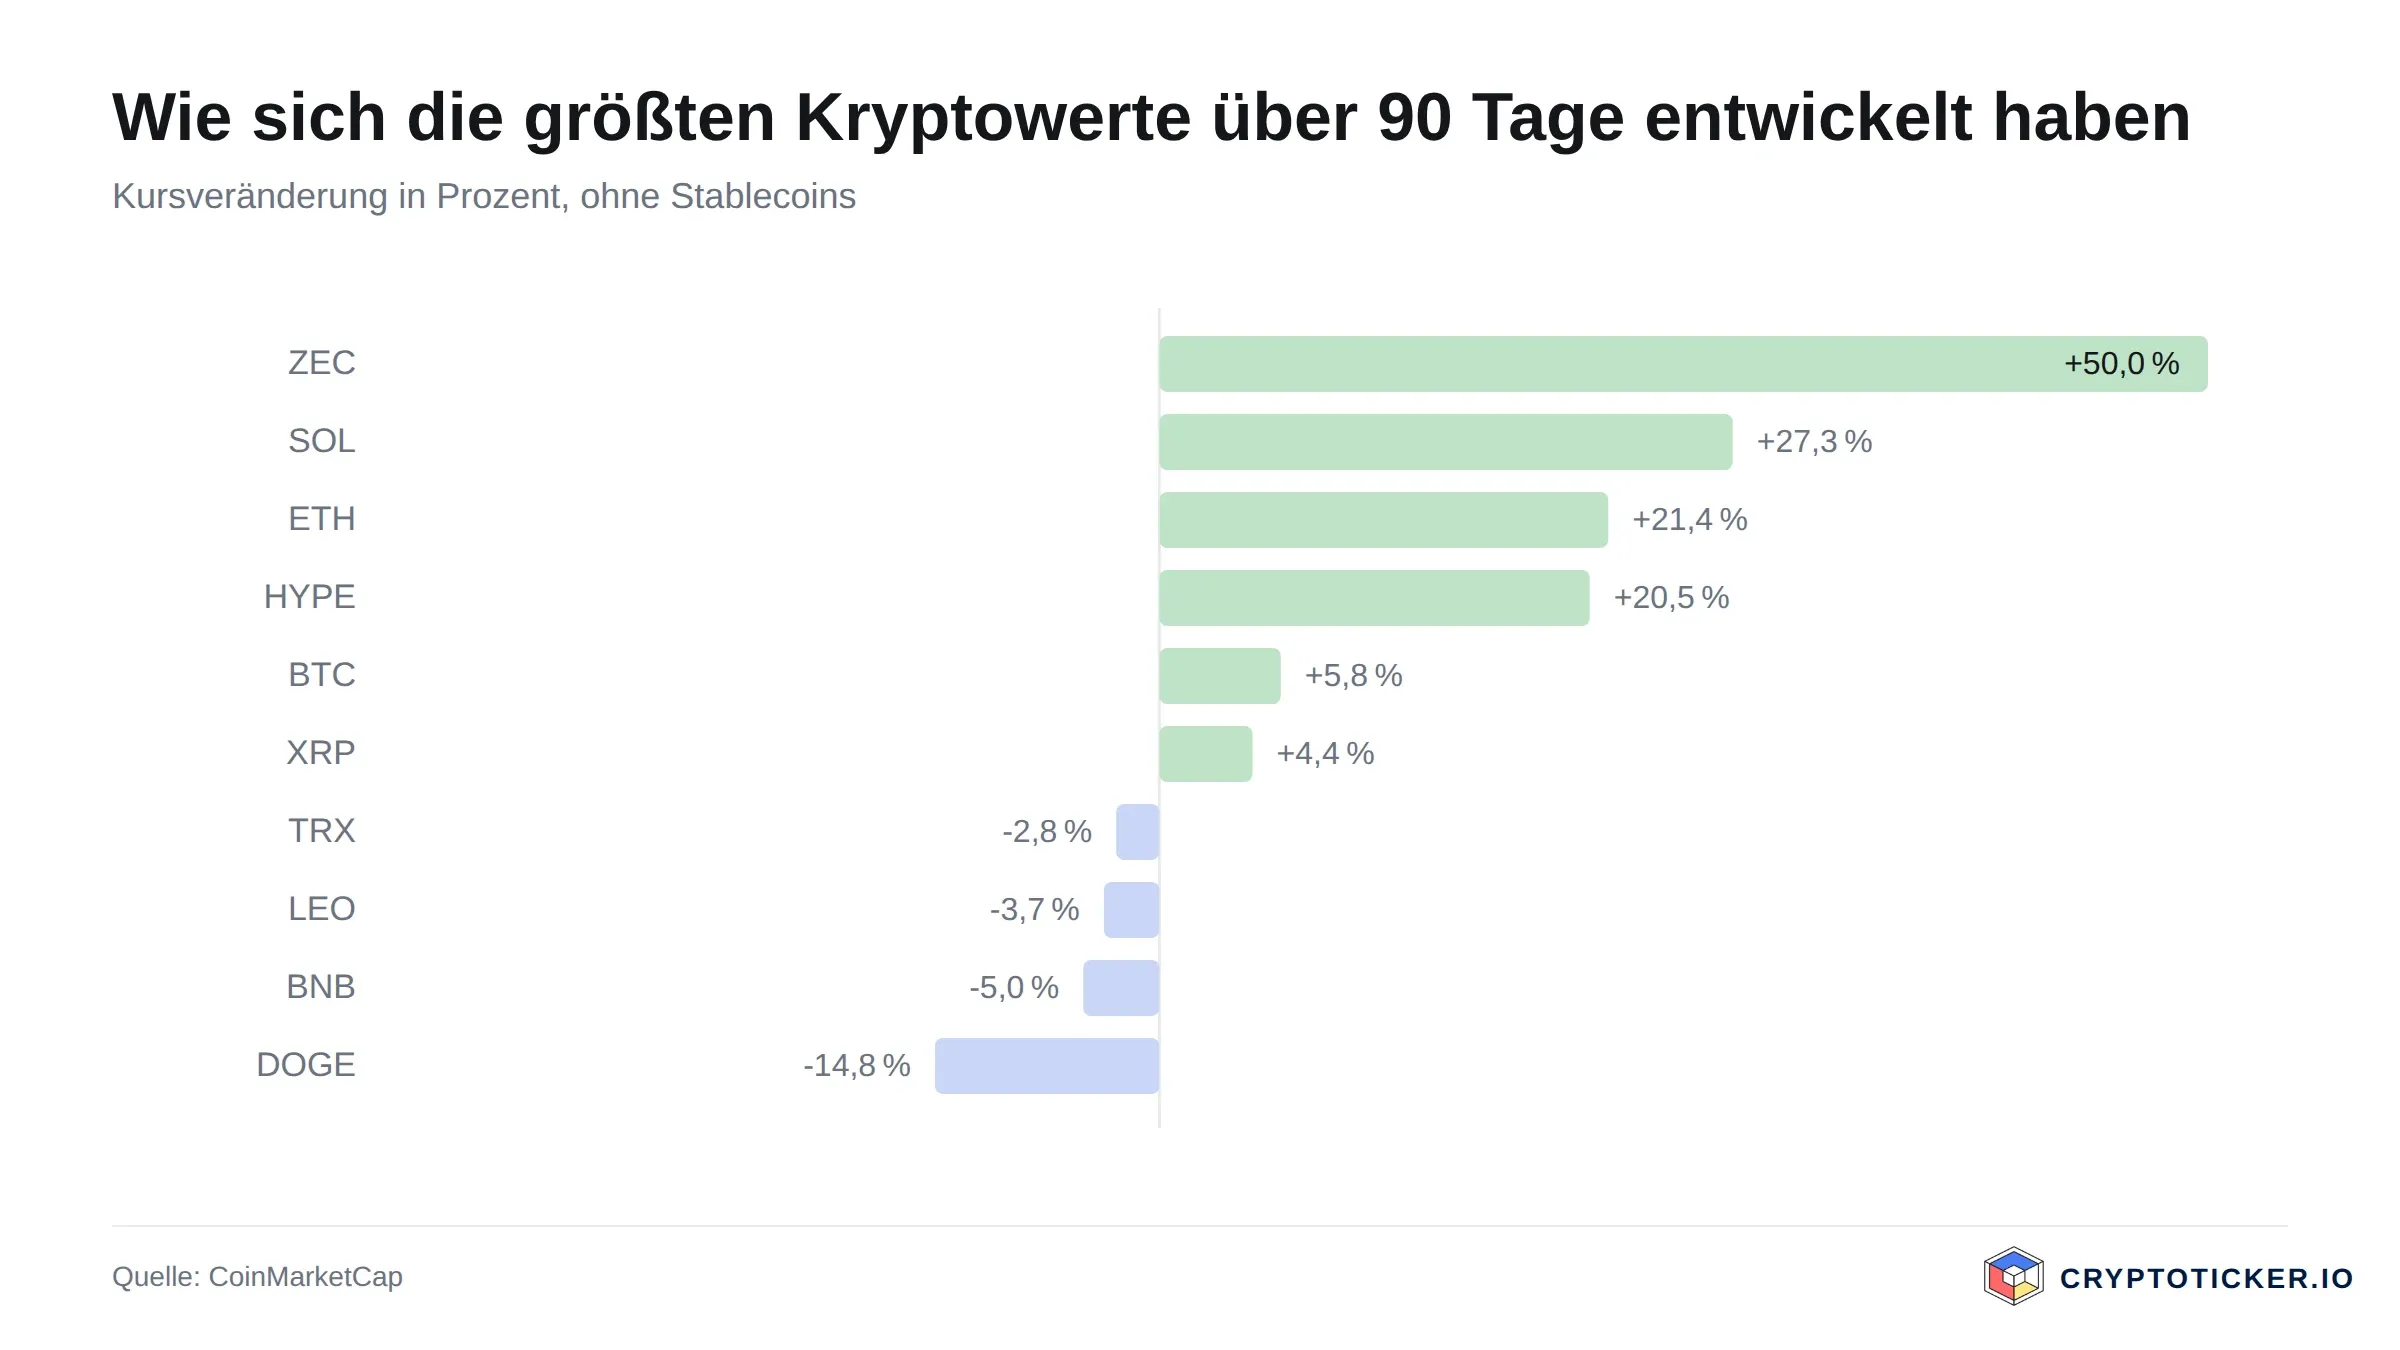
| Change over 90 days | +6.0% |
| Twelve-month high | $1.3777 (November 18, 2025) |
| Twelve-month low | $0.4686 (February 5, 2026) |
| Daily trading volume (30-day average) | $83 million |
That puts Aster 8.2 percent below its 50-day average and 8.1 percent below its 200-day average. The 14-day relative strength index stands at 32.7, just above the 30 mark at which a market is often considered oversold. Trading volume averaged around $83 million a day over the past 30 days, below the 90-day average of around $112 million.
The first warning mark of the August 29 analysis, $0.6257, has not been breached so far: the lowest daily close since then was $0.6355 on November 8. The price has, however, fallen below the 200-day average of $0.6608 at the time since November 8, and trading volume of around $83 million a day is below the 105.9 million US dollars cited back then. That meets two of the conditions under which the analysis said the positive reading would be invalidated. Both moving averages now sit almost level above the price; $0.6257 is where it will show whether the decline ends.
The sections below reflect the situation as of August 29, 2026.
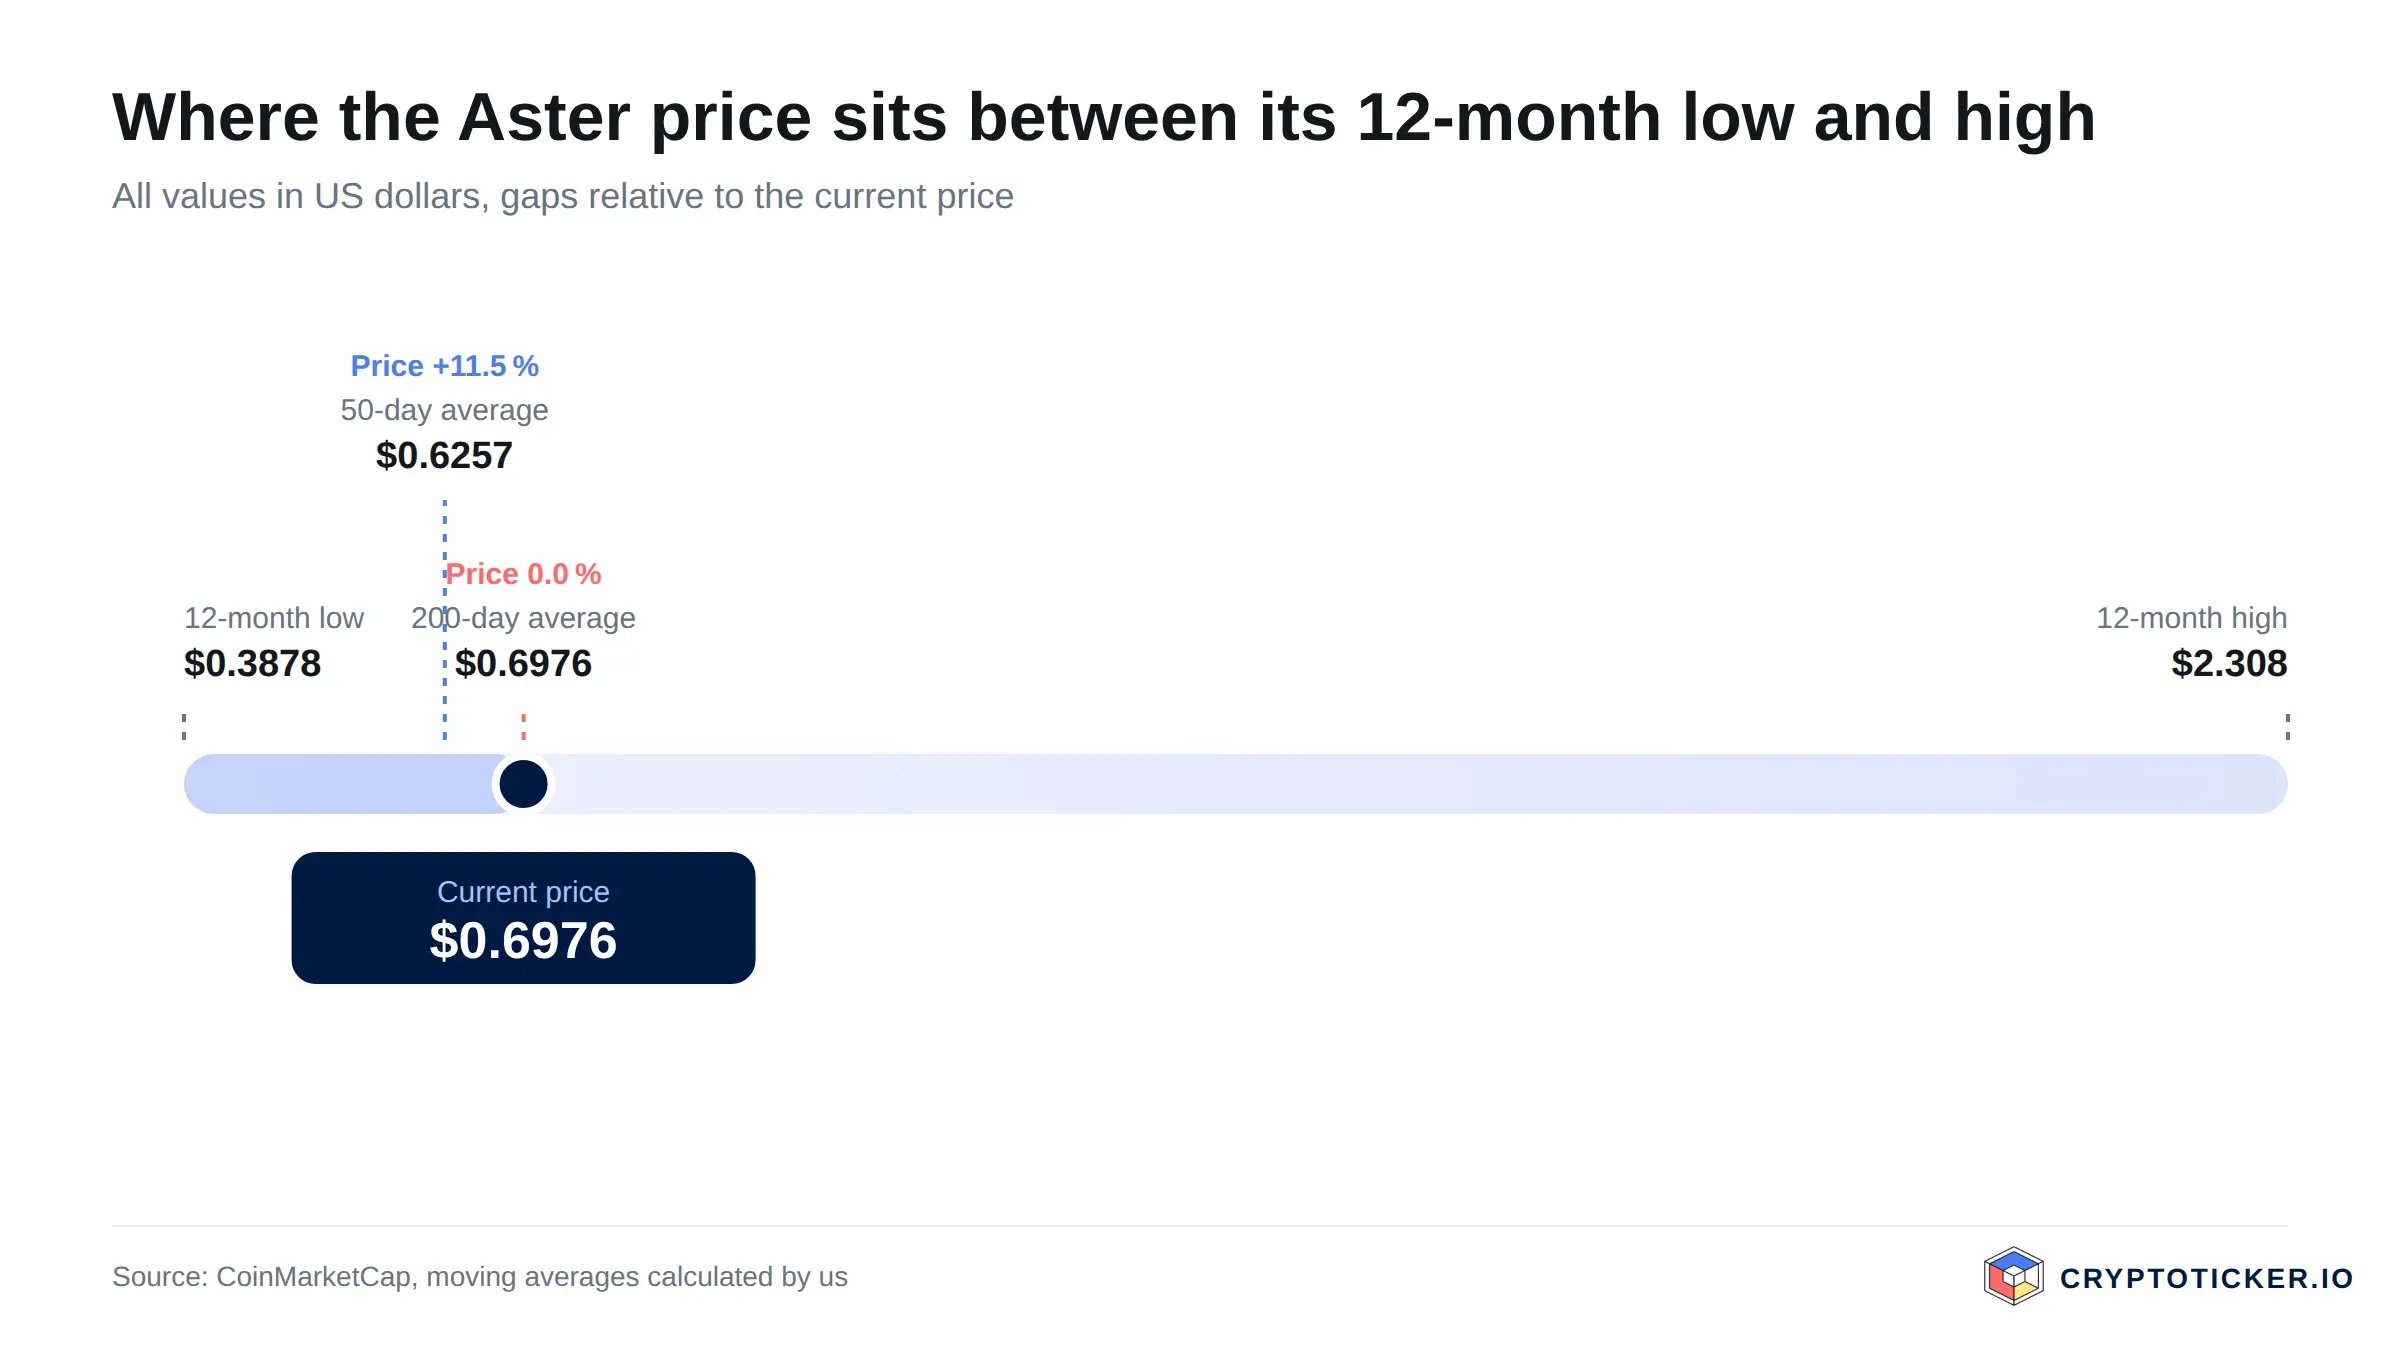
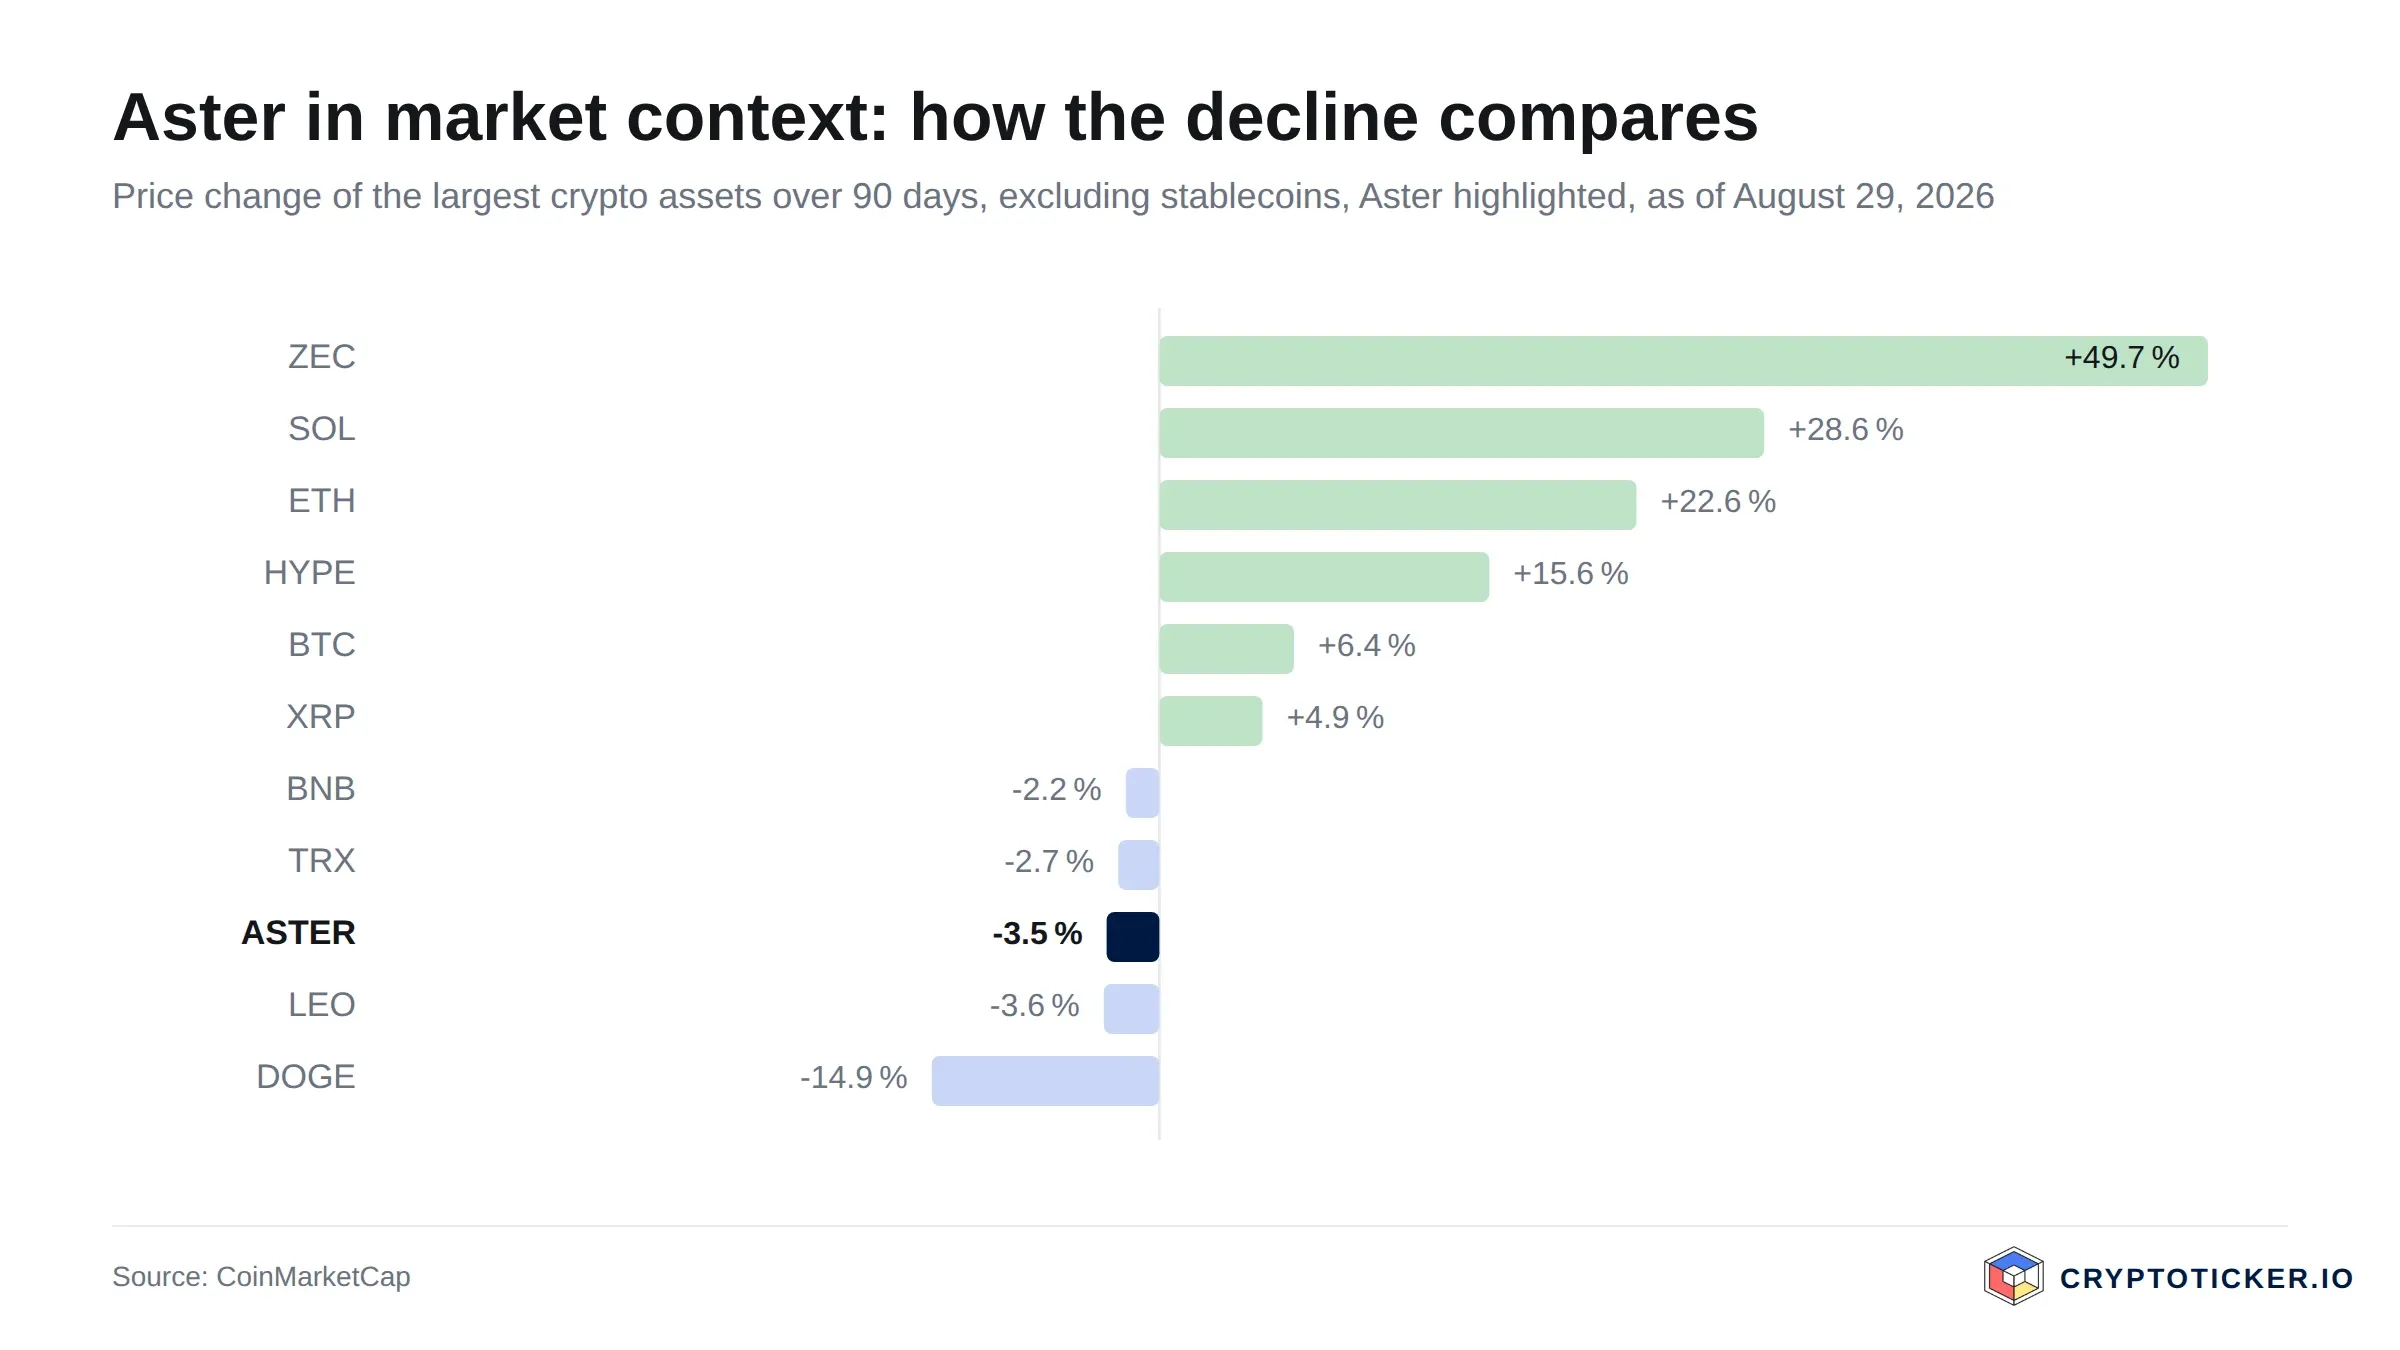
Aster costs $0.6976 on August 29, 2026. That leaves the token around 69.8 percent below its high of $2.3076, reached on September 25, 2025, a few days after its debut, and at the same time around 79.9 percent above its low of $0.3878 on September 18, 2025. Over 30 days it is up 16.2 percent; over 90 days it is down 5.4 percent. The token ranks 39th by market capitalisation, at $1.89 billion. The question here is not a forecast but an assessment: is Aster a good buy at the current price?
The price data was collected by cryptoticker.io on August 29, 2026. The source is market data from CoinMarketCap, retrieved via the numeric identifier 36341 rather than the ticker, because ticker symbols can be assigned more than once. The basis is daily closing prices and the standard industry formulas for moving averages and the relative strength index. One caveat belongs with that: the time series covers 345 daily closes from September 18, 2025. High and low are therefore values since the debut and not quite a full calendar year.
Aster Price Analysis: Where the Price Stands and Which Levels Count
The current price of $0.6976 sits above both moving averages. The 200-day average stands at $0.6608, the 50-day average at $0.6257. The price is therefore around 5.6 percent above the long line and 11.5 percent above the short one. That is the first solid observation: Aster no longer trades in the range the market has lately treated as a fair average, but above it.
The zone between $0.62 and $0.66 is thus the level at which it will be decided whether the recovery holds. A fall back below the 50-day average is not yet a break; a fall below the 200-day average would strip the recovery of its technical basis. On the upside the next hurdle is far away: the token covered the distance to the high of $2.3076 only in September 2025 and not since.
The movement of recent weeks has been quiet: up 0.1 percent over 24 hours, up 4.6 percent over seven days. For a token of this size that is an unremarkable week, and after a decline of almost 70 percent from the high, unremarkable is not bad news.
Is the Aster Downtrend Broken or Merely Interrupted?
It is worth looking closely here, because the two moving averages tell two different stories. The price sits above both, which argues for an intact recovery. The 50-day average of $0.6257 nevertheless remains below the 200-day average of $0.6608. The short line has therefore not yet crossed the long one from below. In the language of chart analysis, the signal a trend change usually leaves behind is missing.
The price has detached itself from the low and caught up with the averages, but the averages themselves have not yet confirmed the direction. That is the condition of an interruption rather than a completed trend change. Only once the 50-day average rises above the 200-day average would the recovery be structurally established.
The assumption in this section counts as refuted if the price falls back below $0.6257 and stays there for several weeks. The movement of recent months would then have been a counter-move within a downtrend and not a bottoming out.
What RSI and Moving Averages Mean for an Aster Entry
The relative strength index stands at 63.6, in the upper part of the neutral zone. Overbought would be a reading of 70 or more, oversold one below 30. Aster is therefore neither a bargain in the technical sense nor an overheated instrument. Anyone who was waiting to enter in oversold territory missed that moment over the past year.
In practice that means two things. The timing is technically unremarkable, and unremarkable moments suit staggered purchases better than a single large entry. And an RSI of 63.6 leaves room on the upside. An RSI is, however, a momentum indicator and not a valuation: it says how fast the price has moved, not whether the price is appropriate.
What Trading Volume Reveals About Demand for Aster
Over the past 24 hours, around $105.9 million worth of Aster changed hands. Measured against a market capitalisation of $1.89 billion, that is a turnover of around 5.6 percent a day, and it is the most important difference from many another token of this size.
Why that counts: a thinly traded token can be bought at any given price but not necessarily sold at any given price. Where daily turnover runs in fractions of a percent, even a medium-sized order moves the price against its own instruction. At 5.6 percent that problem is effectively absent for private order sizes. Tradability therefore belongs among the solid arguments in favour of Aster.
Advertisement: Crypto futures trading: Bitget offers leverage of up to 100x. Leverage can lead to high losses. Our exchange comparison shows more platforms.
Which Structural Factors Argue in Favour of Aster
Aster is the token of a decentralised derivatives exchange, that is, a trading venue for perpetual futures contracts without a central custodian. This segment has a directly comprehensible source of income: trading fees. Unlike tokens whose value rests solely on the expectation of future use, here an activity can be measured that is taking place today. Anyone wanting to compare the segment will find the platforms side by side in the comparison of the best perp DEXs.
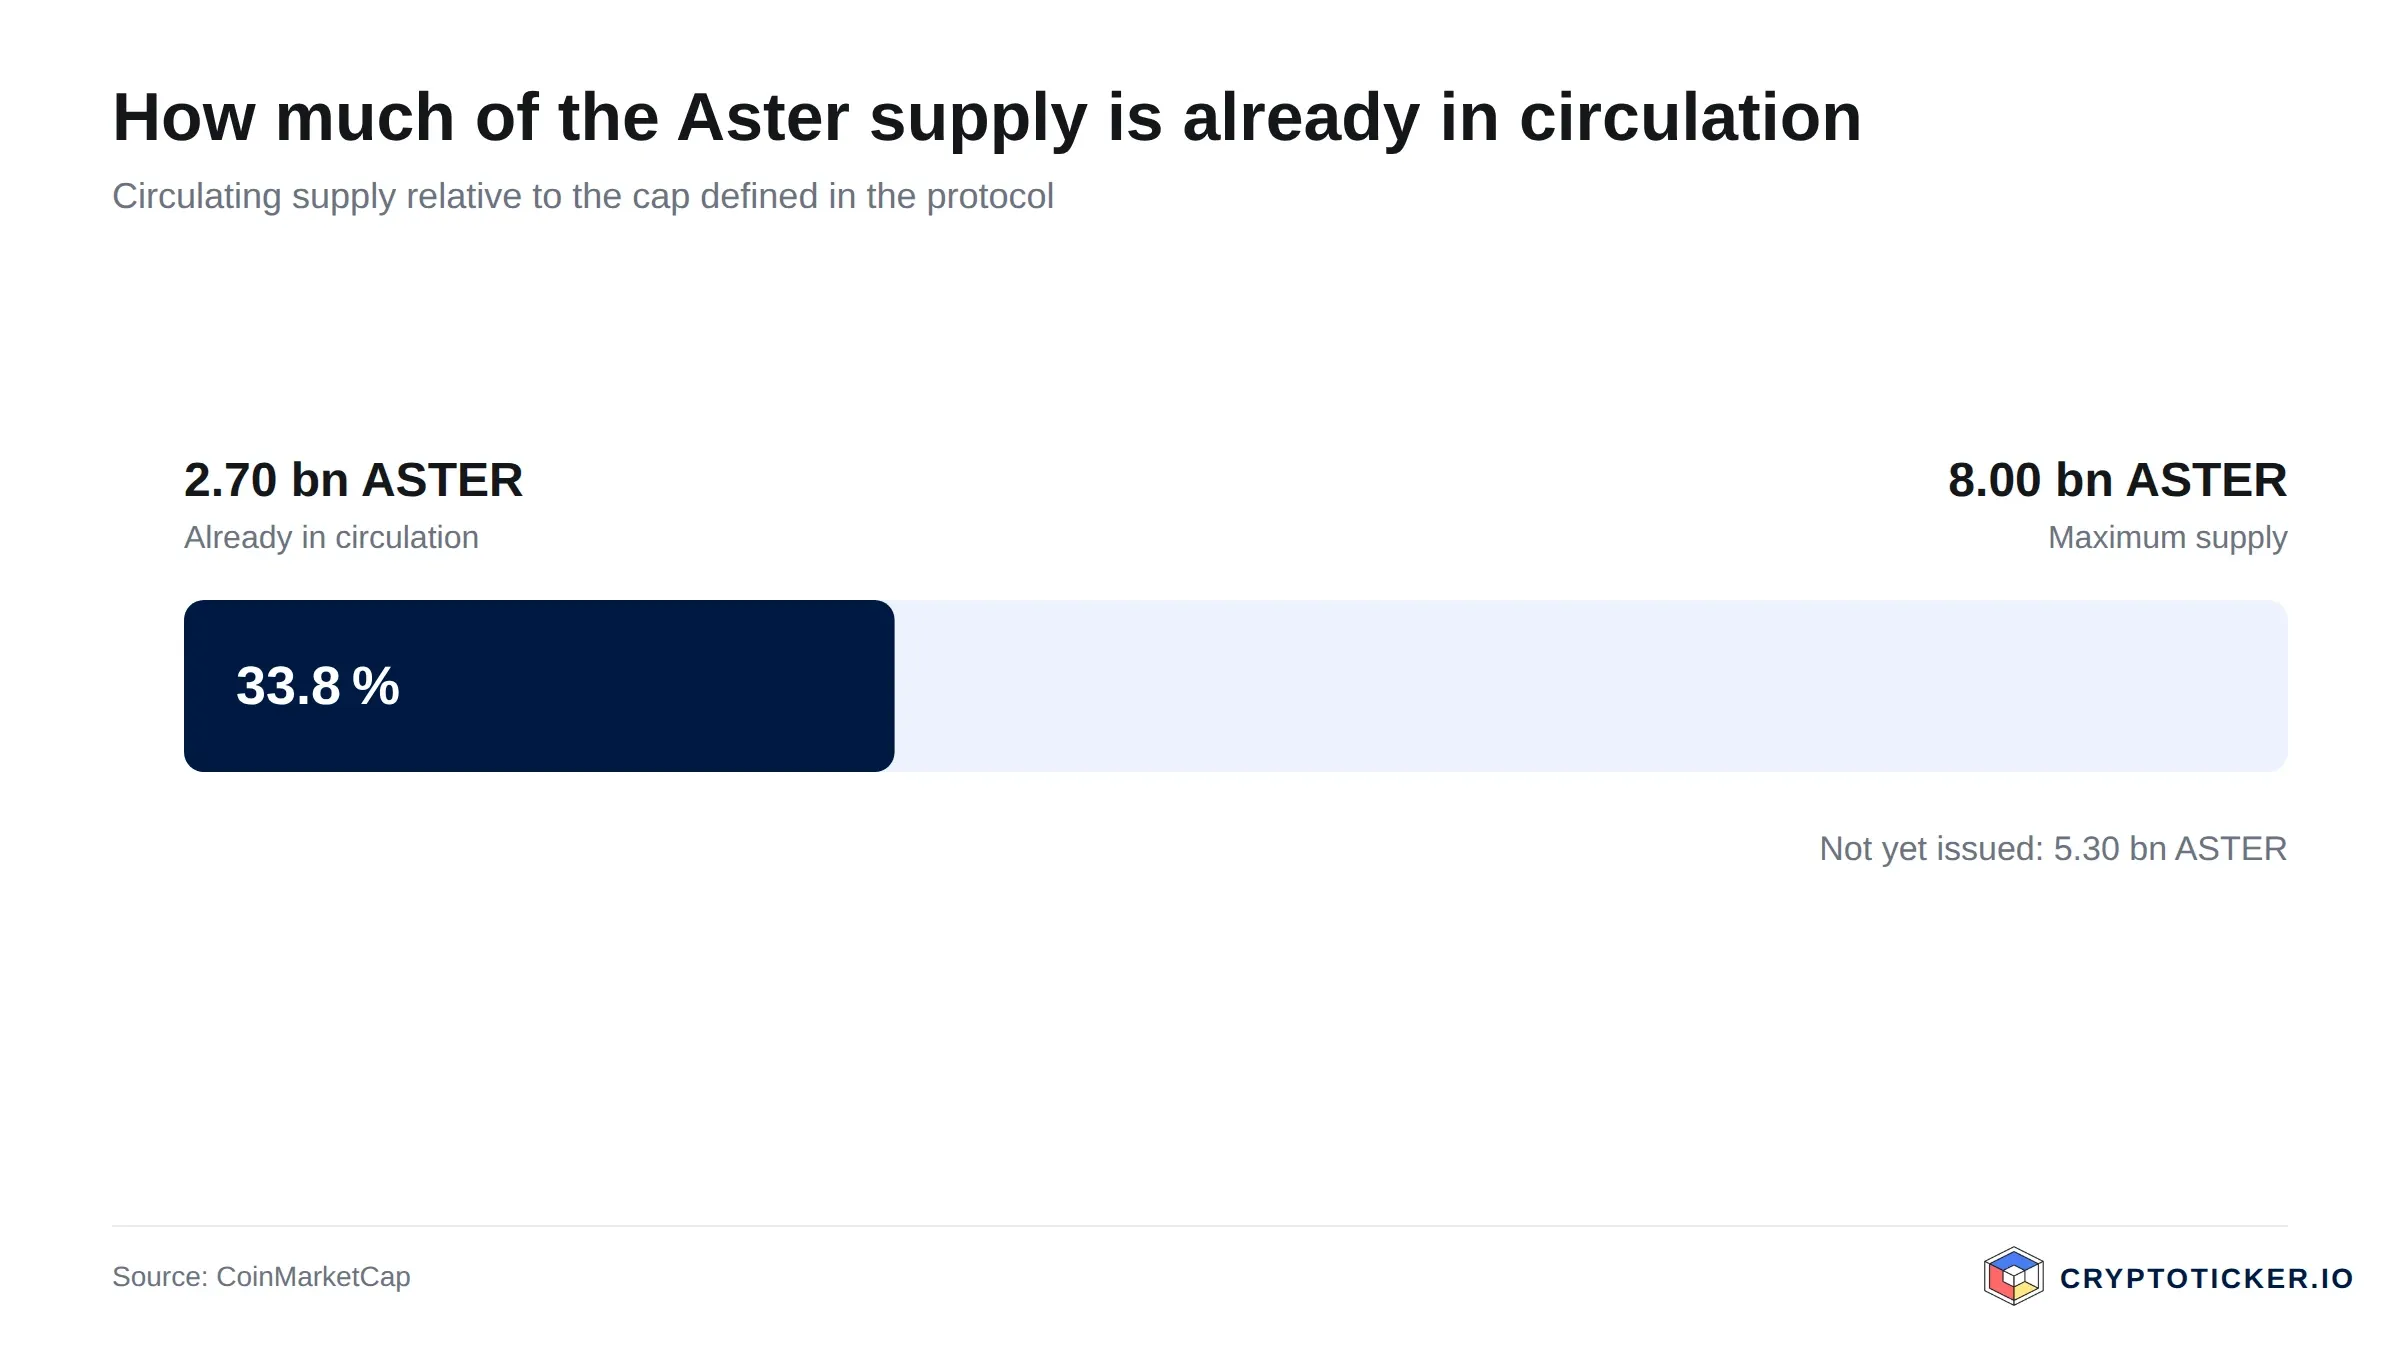
The second point is the supply mechanics, and that one cuts both ways. Around 2.70 billion tokens are in circulation against a hard cap of 8 billion, or 33.8 percent. The hard cap is a positive: there is a defined final quantity. The flip side follows in the next section.
The third point is the regulatory position. In the European Union, the MiCA regulation provides a uniform legal framework for crypto assets, whose technical standards the European securities regulator ESMA publishes on an ongoing basis. Trading through regulated providers is thus more clearly governed than it was two years ago, and the counterparty risk of an exchange is easier to assess. MiCA has no influence on the valuation of the token itself; the regulation governs the providers, not the price outlook.
What Argues For Buying Aster at the Current Price
- The price sits above both moving averages. At $0.6976, Aster is above the 200-day average of $0.6608 and the 50-day average of $0.6257. The 16.2 percent gain over 30 days expresses that movement.
- Tradability is good. Daily turnover of 5.6 percent of market capitalisation means positions can be unwound again at predictable prices. Among tokens outside the top twenty that is not a given.
- The distance from the high is large. Around 69.8 percent below $2.3076 is a price that no longer contains the euphoria of the debut. That is expressly not an argument that the old peak will be reached again.
What Argues Against Buying Aster at the Current Price
- Two thirds of the supply is still outstanding. Of 8 billion tokens, 2.70 billion are in circulation; the remaining 5.30 billion or so will reach the market step by step under the release schedules. Every release increases supply without demand automatically growing with it. This is the weightiest objection, and it applies regardless of how the platform develops.
- The time series is short. 345 daily closes do not cover a full market cycle. How the token behaves in a longer downward phase has not been observed. Any statement about it is a supposition, including the ones in this article.
- The trend change is not technically confirmed. The 50-day average remains below the 200-day average. The decentralised derivatives exchange segment is also fiercely contested; a competitor with better terms can pull trading volume away quickly, and trading volume is the basis of income in this business model. For comparison, it is worth looking at Hyperliquid at its current price.
How to Buy Aster at the Current Price
The purchase runs through a crypto exchange. Which platforms list the token changes; check availability before buying rather than assuming it. An overview of fees, deposit routes and regulatory status is provided by the comparison of the best crypto exchanges; anyone who values European supervision will find the relevant providers in the comparison of regulated crypto exchanges.
On costs, three items should be kept apart: the trading fee, the spread between buying and selling price, and the withdrawal fee if you later move the token to your own wallet. With smaller tokens the spread weighs more heavily than the stated fee and rarely appears in the price list. How the providers work in detail is set out in the reviews of Bitvavo, Kraken and Bitpanda.
On custody: anyone holding larger amounts does not leave them on the exchange permanently. The basic idea of self-custody is as old as the Bitcoin whitepaper and comes down to the point that only the holder of the private key can dispose of the funds. Which devices are suitable is shown by the hardware wallet comparison. Anyone intending to hold for years should not depend on the survival of a single trading platform.
 Compare MiCA-regulated crypto exchanges
So Is Aster a Good Buy at the Current Price?
Update of November 11, 2026: this assessment reflects the situation as of August 29, 2026. The $0.6257 warning mark is holding so far, but Aster has dropped back below the 200-day average of $0.6608 at the time since November 8. The current assessment is in the section “As of November 11, 2026” at the top of the article.
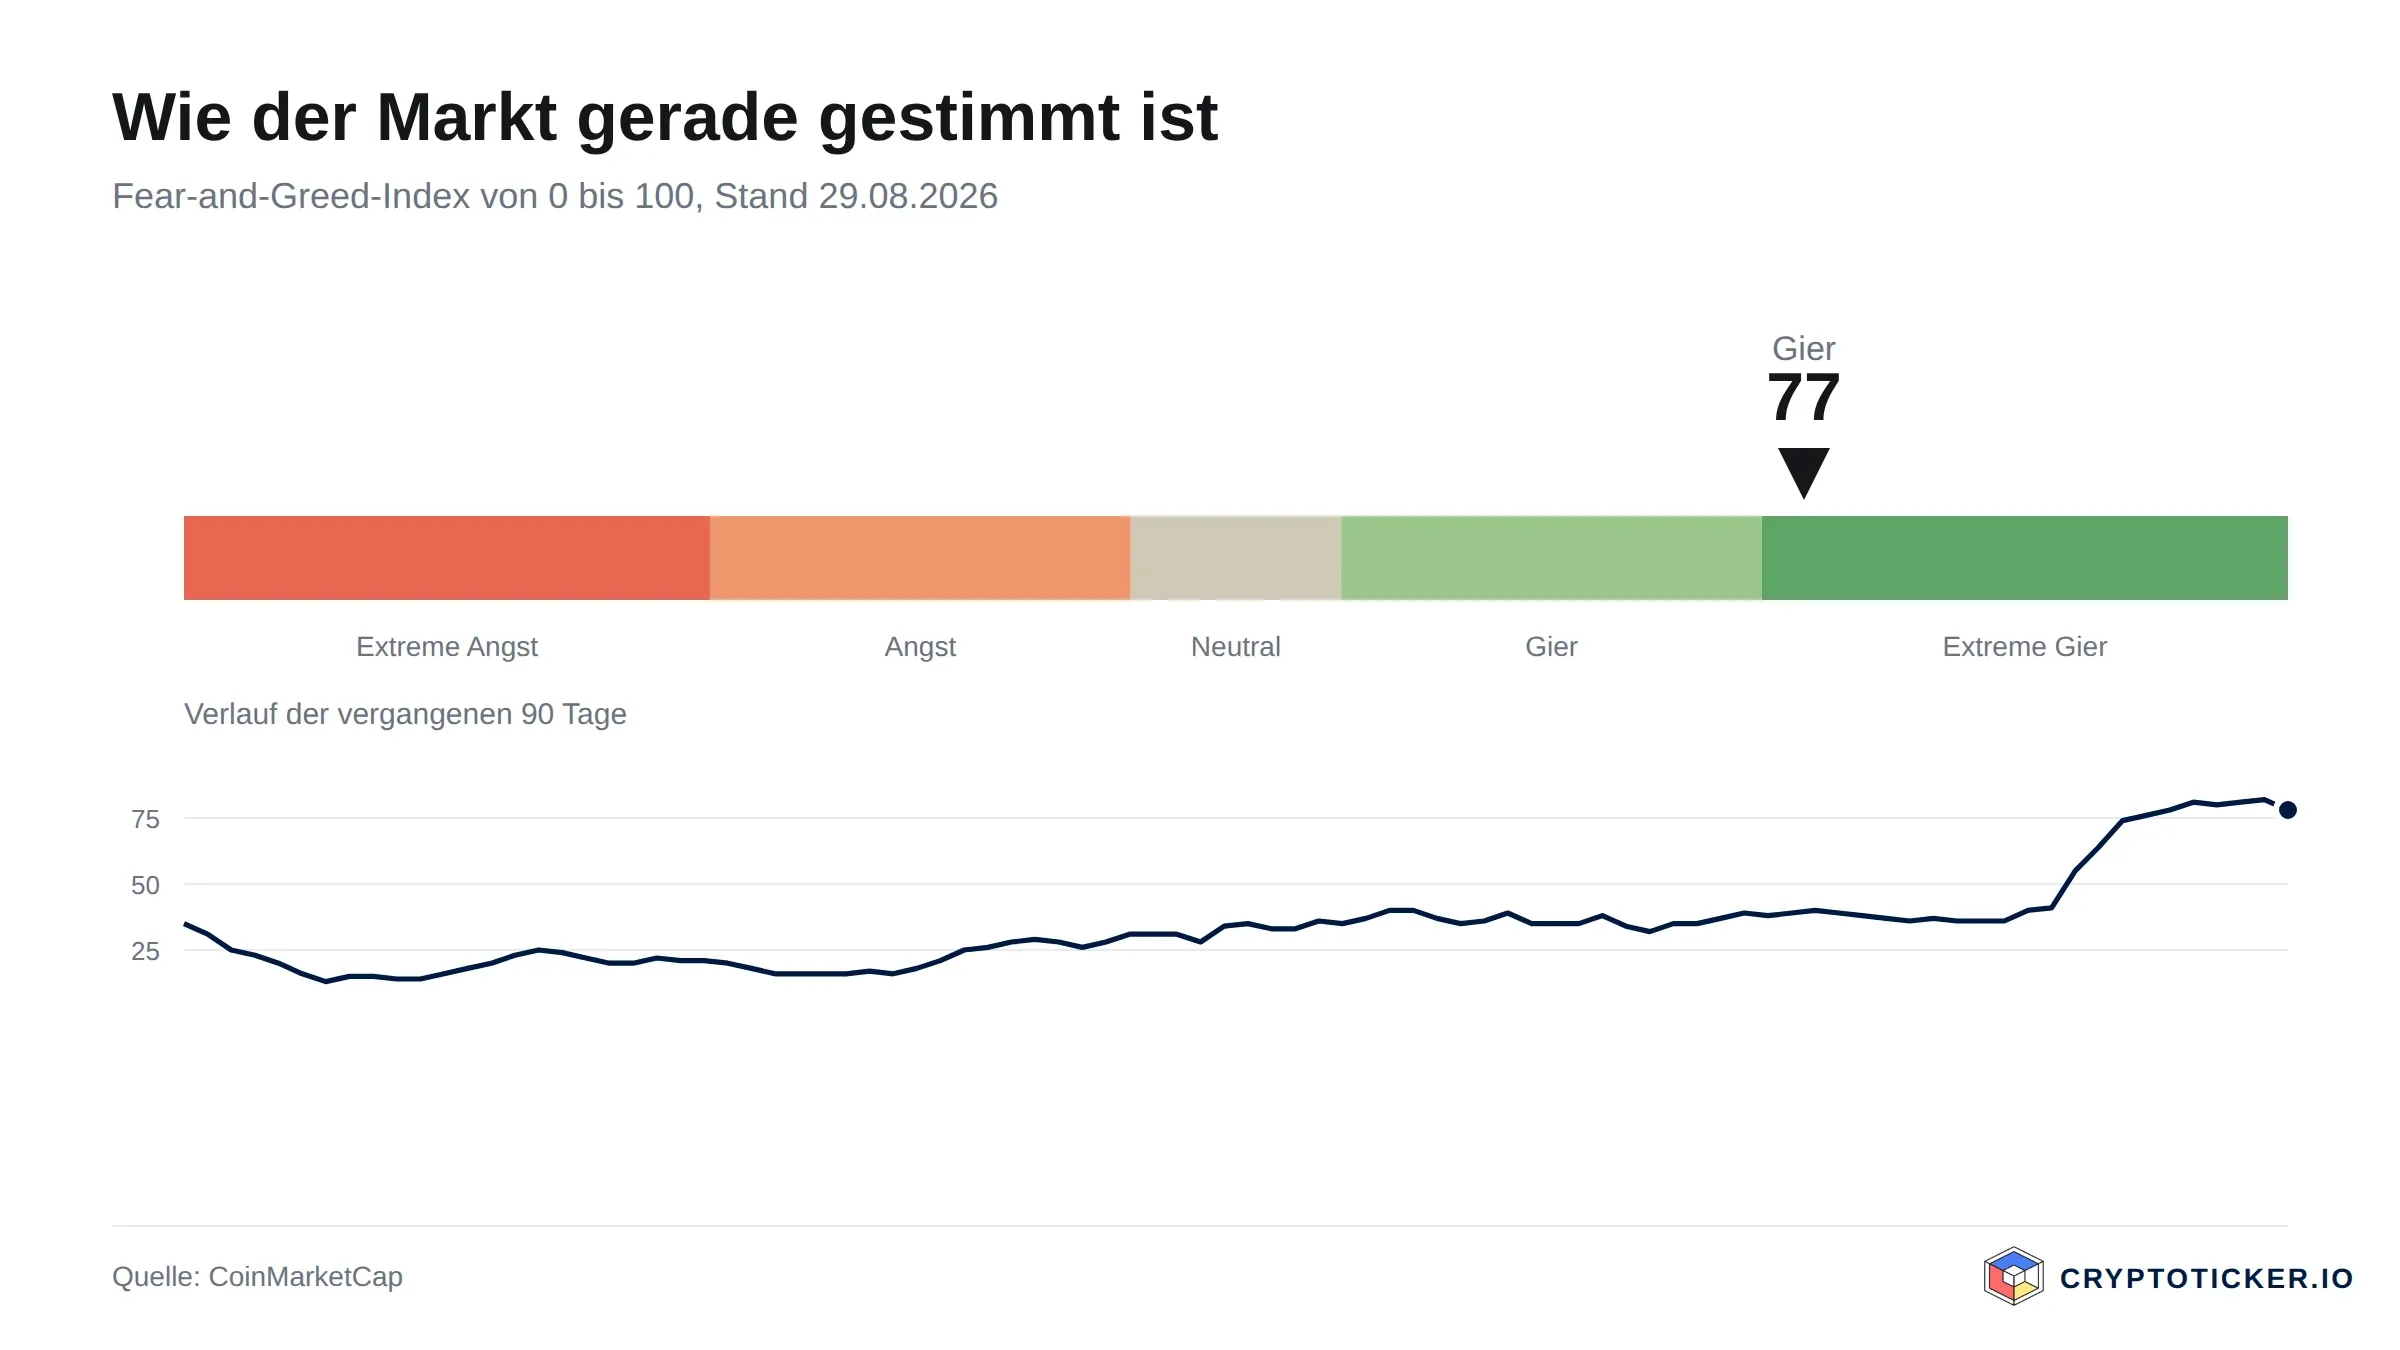
In the short term, over a horizon of weeks, the finding is neutral to mildly friendly: the price sits above both averages, the RSI of 63.6 leaves room on the upside, and tradability is good. Against that stands the fact that the 50-day average has not yet crossed the long line and that market sentiment, with a Fear and Greed reading of 76, sits in greed territory. High greed is not a sell signal, but it is an indication that a good deal of confidence is priced in. A fall back below $0.6257 would be the first sign that the short-term assumption does not hold.
In the long term, over a horizon of years, everything hangs on one question: can the platform hold enough trading volume to absorb the outstanding 5.30 billion tokens without the price giving way under the growing supply? Anyone answering yes is buying today at around 70 percent below the high. Anyone answering no is buying into a scheduled expansion of supply. The price data does not answer it; it only shows that the market currently prefers the friendlier reading.
The friendly reading counts as refuted if the price falls below the 200-day average of $0.6608 while the circulating supply rises and trading volume drops well below the current $105.9 million a day. It counts as confirmed if the 50-day average rises above the 200-day average and volume does not fall in the process.
Buying Aster: What to Take Away
- The position is a recovery without confirmation. Price $0.6976, 200-day average $0.6608, 50-day average $0.6257, RSI 63.6: above both lines, but without the crossover that would evidence a trend change. For comparison it is worth looking at Ethereum at its current price.
- Supply is the decisive reservation. 2.70 of 8 billion tokens are in circulation. Anyone buying Aster is buying a position whose circulating supply can still triple as scheduled. That belongs in every position size, unlike assets with largely issued supply such as Bitcoin at its current price.
- Tradability argues for a staggered approach. At $105.9 million of daily turnover, partial purchases spread over several weeks are possible without appreciable price impact. At a price 69.8 percent below the high and 79.9 percent above the low, that is the more sober choice than a single entry point. Which exchange suits is settled by the perp DEX comparison.
Disclosure: some of the providers named in this article work with us through partner programmes. This has no influence on the price analysis or on the assessment of the chart position; the price data comes from a public market data source and can be verified there.
(As of November 11, 2026; analysis as of August 29, 2026. This article is not investment advice. Prices and fee structures change; check the terms with the provider before you buy. Crypto assets are subject to sharp price swings, and a total loss is possible.)
Partner links: some links on this page are partner links. If you become a customer through one of them, we may earn a commission at no extra cost to you. Selection, ratings and ranking are decided independently by our editorial team. Ethics and Independence · Ownership and Funding
Transparency note: This article was produced with the assistance of artificial intelligence. Figures and claims are based on the primary sources linked in the text. The feature image was generated with AI.
For later? Save this article and find it again in your profile.
Related articles
- RAIN price jumps 75 percent on just $20.5 million in daily volume
- What is Render Coin? The GPU network burned $834,000 worth of tokens in October
- Will Bitcoin Go Back Up? Three Scenarios to Year-End: $70,000, $80,000 or $100,000
- Stellar Price Below the 200-Day Line: What Counts After 29% Down in 30 Days
- Uniswap Price Drops 10.7%: Why UNI Falls Harder Than Bitcoin
Which topics should we dive deeper into?
Select what genuinely interests you. Your picks feed directly into our editorial planning.
Crypto news that's actually worth your time.
Weekly. 60 seconds. Carefully curated by our editors: no hype, no promo flood, no spam.

November 5, 2026 6:48 PM

Sui Price Drops 9.5% in a Day: The Levels SUI Must Hold Now
Sui lost 9.5% in 24 hours and 29% in 30 days as the Nasdaq rout hit crypto. The levels that count now, what could turn the picture and how to hedge.
November 5, 2026 6:36 PM

Litecoin Price: Down 26% in 30 Days, Now the 200-Day Line Decides
Litecoin lost 7.9% in 24 hours and 26% in 30 days as the Nasdaq rout hit crypto. The levels that count now, what could turn the picture and how to hedge.
November 5, 2026 5:36 PM

Bitcoin Crash: Why BTC Fell to $75,568, How Low It Could Go and How to Hedge
Bitcoin (BTC) lost more than $5,000 in under a day as a Nasdaq chip rout wiped out leveraged longs. The reasons, the levels that count now, what 23 earlier 5 percent days show, and how to earn and hedge in this market.

November 3, 2026 9:29 AM

Solana Price Below $95: Record ETF Outflows and Whale Selling Push SOL to a 7-Month Low
Solana price drops under $95 after a record $71 million ETF outflow and whale dumping. SOL is 19% down in a month. Is $78 the next stop?
November 3, 2026 8:59 AM

Ethereum Price Below $2,300: Is $2,000 Next or Is This the Bottom?
Ethereum price slips toward $2,250 as $3 billion leaves DeFi. Whales are buying the dip. Does ETH hold $2,200 or test $2,000 next?

November 2, 2026 5:44 PM

Lighter (LIT) plans CFTC licence filing in November, token trades at $3.13
Lighter plans to apply to the US regulator CFTC in November for registration as a trading venue and clearing house; LIT costs $3.13. Until then, what matters for holders is $4.1 million in buybacks in October and the start of vesting on December 27.
October 27, 2026 11:25 PM

Is Arbitrum a Good Buy at Current Prices?
As of 18 November 2026: Arbitrum has slipped below its 200-day average on a weekly close, the condition under which our October analysis called the short-term case wrong. We check with our own price data what that means for buyers.
October 27, 2026 7:27 AM

Is Venice Token a Good Buy at Current Prices?
Venice Token has multiplied within twelve months and has been correcting since its September high. We check the chart, the supply and the risks of VVV against the question of whether the token is a good buy at the current price.
October 26, 2026 11:22 PM

Is Sky a Good Buy at Current Prices?
As of 17 November 2026: Sky has fallen below its 200-day average and below the summer zone around $0.06, and the October recovery counts as refuted. We check with our own price data what that means for buying at current prices.
October 21, 2026 12:33 AM

Is Worldcoin a Good Buy at Current Prices?
As of November 11, 2026: Worldcoin has fallen below both moving averages and the marks of the October analysis, while the twelve-month low holds. What chart, supply and World ID now mean for buying WLD.
October 18, 2026 1:17 AM

Aster (ASTER) and the claim window from October 28: what changes for holders
On October 28 at 12:00 UTC the claim window opens for Aster's fully vested Stage 6 allocation, and it stays open until November 28. The price stands at $0.70, and two thirds of total supply are not yet in circulation.

October 15, 2026 7:29 AM

17 of 20 top coins down, Ethereum at $2,380: where the sell-off is measured
Ether loses 5.41 percent over 24 hours and falls to a daily low of $2,332.43. Our own count of the 25 largest cryptocurrencies shows how broadly the sell-off really carries.
October 12, 2026 10:27 AM

Is Bitcoin Still a Good Investment in October 2026?
Spot ETFs have changed who sets the Bitcoin price, and the easy repricing is behind us. What still supports BTC, what could break it, and how much belongs in a portfolio today.
October 9, 2026 1:06 PM

Ethereum Price Under $2,500: Is ETH a Good Buy Right Now?
Ethereum has slipped below $2,500 and the question in every chat group is the same: buy the dip, or stay out? Here is what is driving the price, what the near-term levels are, and what the long-term forecasts actually assume.
September 28, 2026 9:47 AM
XRP Price Drops Below $1.50: Where Is Ripple Heading This Week?
XRP price slips under $1.50 after a red weekend. Here is the XRP price analysis with the higher and lower targets that matter this week.
September 28, 2026 4:28 AM

Is Quant a Good Buy at the Current Price?
As of 13 November 2026: Quant has broken below its October low of 182 dollars and trades below its 50-day average, but well above its 200-day line. We check with our own price data what that means for buying at the current price.
September 21, 2026 4:24 PM

Jupiter Rises: Money Is Rotating Back Into Solana DeFi
Solana gains 7.6 percent, the trading aggregator Jupiter 13 percent. When applications rise faster than the chain, capital is looking for leverage inside the ecosystem. What sits behind it and where the risk lies.
September 19, 2026 4:20 PM

Is Ondo a Good Buy at the Current Price?
As of November 11, 2026: Ondo has fallen below its 200-day line while volume stays above the annual median. We assess chart, trading volume and supply mechanics for buying at the current price.
September 18, 2026 10:20 PM

Hyperliquid at a Record High: What Is Behind the HYPE Jump Above $90 and What to Check Before Buying
HYPE, the token of the trading platform Hyperliquid, has set a new all-time high at $92.56. The trigger is a new lending function. What is behind it, what risks the rise brings and what you should check from Germany before buying.
August 27, 2026 4:31 AM

Is AAVE a Good Buy at Current Prices?
As of November 11, 2026: AAVE has slipped below its 50-day and just below its 200-day average, while the August mark still holds. We check with our own price data what that means for buying at current prices.
August 27, 2026 3:24 AM

Is Hedera a Good Buy at Current Prices?
As of 14 November 2026: by our yardstick Hedera's bottoming has failed, and it is closing at its lowest level in twelve months. We check with our own price data what that means for buying at the current price.
August 27, 2026 2:21 AM

Is SUI a Good Buy at Current Prices?
SUI is holding its 200-day moving average and trades 51 percent above its twelve-month low, with the 50-day line now above the 200-day. We check whether the coin is a good buy at current prices.
August 24, 2026 12:50 AM

Is Bitcoin Cash a Good Buy at Current Prices?
Bitcoin Cash has held its summer gains but the rally has stalled: the price now sits right on its 50-day line with the RSI back to neutral and turnover halved. We work through what speaks for and against buying BCH at current prices.
August 24, 2026 12:34 AM

Is Monero a Good Buy at Current Prices?
As of 15 November 2026: Monero has fallen below its October low and just below the 200-day average, and the October breakout has not held. We check with our own price data what that means for buying at current prices.
August 24, 2026 12:19 AM

Is Zcash a Good Buy at Current Prices?
Zcash has given back part of its September advance and now sits just above its 50-day average. We look at what the trend, the RSI and the turnover actually support, and under which conditions the case for buying ZEC breaks down.


More from CryptoTicker