
Stellar Price Below the 200-Day Line: What Counts After 29% Down in 30 Days
Stellar lost 8.5% in 24 hours and 29% in 30 days as the Nasdaq rout hit crypto. The levels that count now, what could turn the picture and how to hedge.


Which topics should we dive deeper into?
Select what genuinely interests you. Your picks feed directly into our editorial planning.
Crypto news that's actually worth your time.
Weekly. 60 seconds. Carefully curated by our editors: no hype, no promo flood, no spam.
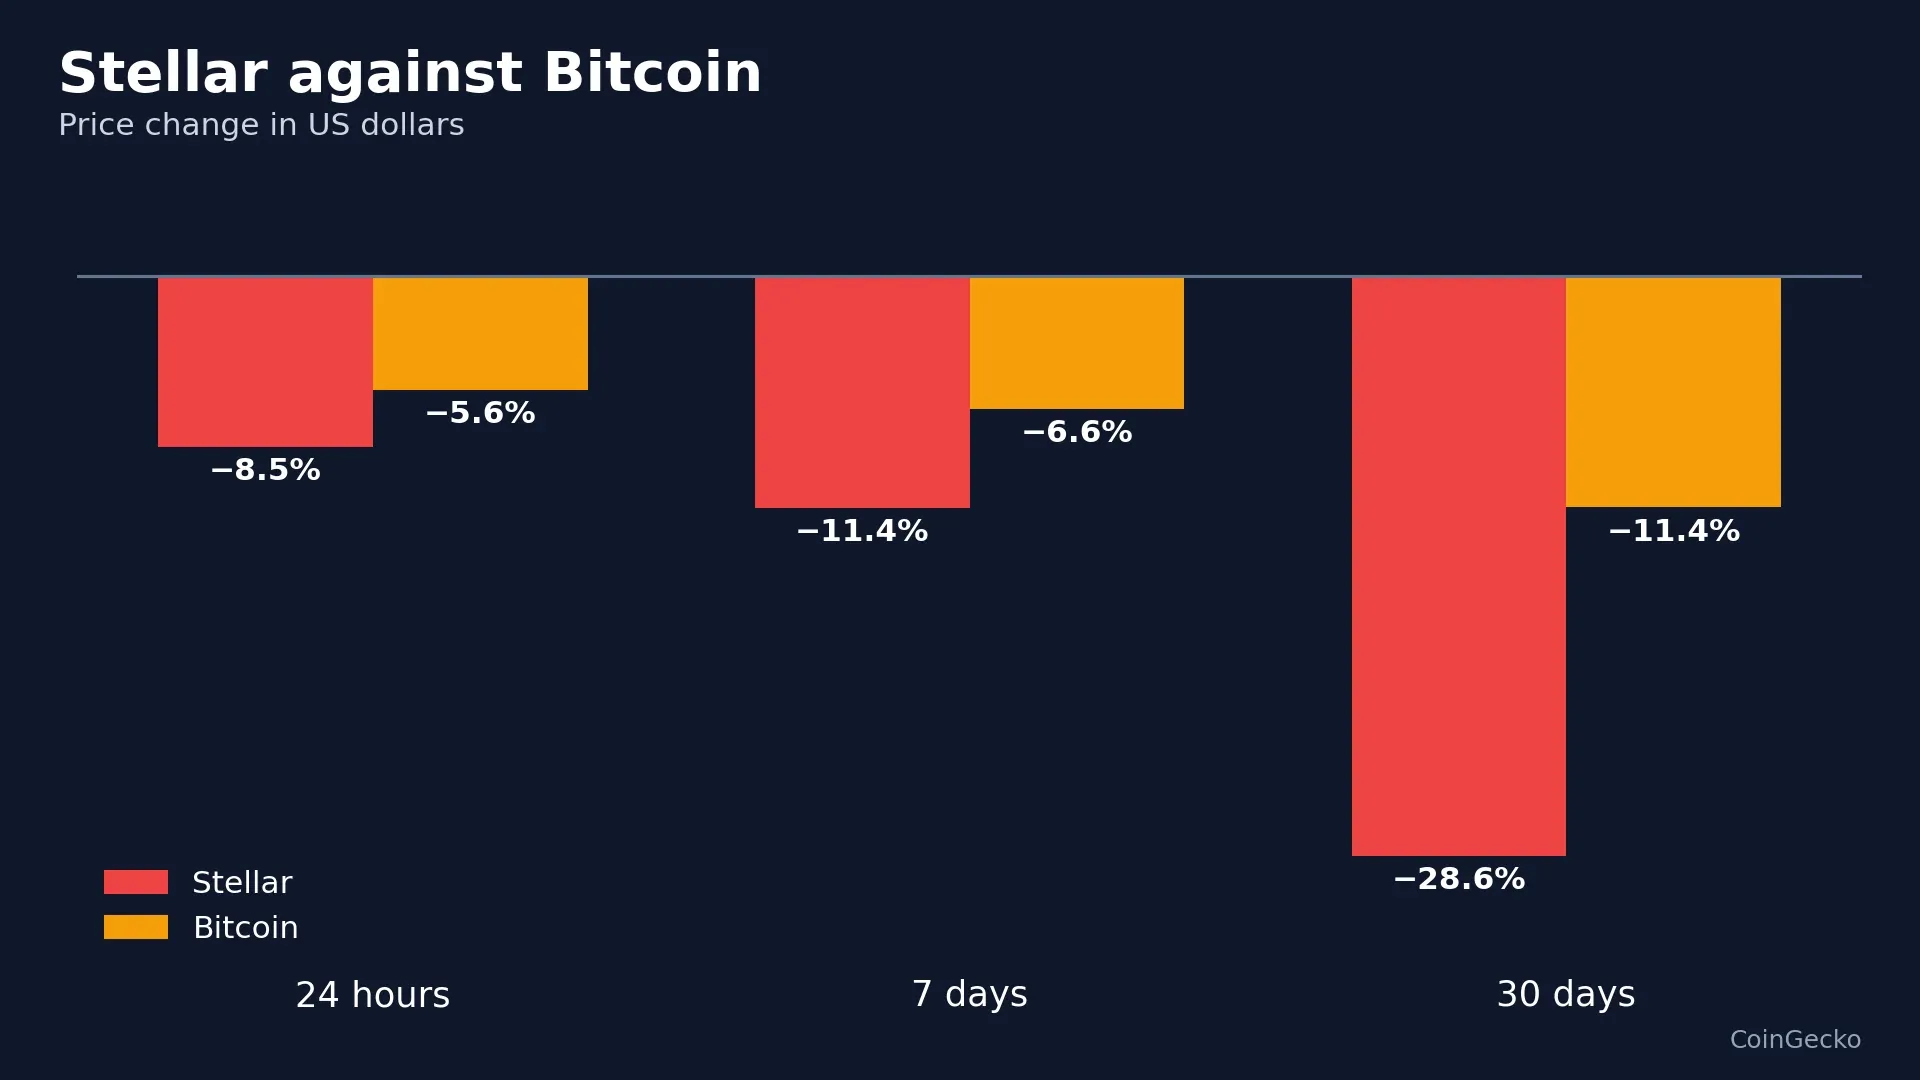
Stellar traded at $0.153 at 18:23 UTC, down 8.5% in 24 hours, 11.4% in seven days and 29% in 30 days (CoinGecko). Bitcoin lost 5.6% over the same 24 hours. The trigger came from outside: a Nasdaq chip rout that hit every large coin.
The full background is in our piece on the Bitcoin crash. Here is what it means for XLM: which levels count, what could change the picture and how to hedge.
Why Is Stellar Down? It Follows Bitcoin
We found no Stellar-specific trigger for Thursday's drop. The daily returns of XLM and Bitcoin over the past 30 days have a correlation of 0.84 by our calculation from Binance data, so XLM mostly follows the market. Liquidations of leveraged longs across crypto added pressure. For the project itself, recent news includes the Protocol 30 vote on Stellar.
The next date for the network is November 23, when validators are scheduled to vote on activating Protocol 30, called Bell, on the mainnet; the date can still move. Holders need no migration, and old addresses stay valid.
 Regulated crypto exchanges compared
Stellar Price: The Levels That Count Now
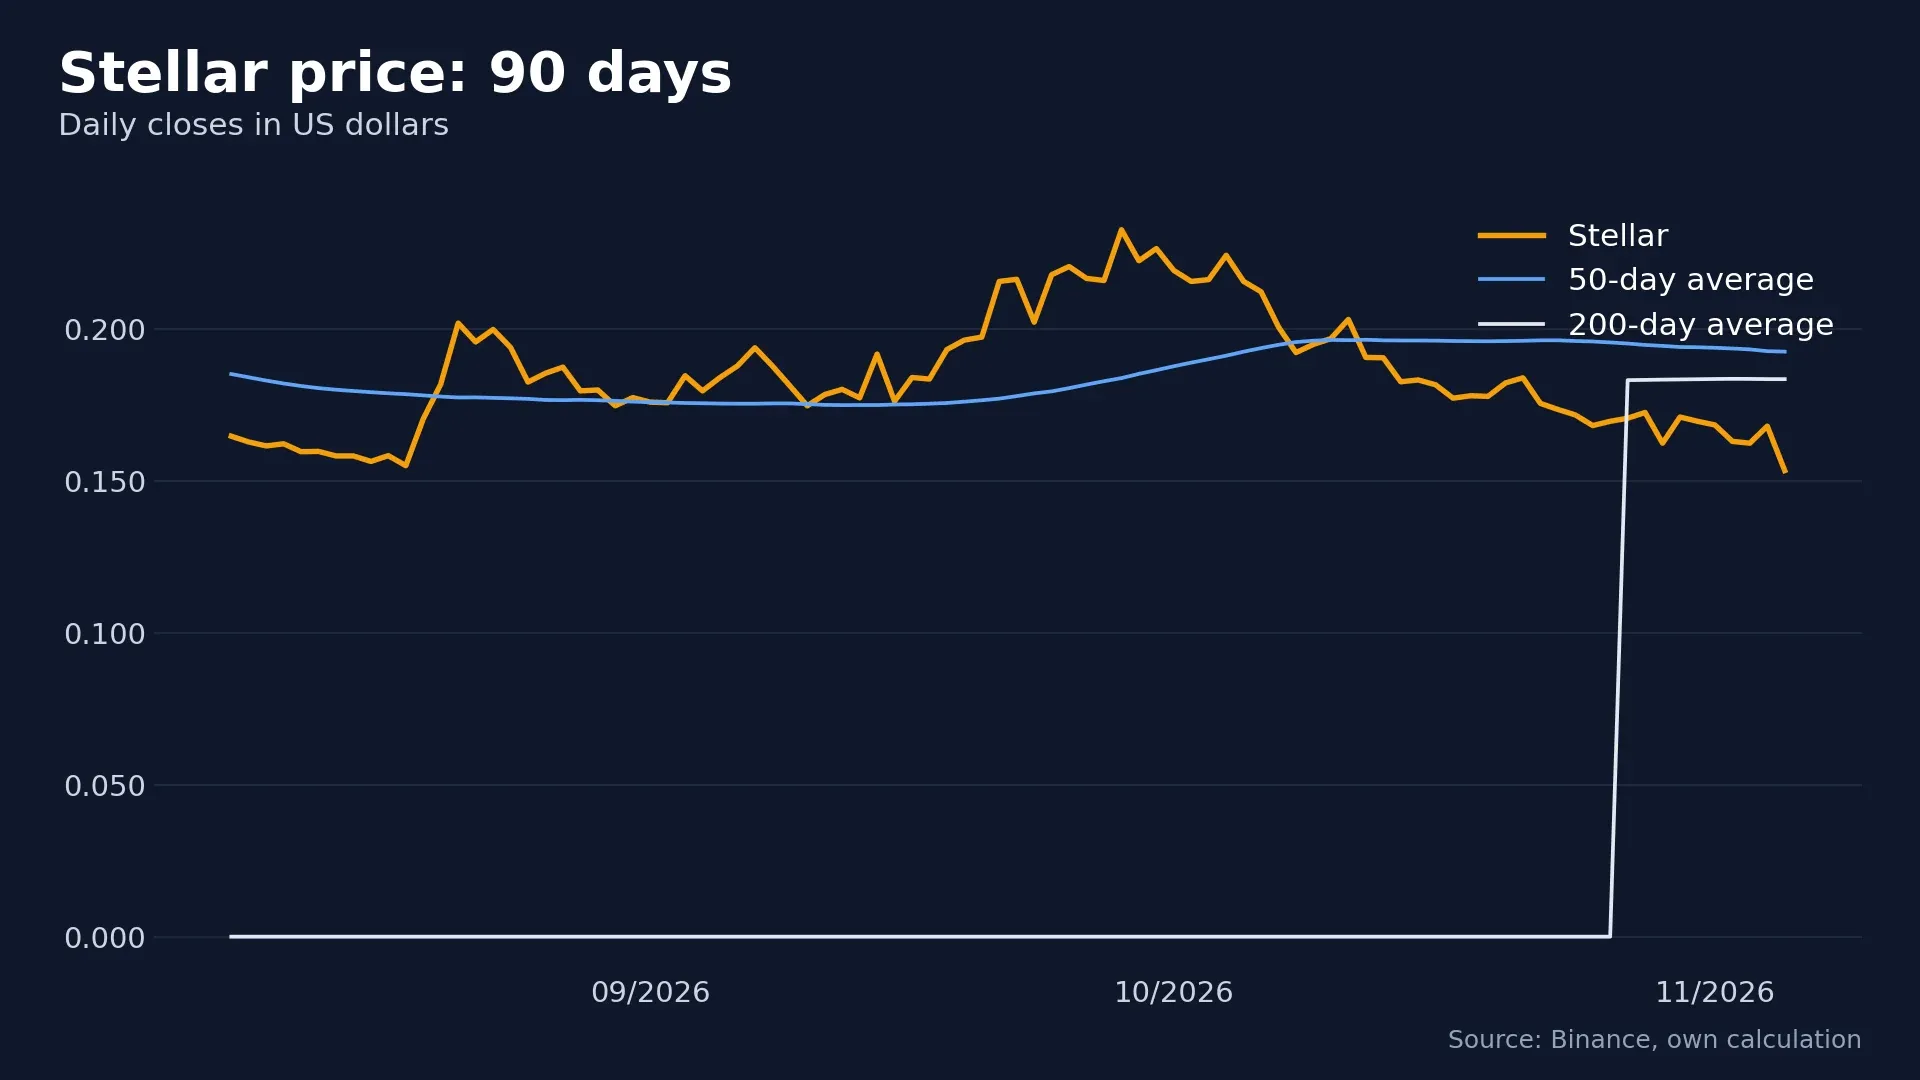
XLM already trades below its 200-day average, so the 30-day low is the nearest floor.
| Level | What it is |
|---|---|
| $0.192 | 50-day average |
| $0.183 | 200-day average |
| $0.153 | Price now |
| $0.151 | 30-day low (Binance) |
| $0.876 | All-time high, down 83% since then |
Our assessment, not a forecast: as long as Bitcoin holds the $75,000 area, a move back toward the 50-day average stays possible. If that area breaks, the 30-day low is the first level at risk.
 Crypto brokers compared
How to Hedge and Earn on Stellar in This Market
Remove leverage first, because a falling price then lowers only your book value. A stablecoin share or a short of the same size reduces the risk, with its own costs. Buying in small instalments spreads your entry price. Short positions earn on falling prices but can wipe out your margin quickly. Details are in our Bitcoin crash guide.
Where Can You Buy Stellar?
Our comparisons of regulated exchanges and crypto brokers set out fees and features for Stellar and other coins. Three common platforms, with partner links; check that XLM is offered in your country:
| Provider | Strength | Fits if you |
|---|---|---|
| Bitpanda | Savings plans, European provider from Vienna | want to buy in small, regular amounts |
| Coinbase | Simple app, listed on Nasdaq | are starting out and want a clear interface |
| OKX | Spot and derivatives on one platform | want to trade actively or hedge a position |
As of November 5, 2026. This article is not investment advice; crypto assets can lose value sharply.
FAQ: the Stellar price
Transparency note: This article was produced with the assistance of artificial intelligence and reviewed by our editorial team before publication. All figures and claims were checked against the primary sources linked in the text. The feature image was generated with AI.
Related articles
- Bitcoin Crash: Why BTC Fell to $75,568, How Low It Could Go and How to Hedge
- Uniswap Price Drops 10.7%: Why UNI Falls Harder Than Bitcoin
- Sui Price Drops 9.5% in a Day: The Levels SUI Must Hold Now
- Litecoin Price: Down 26% in 30 Days, Now the 200-Day Line Decides
- Crypto Crash Today: Why Is Bitcoin Stuck Below $82,000?
Which topics should we dive deeper into?
Select what genuinely interests you. Your picks feed directly into our editorial planning.
Crypto news that's actually worth your time.
Weekly. 60 seconds. Carefully curated by our editors: no hype, no promo flood, no spam.

November 3, 2026 8:28 AM

Why Is Crypto Down Today? The 5 Reasons Behind the November 3 Sell-Off
Why is crypto down today? Bitcoin sits near $76,000 after the Binance hack, a hawkish Fed and a Nasdaq slide. The five drivers, explained.
August 28, 2024 6:13 PM

Bitcoin Price CRASH: BTC Falls Below $60K, Eyes Support at $56.7K
BTC fails to breach the $66K level, crashing below $60K to around $58K. Can Bitcoin find support at $56.7K, or is another drop on the horizon?
October 26, 2026 7:36 AM

Bitcoin Price Crash: Top 3 Reasons Why BTC Price Dropped Below $80,000
Bitcoin price crashed below $80,000 over the weekend. Oil, ETF outflows and a wave of liquidations explain the move, and the Fed decides this week.
October 30, 2026 8:02 AM

Bitcoin Price After Binance Hack: Only 2% Down. What Comes Next?
Bitcoin fell only 2% after the biggest crypto hack ever drained $2.8 billion from Binance. Here are the higher and lower Bitcoin price targets now.
September 29, 2026 10:38 AM

Bitcoin Falls Toward $83,000 as Trump Rejects Iran Ceasefire Deal
Bitcoin slipped toward $83,000 after Trump rejected Iran's Hormuz proposal, sending oil above $100 and wiping out $478 million in crypto liquidations.
October 25, 2026 10:51 AM

Crypto Crash: Why the Top Cryptos Lost Up to 4% in One Week
Crypto crash week: the largest cryptos lost up to 4% in seven days. We break down why crypto prices are falling and what to watch next.
April 12, 2026 11:07 AM

Bitcoin Price Drops to $71,500 as US-Iran Peace Talks Collapse in Islamabad
Bitcoin retraces to $71,500 after failed US-Iran peace talks in Pakistan. Geopolitical tensions resurface, impacting the global crypto market sentiment.
July 28, 2026 11:53 AM

Why Is Crypto Down Today? The Reasons Behind Every Crypto Sell-Off
Why crypto is falling today, updated with every major move: the current trigger, the six forces behind almost every crypto sell-off, a five-minute checklist and a timeline of the 2026 drops.

October 29, 2026 9:40 PM

Crypto Crash After Binance Hack: $628 Million Liquidated in One Hour
At 20:24 UTC a Binance hot wallet was drained of about $2.8 billion. Within an hour Bitcoin fell below $79,000 and BNB lost 6.3%. Here is the minute-by-minute timeline, the prices of all major coins and what could come next as Asia wakes up.
March 26, 2026 1:23 PM

Crypto Ignores Bullish News as War Risk Takes Over — Why Bitcoin and Ethereum Are Falling Anyway
Bitcoin and Ethereum fall despite bullish crypto news as war risks, oil spikes, and macro pressure dominate market sentiment.

June 16, 2024 7:10 AM

XLM Price Prediction June 2024: How High Will XLM Go?
Curious about how high Stellar (XLM) might climb in June 2024? Check out our latest price prediction
October 31, 2026 12:04 AM

Is Gold a Safe Haven? Gold Price Falls 27% From Its Record as Stocks Crash
Gold fell 3.6 percent on the day US stocks crashed and is now 27 percent below its January record. Our comparison of six crises since 2007 shows when gold protects investors, when it fails and what would make it a safe haven again.
November 3, 2025 10:20 AM

Why did Bitcoin Crash Below $108K? Here are Apparent Reasons...
Bitcoin falls below $108K as a major insider sells 12,500 BTC, sparking market fear and speculation over whether the next stop is $100K.
December 10, 2024 12:30 AM

Bitcoin Price Drops Below $100K – Is a Bigger Crash Coming?
Bitcoin has fallen below $100K, triggering a broader market correction of over 8% in the last 24 hours. With profit-taking and large sell-offs hitting the market, could Bitcoin drop to $90K or lower?
April 2, 2026 2:44 PM

Bitcoin Price Drops Below $66,000 as $251M in Longs Vanish
Bitcoin slumps below the $66,000 mark, triggering over $251 million in liquidations. Technical analysis reveals a bearish trend line and key support levels.

March 27, 2026 9:45 PM

Bitcoin Price Crash: Why BTC Fell Below $68,000 Today
Bitcoin price faces a sharp slump below $68,000 as a $14 billion options expiry and Middle East geopolitical tensions trigger a wave of liquidations.
June 2, 2026 6:13 PM
Bitcoin Crash to $67,400 as Google and Berkshire Team Up for Massive $80B AI Fund
Bitcoin fell 5.6% to $67,400 as a massive $80B AI capital raise backed by Berkshire Hathaway triggered an institutional capital rotation out of crypto.
May 8, 2026 9:32 AM
Crypto Crash Today: Why Is Bitcoin Crashing below 80K?
Bitcoin price has slipped below $80,000 as geopolitical tensions and profit-taking trigger a crypto crash today. Here are the market dynamics behind the BTC drop.
April 12, 2024 8:55 PM

Bitcoin Crashed More Than 5%! Why is Bitcoin Crashing?
After failing to break the $70,000 mark, Bitcoin experienced a sharp decline, plunging below its recent consolidation level. Why is Bitcoin crashing?
August 10, 2026 6:52 PM
Why Is Crypto Down Today? Iran Shuts the Door on US Talks Until 2029
Crypto gave back its morning gains after Iran ruled out talks with Washington until 2029. Bitcoin lost $65,000, oil jumped 5% and altcoins bled again.
June 8, 2026 10:50 AM

Is it Time to Buy the Crypto Dip? Bitcoin at $60k Amid Middle East Escalation
Bitcoin has plunged from $120k to $60k as Middle East geopolitical tensions spike. Explore whether to buy the crypto dip or wait for further downside.


More from CryptoTicker