
Is PEPE Coin worth Buying in 2026?
PEPE still holds both its 50 day and its 200 day average, while trading volume has slipped back below its yearly norm. What that means for anyone buying at current prices, and the two levels that settle it.





Which topics should we dive deeper into?
Select what genuinely interests you. Your picks feed directly into our editorial planning.
Crypto news that's actually worth your time.
Weekly. 60 seconds. Carefully curated by our editors: no hype, no promo flood, no spam.
PEPE trades at 0.00000411 US dollars. That is 43.9 percent below the twelve month high of 0.00000733 dollars, reached on 27 October 2025, and 76.9 percent above the twelve month low of 0.00000232 dollars from 2 July 2026. The token is up 3.9 percent over seven days, up 20.7 percent over 30 days, and still trades above both its 50 day and its 200 day average, which reopens the question this article deals with: is PEPE a good buy at current prices, or has the recovery already taken the discount away?
cryptoticker.io collected the price data for this analysis itself. All figures are as of 16 October 2026 and rest on 365 daily closing prices, with exponential moving averages for the 50 day and 200 day lines and Wilder's method for the relative strength index.
PEPE Price Analysis: Where the PEPE Price Stands and Which Levels Matter
At 0.00000411 dollars, PEPE sits in the lower half of its twelve month range. The span between the low of 0.00000232 dollars and the high of 0.00000733 dollars covers a factor of roughly three, and the current price sits below its midpoint. Market capitalisation stands at 1.70 billion dollars, or rank 51 among all crypto assets tracked by the source.
Three levels frame the picture, and the two nearest ones now sit below the market. The July low of 0.00000232 dollars remains the only tested support of the past twelve months, and it lies 43.5 percent below the market rather than within easy reach. The 50 day average of 0.00000393 dollars, which capped every recovery attempt into the summer, has turned from resistance into the first line of defence and sits 4.5 percent below the price. The 200 day average of 0.00000369 dollars, the line that separates a recovery from a change of trend, lies 10.1 percent below where PEPE trades today.
The distances matter more than the absolute figures. A token 4.7 percent above its 50 day line has a modest cushion; one 11.3 percent above its 200 day line has completed the change of trend that was still missing in late summer. PEPE is both at once, which is a different starting point from the one this article described in August.
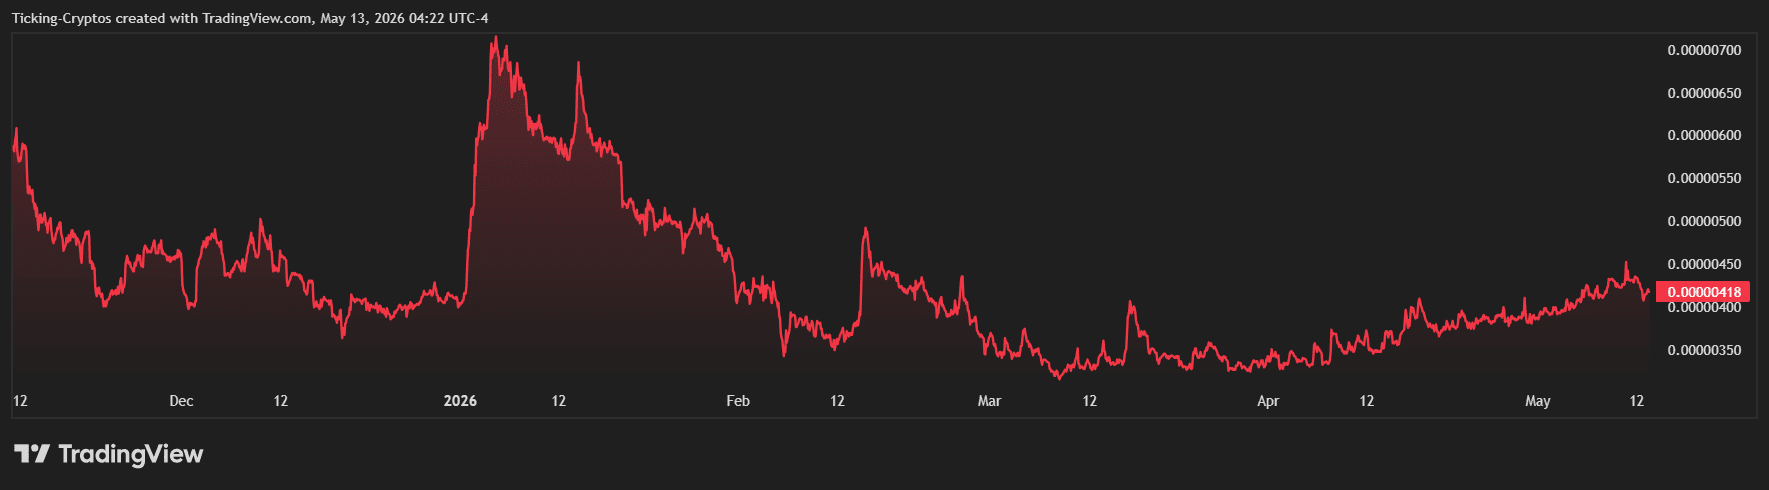
Is the PEPE Downtrend Broken or Only Interrupted?
Over 30 days PEPE has gained 20.7 percent, over 90 days it is up 49.2 percent and over the full twelve months it has lost 40.2 percent. The decline has stopped extending and has reversed over the medium term, while the past week has given part of it back and the twelve month record remains deeply negative. That distinction carries most of the weight in the decision at current prices.
The case for a genuine break is stronger than at any point this year. The July low of 0.00000232 dollars has held for more than three months, the market has reclaimed both the 50 day line at 0.00000393 dollars and the 200 day line at 0.00000369 dollars, and the 50 day line now stands 6.3 percent above the 200 day line. Those three conditions together are what the end of a downtrend tends to look like from the inside.
The case against it rests on what the move has already cost and on the week just past. The quarter has added 49.2 percent, the twelve month balance is still minus 40.2 percent, and the past seven days added 3.9 percent. A market that gives ground immediately after regaining its long term average is either pausing or failing, and for a while the two look identical. The fair reading is a confirmed turn whose follow through is outstanding.
What RSI and Moving Averages Mean for a PEPE Entry
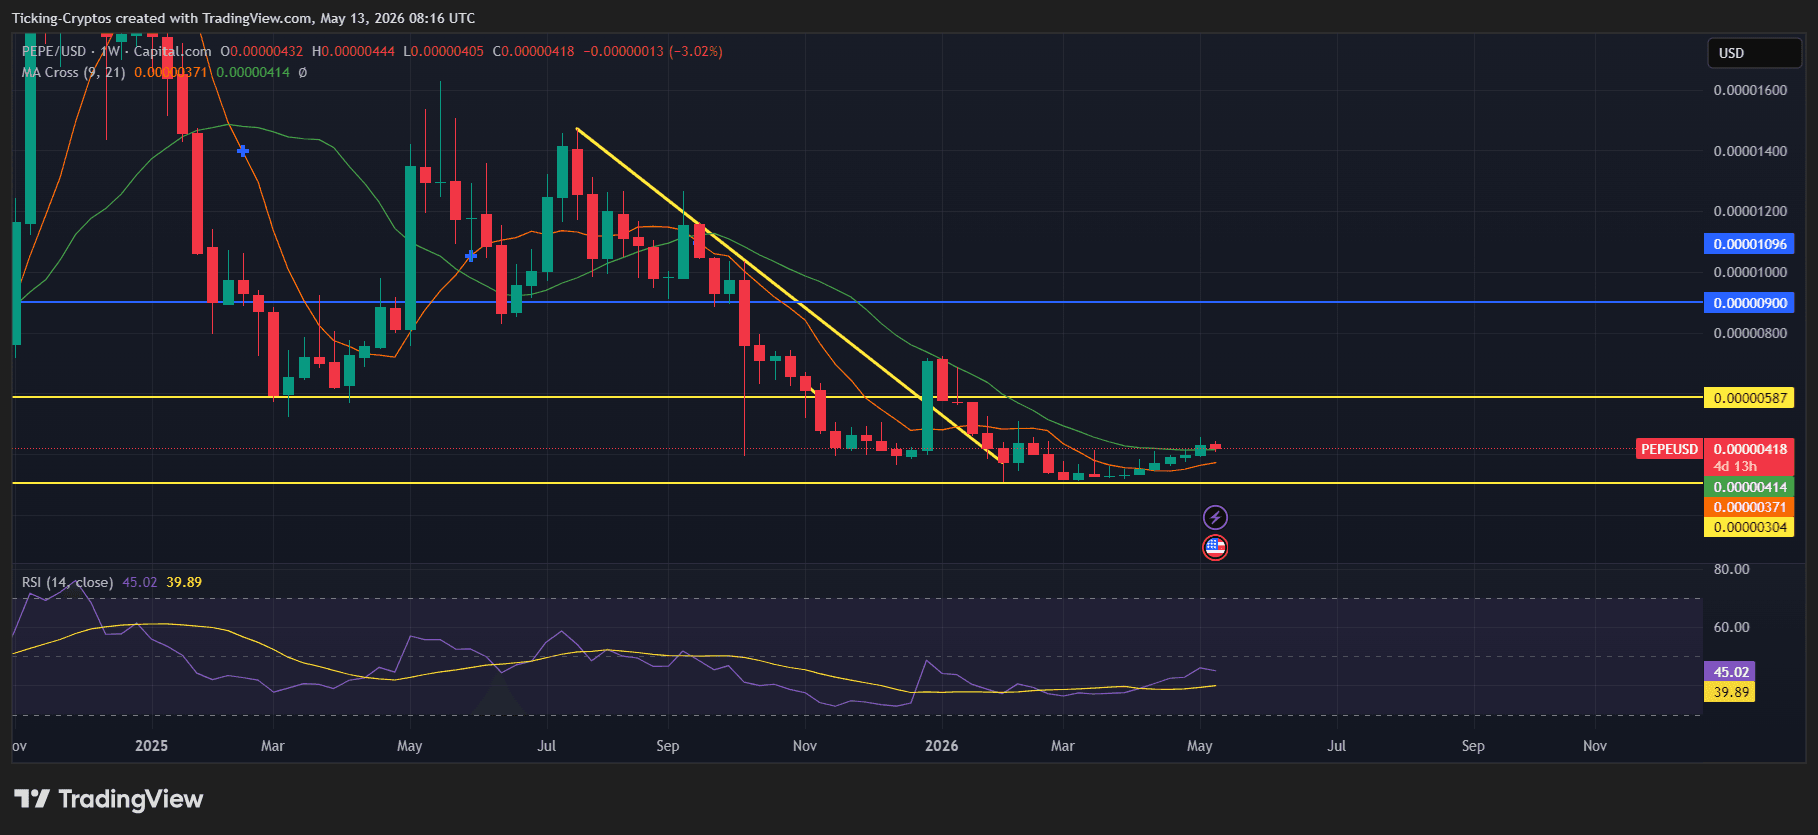
The relative strength index over 14 days stands at 50.6, just above the neutral 50 and far from both the 30 that marks an oversold market and the 70 that marks an overbought one. Buyers looking for an oversold entry are still not being offered one; buyers worried they are chasing an exhausted rally are not being given that signal either at 0.00000411 dollars.
The two moving averages tell the more useful story. The 50 day line at 0.00000393 dollars and the 200 day line at 0.00000369 dollars now lie around six percent apart, both beneath the market, and the price sits just above the band they form. That is a market that has changed regime rather than one still in transition, and it sets two thresholds: holding above 0.00000393 dollars keeps the recovery intact, while a daily close back beneath 0.00000369 dollars would put the change of trend in question again.
For an entry decision the consequence is a matter of sequence. Buying at 0.00000411 dollars means paying 21 percent more than a month ago for the evidence that the trend has actually turned; waiting for a pullback towards the moving averages means a potential entry some 4 percent lower, which the past week has moved further away. Both are defensible. Buying on the assumption that the July low of 0.00000232 dollars is still nearby is not, because it now lies more than 43 percent below the market.
What Trading Volume Reveals About PEPE Demand
Turnover in the past 24 hours came to 258.3 million dollars. The seven day average sits at 233.3 million, the 30 day average at 333.0 million and the average across the full twelve months at 309.1 million dollars. Current turnover is therefore roughly 0.8 times the 30 day norm, while the seven day average runs 29.9 percent beneath it.
That is the most informative number in this analysis, and it has cooled since August. Price moves without volume tend to retrace, and the reclaiming of both moving averages happened on turnover that has since settled back to the yearly average rather than exceeding it. The reading is neither confirmation nor warning: participation is ordinary, which is what a market looks like after a move rather than during one.
Which Structural Factors Speak for PEPE: Supply, Usage and Regulation
The supply mechanics are unusually clean for this category. Circulating, total and maximum supply are identical at 413.77 trillion tokens. There is no unlock schedule, no vesting cliff and no inflation, so a holder of PEPE cannot be diluted. In a quarter of returning demand that matters more than usual, because the supply side cannot absorb the move by issuing into it.
Usage is where the structural case runs out. PEPE is an ERC-20 token on Ethereum with no staking, no governance and no protocol function, so its value rests entirely on secondary market demand. That dependency also ties it to Ethereum's cost structure, since every transfer is settled there and paid for in ether. The network's published development roadmap is part of the environment PEPE trades in, even though the token contributes nothing to it.
On regulation, the European picture helps liquidity more than price. Under the MiCA framework, tokens like PEPE trade through supervised providers, and the European Securities and Markets Authority publishes the registers governing how they operate. Regulation has never been the constraint on this token's price.
What Speaks For Buying PEPE at Current Prices
- The trend has turned, and not only at the short end. At 0.00000411 dollars PEPE trades 4.7 percent above its 50 day average of 0.00000393 dollars and 11.3 percent above its 200 day average of 0.00000369 dollars, the line that rejected every recovery attempt through the summer.
- The quarter carries the move. A gain of 49.2 percent over 90 days against a twelve month loss of 40.2 percent is the first time this year that the medium term has pulled clear of the long term decline in this token.
- Supply cannot expand. Circulating, total and maximum supply are the same 413.77 trillion tokens. Whatever happens to demand, it will not be met by new issuance.
What Speaks Against Buying PEPE at Current Prices
- The decisive level is now underneath rather than overhead. PEPE trades 11.3 percent above its 200 day average of 0.00000369 dollars. That closes the gap this article described in August, and it also removes the cushion: between the current price and the July low there is no tested support left.
- The entry price has risen faster than the evidence. A 21 percent month and a 49 percent quarter remove part of the cheap setup, and the past seven days added another 3.9 percent. The July low of 0.00000232 dollars now sits 43.5 percent below the market, so a failed recovery costs considerably more than it would have in the summer.
- There is no value anchor. PEPE generates no revenue, carries no protocol function and pays no yield. It remains 43.9 percent below the October high of 0.00000733 dollars, which would require a further rise of roughly 78 percent, and tokens of this type are as capable of giving back a 21 percent month in a fortnight.
How to Buy PEPE at Current Prices: Costs, Custody, Providers
PEPE is listed on most large exchanges, so availability is not the constraint. Cost and custody are. For a token priced in the eighth decimal place the spread usually matters more than the headline fee, and turnover of 258.3 million dollars a day narrows that spread while it lasts. Our exchange comparison sets out how the major providers price this.
For buyers in the European Union, the supervisory status of the venue is the second filter. A provider authorised under MiCA faces defined requirements on client asset segregation and complaint handling, unlike an offshore venue offering the same token. Our overview of regulated exchanges covers which providers hold which permissions, while our Bitpanda review and our Kraken review document fees and account terms.
Custody is the third decision. Leaving PEPE on an exchange is convenient and means the venue holds the keys. Self custody removes that counterparty risk and adds an Ethereum transfer fee plus responsibility for a seed phrase. For a few hundred euros the transfer cost may exceed the risk it removes; above that the calculation changes. Our hardware wallet comparison covers the devices that support ERC-20 tokens.
Is PEPE a Good Buy at Current Prices? Short Term and Long Term
Over a horizon of weeks to a few months, the technical picture has improved further and the risk has moved with it. PEPE trades above both its 50 day and its 200 day line, the RSI at 50.6 leaves room in both directions, and turnover of 258.3 million dollars is evidence of ordinary participation rather than a rush. The cost of being wrong has also changed: with the tested low of 0.00000232 dollars now 43.5 percent away, a position bought at 0.00000411 dollars is a bet that the two moving averages between 0.00000369 and 0.00000393 dollars hold as support, refuted by a daily close beneath them.
Over a multi year horizon the question changes shape rather than becoming easier. The fixed supply of 413.77 trillion tokens means any sustained return of retail attention works through to the price without being absorbed by new issuance, and the past quarter demonstrates that mechanism. Against that, a 49 percent quarter does not establish that the attention has returned for good, and the twelve month balance of minus 40.2 percent is the reminder.
Which path is running will be observable rather than a matter of opinion. Holding above the 50 day line at 0.00000393 dollars, with seven day turnover recovering above the 30 day average of 333.0 million dollars, would support the recovery case. A daily close back below the 200 day line at 0.00000369 dollars would file this move alongside the failed attempts of May and June. Until one of the two occurs, PEPE at 0.00000411 dollars remains a speculative position on attention staying with a token that generates none of its own, and it should be sized accordingly. With the fear and greed index at 63, classified as greed by its source, the prevailing mood still points in no particular direction.
Buying PEPE: what to take away
- The short and medium term trend has turned, the long term one has not. PEPE at 0.00000411 dollars is 4.7 percent above the 50 day line at 0.00000393 dollars, 11.3 percent above the 200 day line at 0.00000369 dollars and still 43.9 percent below the high of 0.00000733 dollars. Our PEPE price prediction sets out the scenarios.
- Two levels decide the question. Holding above 0.00000393 dollars keeps the change of regime intact; a close back below 0.00000369 dollars would mark the recovery as a failed breakout. Anyone buying should know which of the two they are positioned for, and on which venue, which our exchange comparison helps decide.
- Cost and custody are the part you control. The price is not in your hands, the spread and the storage decision are. For positions beyond a small trial amount, the hardware wallet comparison covers the devices that hold ERC-20 tokens such as PEPE.
Disclosure: Some of the providers mentioned in this article work with us through partner programmes. This has no influence on the price analysis or on the assessment of the chart situation; the price data comes from a public market data source and can be verified there.
(As of 16 October 2026. This article is not investment advice. Prices, fees and terms change; check them with the provider before every purchase. Crypto assets are subject to high price fluctuations, a total loss is possible.)
Transparency note: This article was produced with the assistance of artificial intelligence and reviewed by our editorial team before publication. All figures and claims were checked against the primary sources linked in the text. The feature image was generated with AI.
Related articles
Which topics should we dive deeper into?
Select what genuinely interests you. Your picks feed directly into our editorial planning.
Crypto news that's actually worth your time.
Weekly. 60 seconds. Carefully curated by our editors: no hype, no promo flood, no spam.

August 27, 2026 2:21 AM

Is SUI a Good Buy at Current Prices?
SUI is holding its 200-day moving average and trades 51 percent above its twelve-month low, with the 50-day line now above the 200-day. We check whether the coin is a good buy at current prices.

May 5, 2025 8:00 AM

Meme Coins Defy Market Downturn: May 2025 Outlook and Q2 Forecast
Find out which meme coins are defying the crypto downturn in May 2025, with fresh momentum, political hype, and what price predictions are shaping their Q2 forecasts.
August 24, 2026 12:34 AM
Is Monero a Good Buy at Current Prices?
Monero broke above the level we named in September as the test for a trend change. What the breakout, an overbought RSI and EU rules mean now: is Monero a good buy at current prices?
August 24, 2026 12:19 AM

Is Zcash a Good Buy at Current Prices?
Zcash has given back part of its September advance and now sits just above its 50-day average. We look at what the trend, the RSI and the turnover actually support, and under which conditions the case for buying ZEC breaks down.

January 1, 2024 6:12 AM

New Year, New PEPE?: Can PEPE Coin Price 10x in 2024?
In our analysis of the PEPE coin's price outlook, we delve into the possibility of the PEPE coin giving 10x in the year 2024.

October 22, 2023 4:23 AM

PEPE Coin Price Prediction: The Meme Coin’s Future Unveiled
Explore the future prospects of PEPE Coin as we delve into its historical performance, expert opinions, and potential trajectory. Get a comprehensive look at this meme coin's potential.
May 18, 2025 5:58 PM

PEPE Coin Prediction – Is a Breakout to $0.000021 Possible?
PEPE price prediction: PEPE coin just reclaimed a key level, but is this a bull trap or the start of a major rally? Latest chart analysis and trading setups in this article.
September 23, 2024 8:44 AM
Is it a Good Idea to Buy XRP below $0.60?
With recent XRP price drops positioning it below the $0.60 mark, investors are left pondering. Is it a good idea to buy XRP below $0.60?
October 24, 2024 6:59 PM
GOAT Meme Coin Skyrockets 680% in 1 Month: Here's how Truth Terminal Helped Boost Prices
The rise of Goatseus Maximum (GOAT) has taken the crypto world by storm. How did Truth Terminal become the first AI crypto millionaire?
March 21, 2025 6:00 AM

PEPE Price Prediction: Can PEPE Reach $1?
As one of the top-performing meme coins today and this week, and outpacing leading cryptocurrencies, including DOGE, SHIB, and FLOKI. Can PEPE reach the coveted $1 mark?
February 17, 2026 8:06 AM
PEPE Price Prediction: 23% Surge Ignites Recovery as Bitcoin Reclaims $70k
PEPE price jumped 23% as Bitcoin hit $70,000. Analyze the technical breakout, whale accumulation, and why this memecoin remains a high-volatility leader in 2026.
March 13, 2024 6:31 AM

Pepe Explodes Again: How High Can the PEPE Price Go in March?
Now, let's explore why Pepe is gaining traction and how high can the PEPE price go in this PEPE price prediction article.
December 9, 2023 7:58 AM

PEPE Coin Price Prediction for 2024!
Explore PEPE Coin's future in simple terms. Discover its current status, 2023-2024 predictions, and the exciting world of meme coins.
May 17, 2022 1:45 PM
Dogecoin price can make you Profit 100%, here’s how!
Will Dogecoin price increase soon? In this Dogecoin price prediction, we analyze DOGE and see whether it is a good idea to buy Doge today.
May 28, 2021 12:42 PM

Shiba Inu Price Prediction – is this Coin still Worth it?
Today, Shiba Inu's price is around its lowest since the pump. Is Shiba Inu crypto still worth buying? Should you Buy SHIB?
March 26, 2025 7:01 PM
Can Dogecoin Price Hit $1 and Be the Surprise Winner of 2025?
DOGE price is climbing fast—could Dogecoin hit $1 in 2025? Here are the latest price analyses, bullish signals, and the key role of Elon Musk and X Payments in DOGE’s next moonshot.
October 22, 2024 3:01 PM

POPCAT Price Prediction: Is The CAT About To POP A New ATH
Is the CAT about to POP a new ATH? The answer is the full picture of the POPCAT price surge with these inputs: the POPCAT price analysis and the POPCAT price prediction, leading to the new POPCAT ATH potential.
April 27, 2025 10:09 AM

TURBO AI Comeback with 20% Surge: Is the Meme Coin Hype Back?
Turbo Coin (TURBO) rockets 20% as AI and meme coin mania reignite. Is this the beginning of a full-scale comeback — and could TURBO lead the next crypto breakout? Find out why this AI-born meme coin is back in the spotlight.

April 24, 2026 3:29 PM
XRP Price Prediction: Why Ripple is Stuck in a Sideways Grind
XRP price remains stagnant despite regulatory wins. This XRP price prediction analyzes the technical chart and identifies the key breakout levels for 2026.
October 8, 2024 10:46 AM

This Memecoin Made 100% in 1 Month...Meet MOG Token
MOG crypto has seen a significant price increase over the past month, attracting attention from traders and investors.
October 28, 2024 9:47 AM
Dogecoin Price Surges Amid Bullish Indicators: Will the Rally Continue This Week?
Dogecoin price surge in the past hours is making headlines, fueled by positive market activity and bullish technical signals. Is DOGE on the verge of a major rally?
June 16, 2024 1:12 PM

DOGE Coin or XRP: Which Is Better?
XRP and DOGE coin are among the top altcoins in the market. What will happen next week and what do analysts predict?
January 13, 2026 10:11 AM

PEPE Was Up 50% in Early 2026: Did PEPE Coin Break the Descending Triangle?
PEPE gained about 50% in the first days of 2026 and pressed against a descending triangle. It broke lower instead: the support at $0.0000040 gave way and PEPE fell to about $0.0000023 in July.
September 28, 2026 4:28 AM

Is Quant a Good Buy at the Current Price?
Quant climbed as high as 357 dollars after the bank mandate and has since fallen back sharply. Is QNT a good buy at the current price? We check the chart, volume, the banks' timetable and the token's role with our own data.
March 25, 2026 10:38 AM

Ethereum News: ETH Targets $2,200 as Geopolitical Tensions Ease and Bitcoin Reclaims $71k
Ethereum nears $2,200 while Bitcoin reclaims $71,000 amid reports of US-Iran peace talks. Here are the latest ETH chart trends and market sentiment for March 2026.

More from CryptoTicker