
Is Solana (SOL) a Good Buy at Current Prices?
Solana has traded above its 200-day average since August and the 50-day average joined it on 21 September, but volume is no longer keeping pace. What chart structure, issuance and tokenisation say about buying at current prices.




Which topics should we dive deeper into?
Select what genuinely interests you. Your picks feed directly into our editorial planning.
Crypto news that's actually worth your time.
Weekly. 60 seconds. Carefully curated by our editors: no hype, no promo flood, no spam.
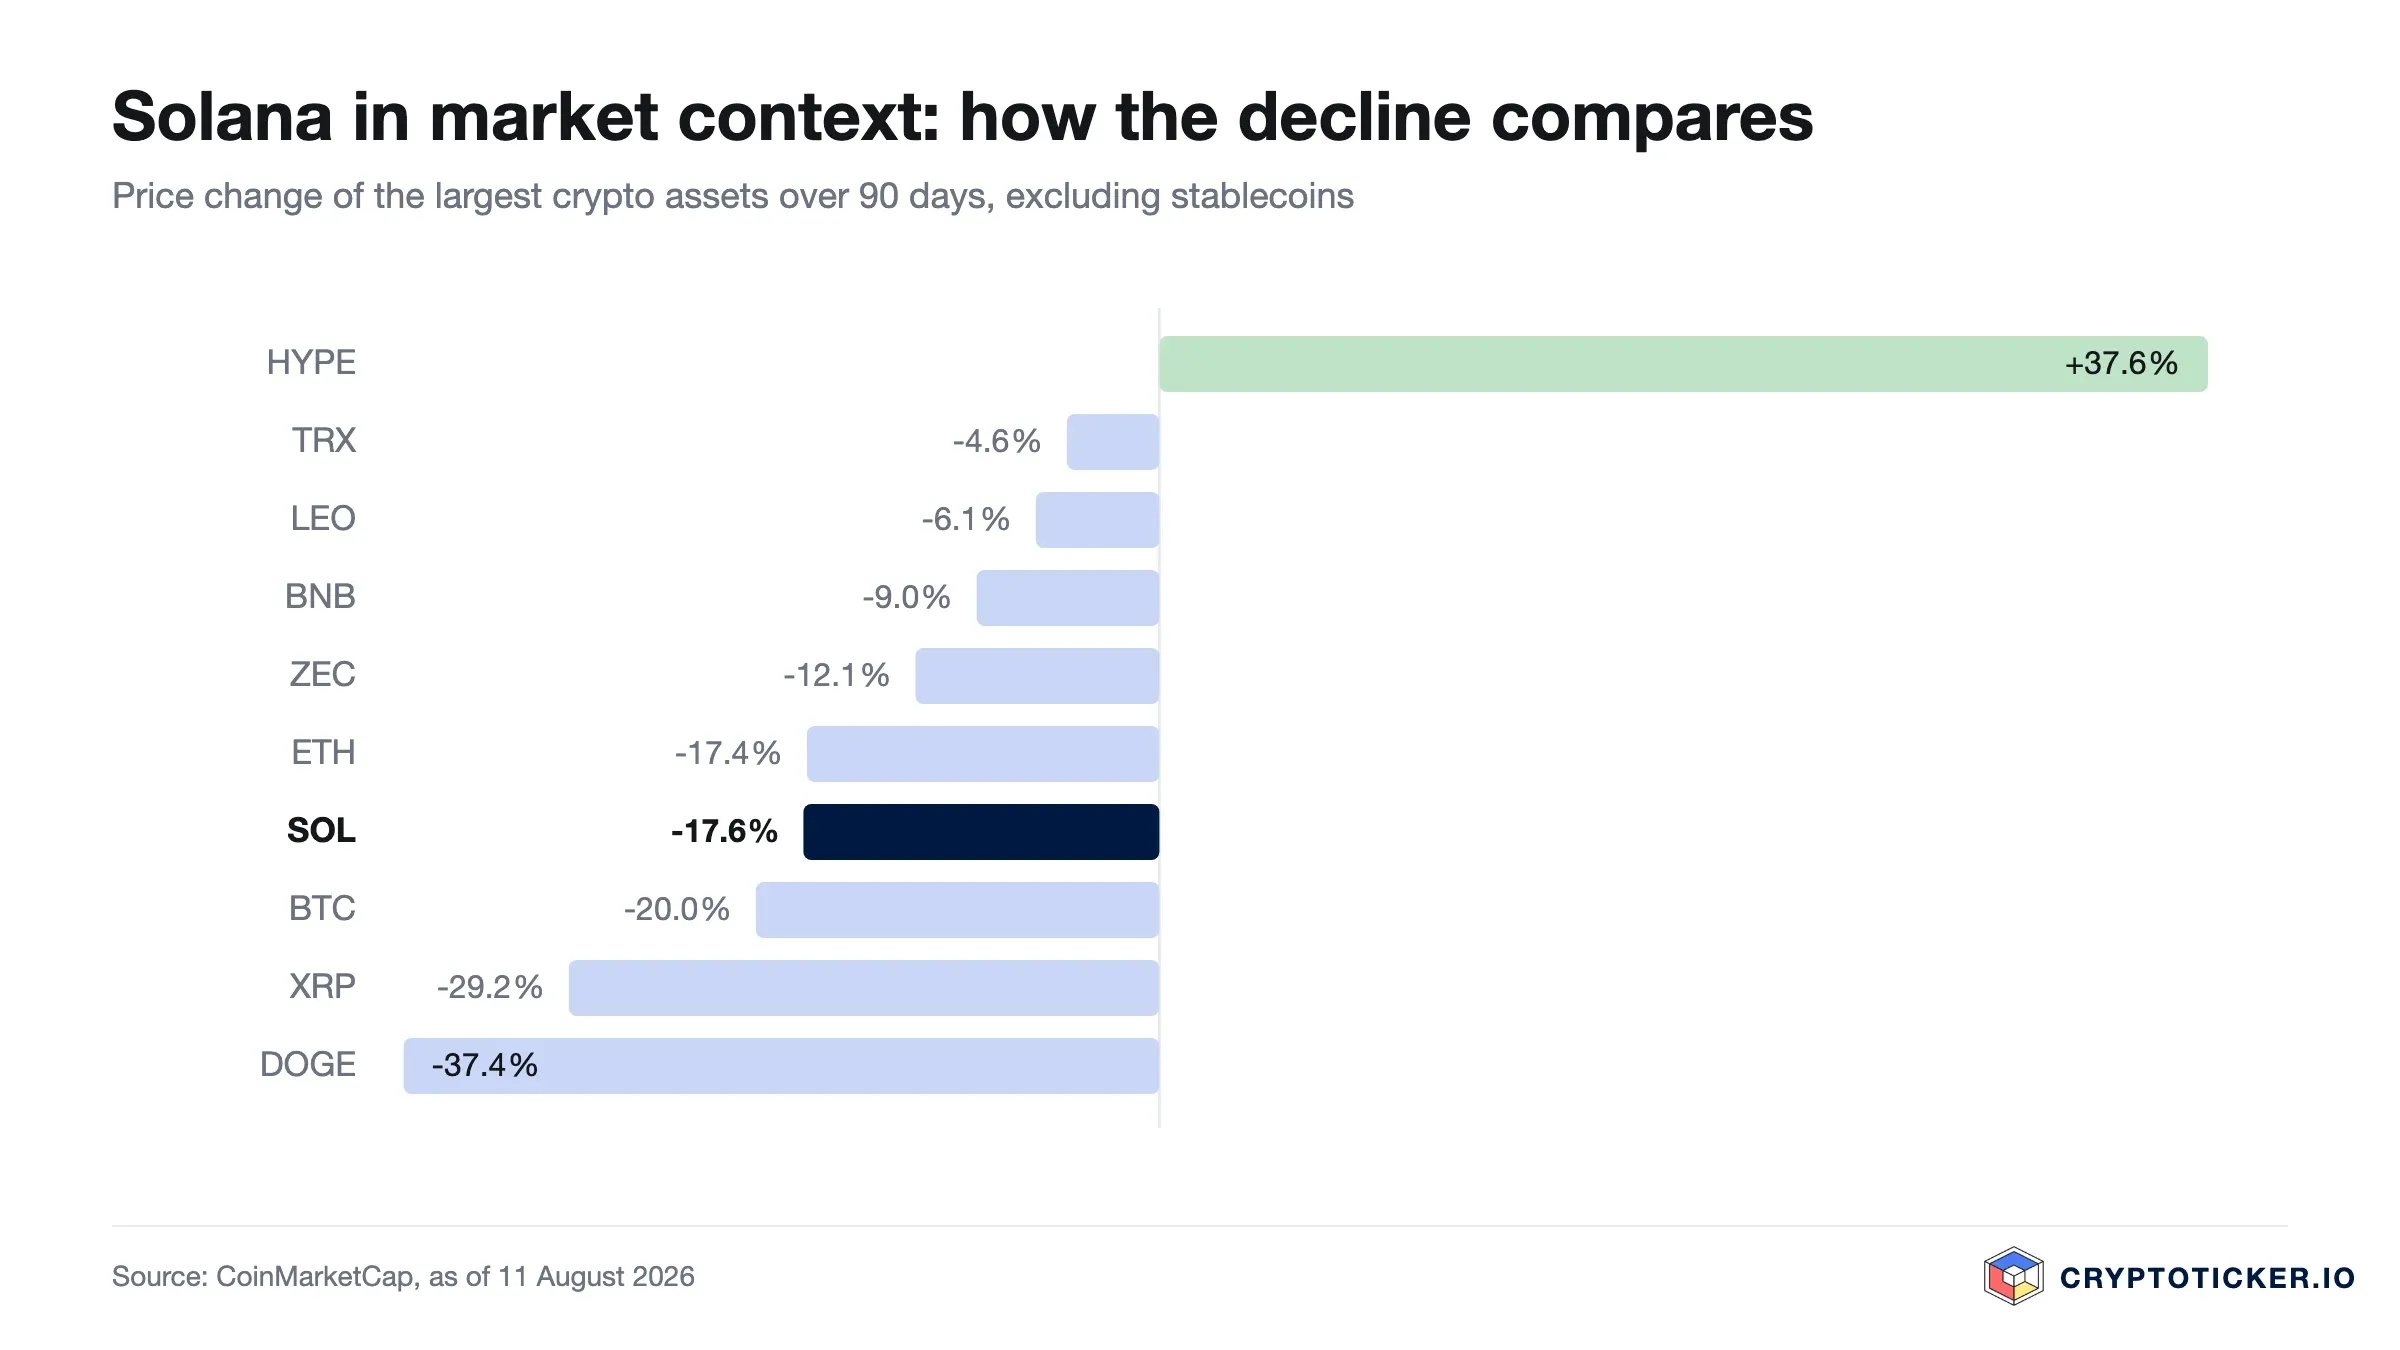
Solana trades at roughly $104 on 20 October 2026. That leaves it 47.8 percent below the twelve-month high of $200.02. It remains the deepest drawdown among the three largest crypto assets: Bitcoin sits 28.7 percent below its high, Ethereum 42.4 percent.
That number is why the question of a good entry gets asked louder for Solana than for the others. It is also why it is harder to answer. This article sets out what the chart supports, where Solana stands structurally stronger than its valuation suggests, and which counterarguments belong in an honest assessment.
The price data was compiled by cryptoticker.io on 20 October 2026. It is based on daily closing prices for the past 365 days from CoinGecko's public market data interface; moving averages and the relative strength index were calculated from that series using the standard formulas. Anything beyond the data is marked as assessment.
Solana price analysis: where does the Solana price stand in October 2026?
The 200-day moving average sits at $98.48. The price trades 6.0 percent above it, after 9.1 percent at the last reading. The most important change from the previous months therefore holds: since 22 August 2026 Solana has been above this line, after months spent well below it.
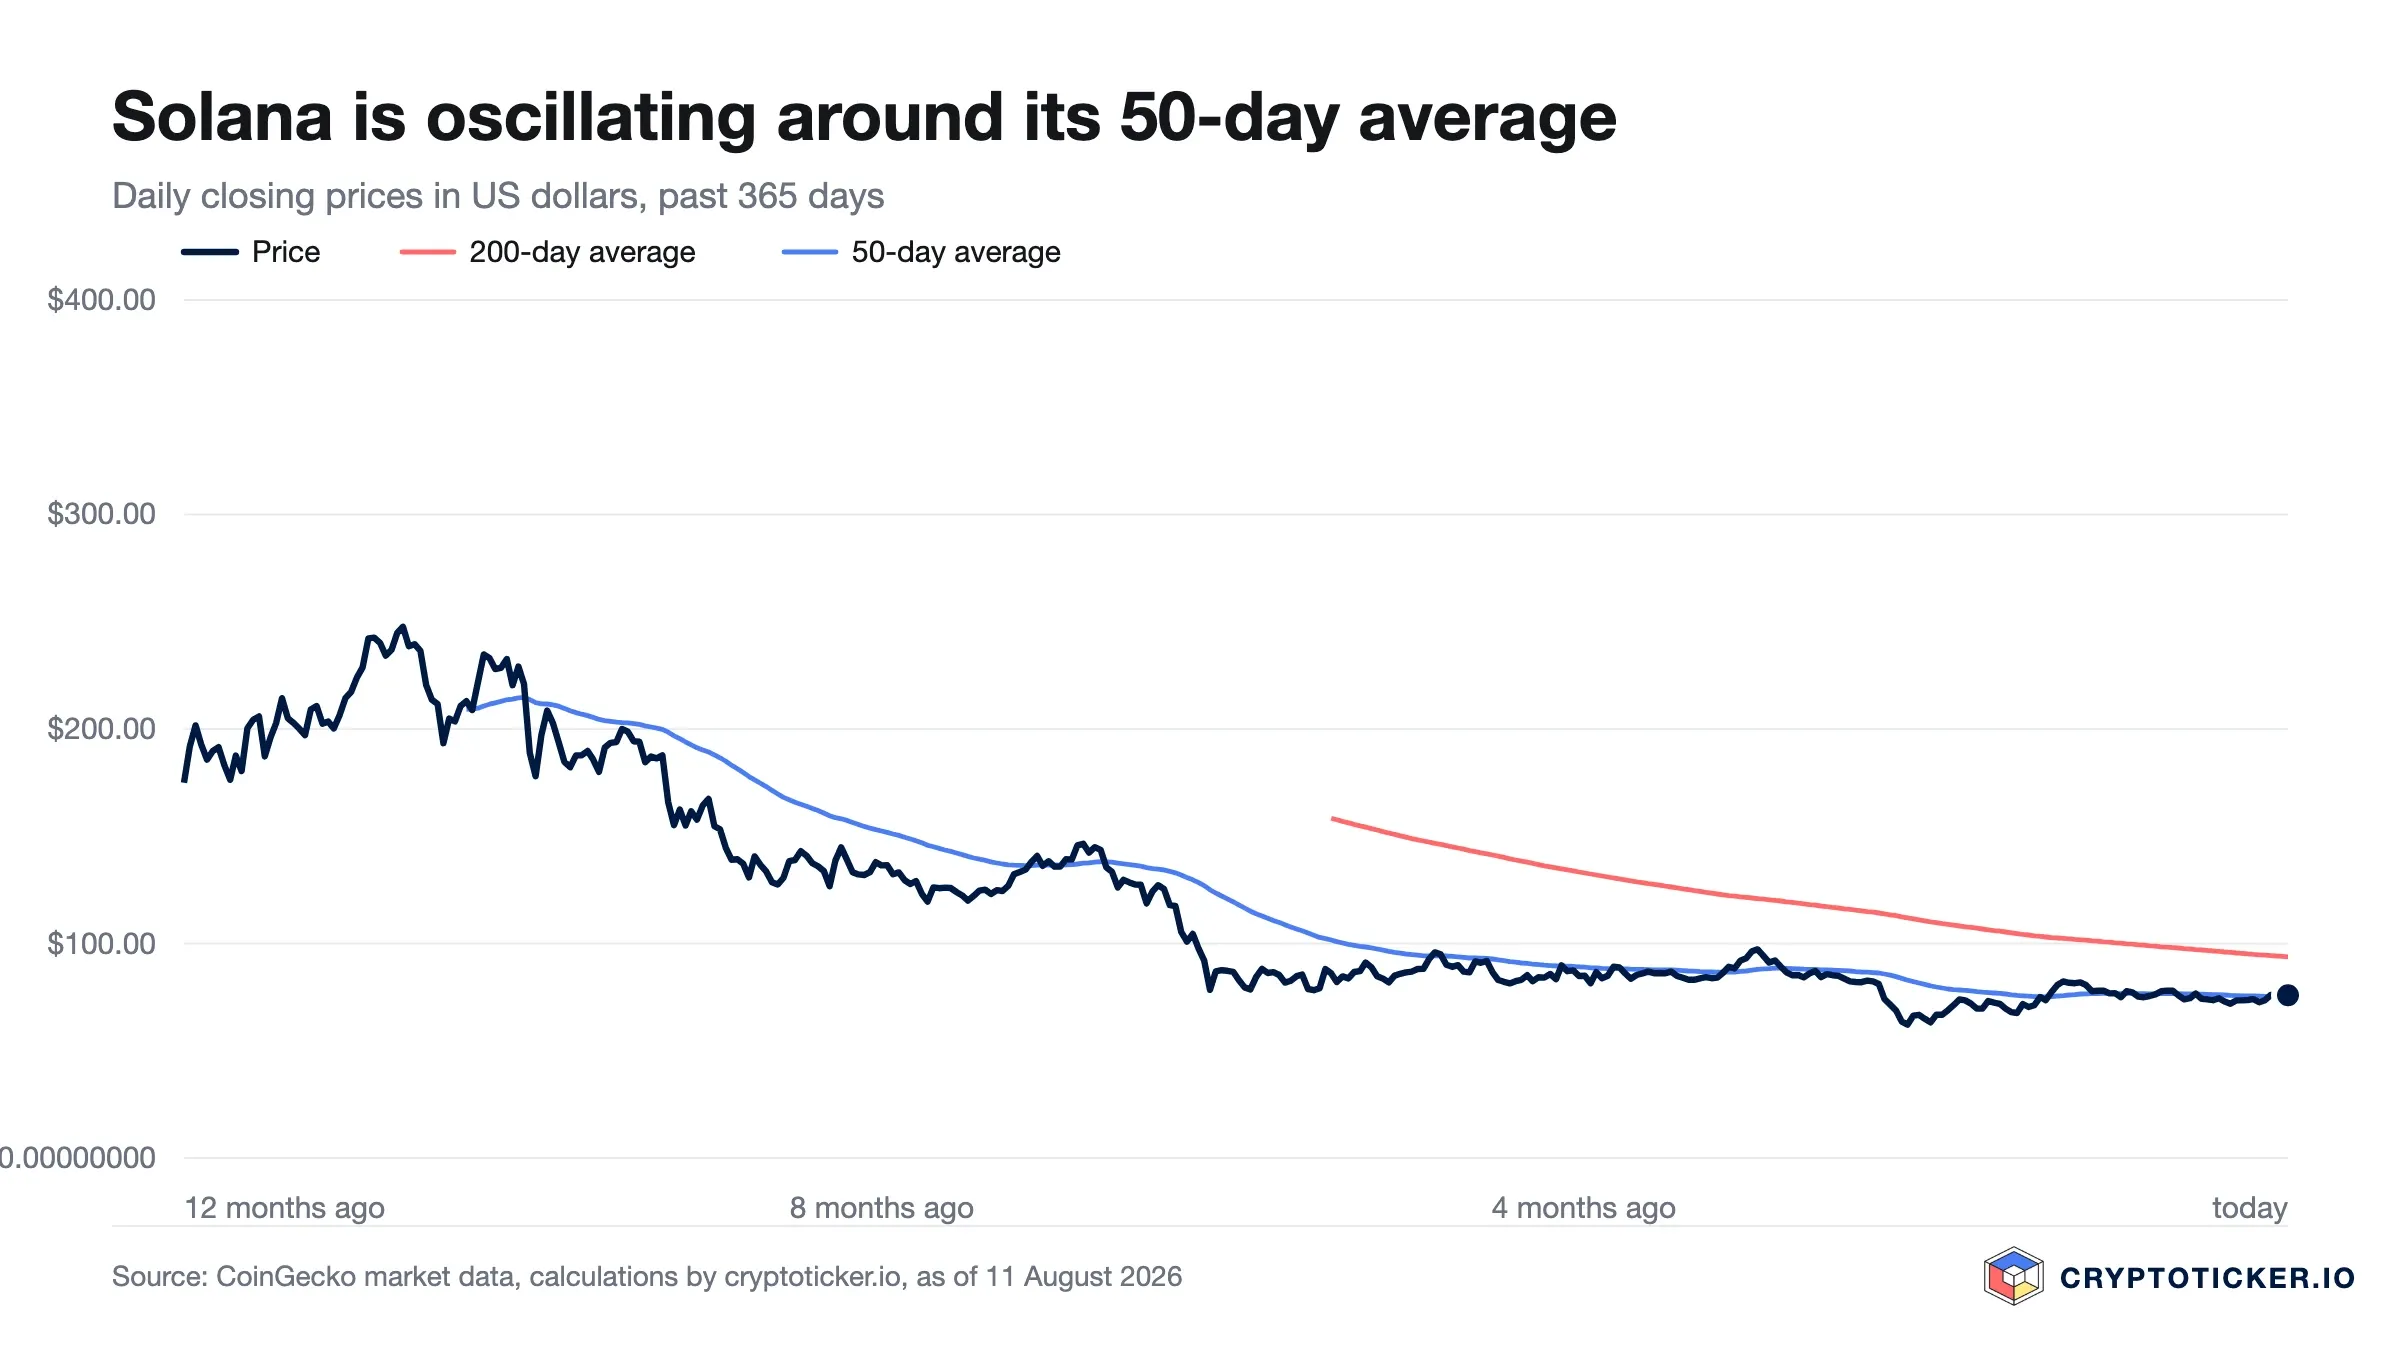
Short term the move has lost that line. The 50-day moving average stands at $106.66, and at $104.37 the price sits 2.1 percent below it; at the last reading it was still standing practically on that line. The structural finding holds nonetheless: the 50-day average has sat above the 200-day average at $98.48 since 21 September 2026, with an 8.3 percent lead. The recovery remains confirmed by the longer average, but the short-term tailwind is spent.
The levels that matter for an entry:
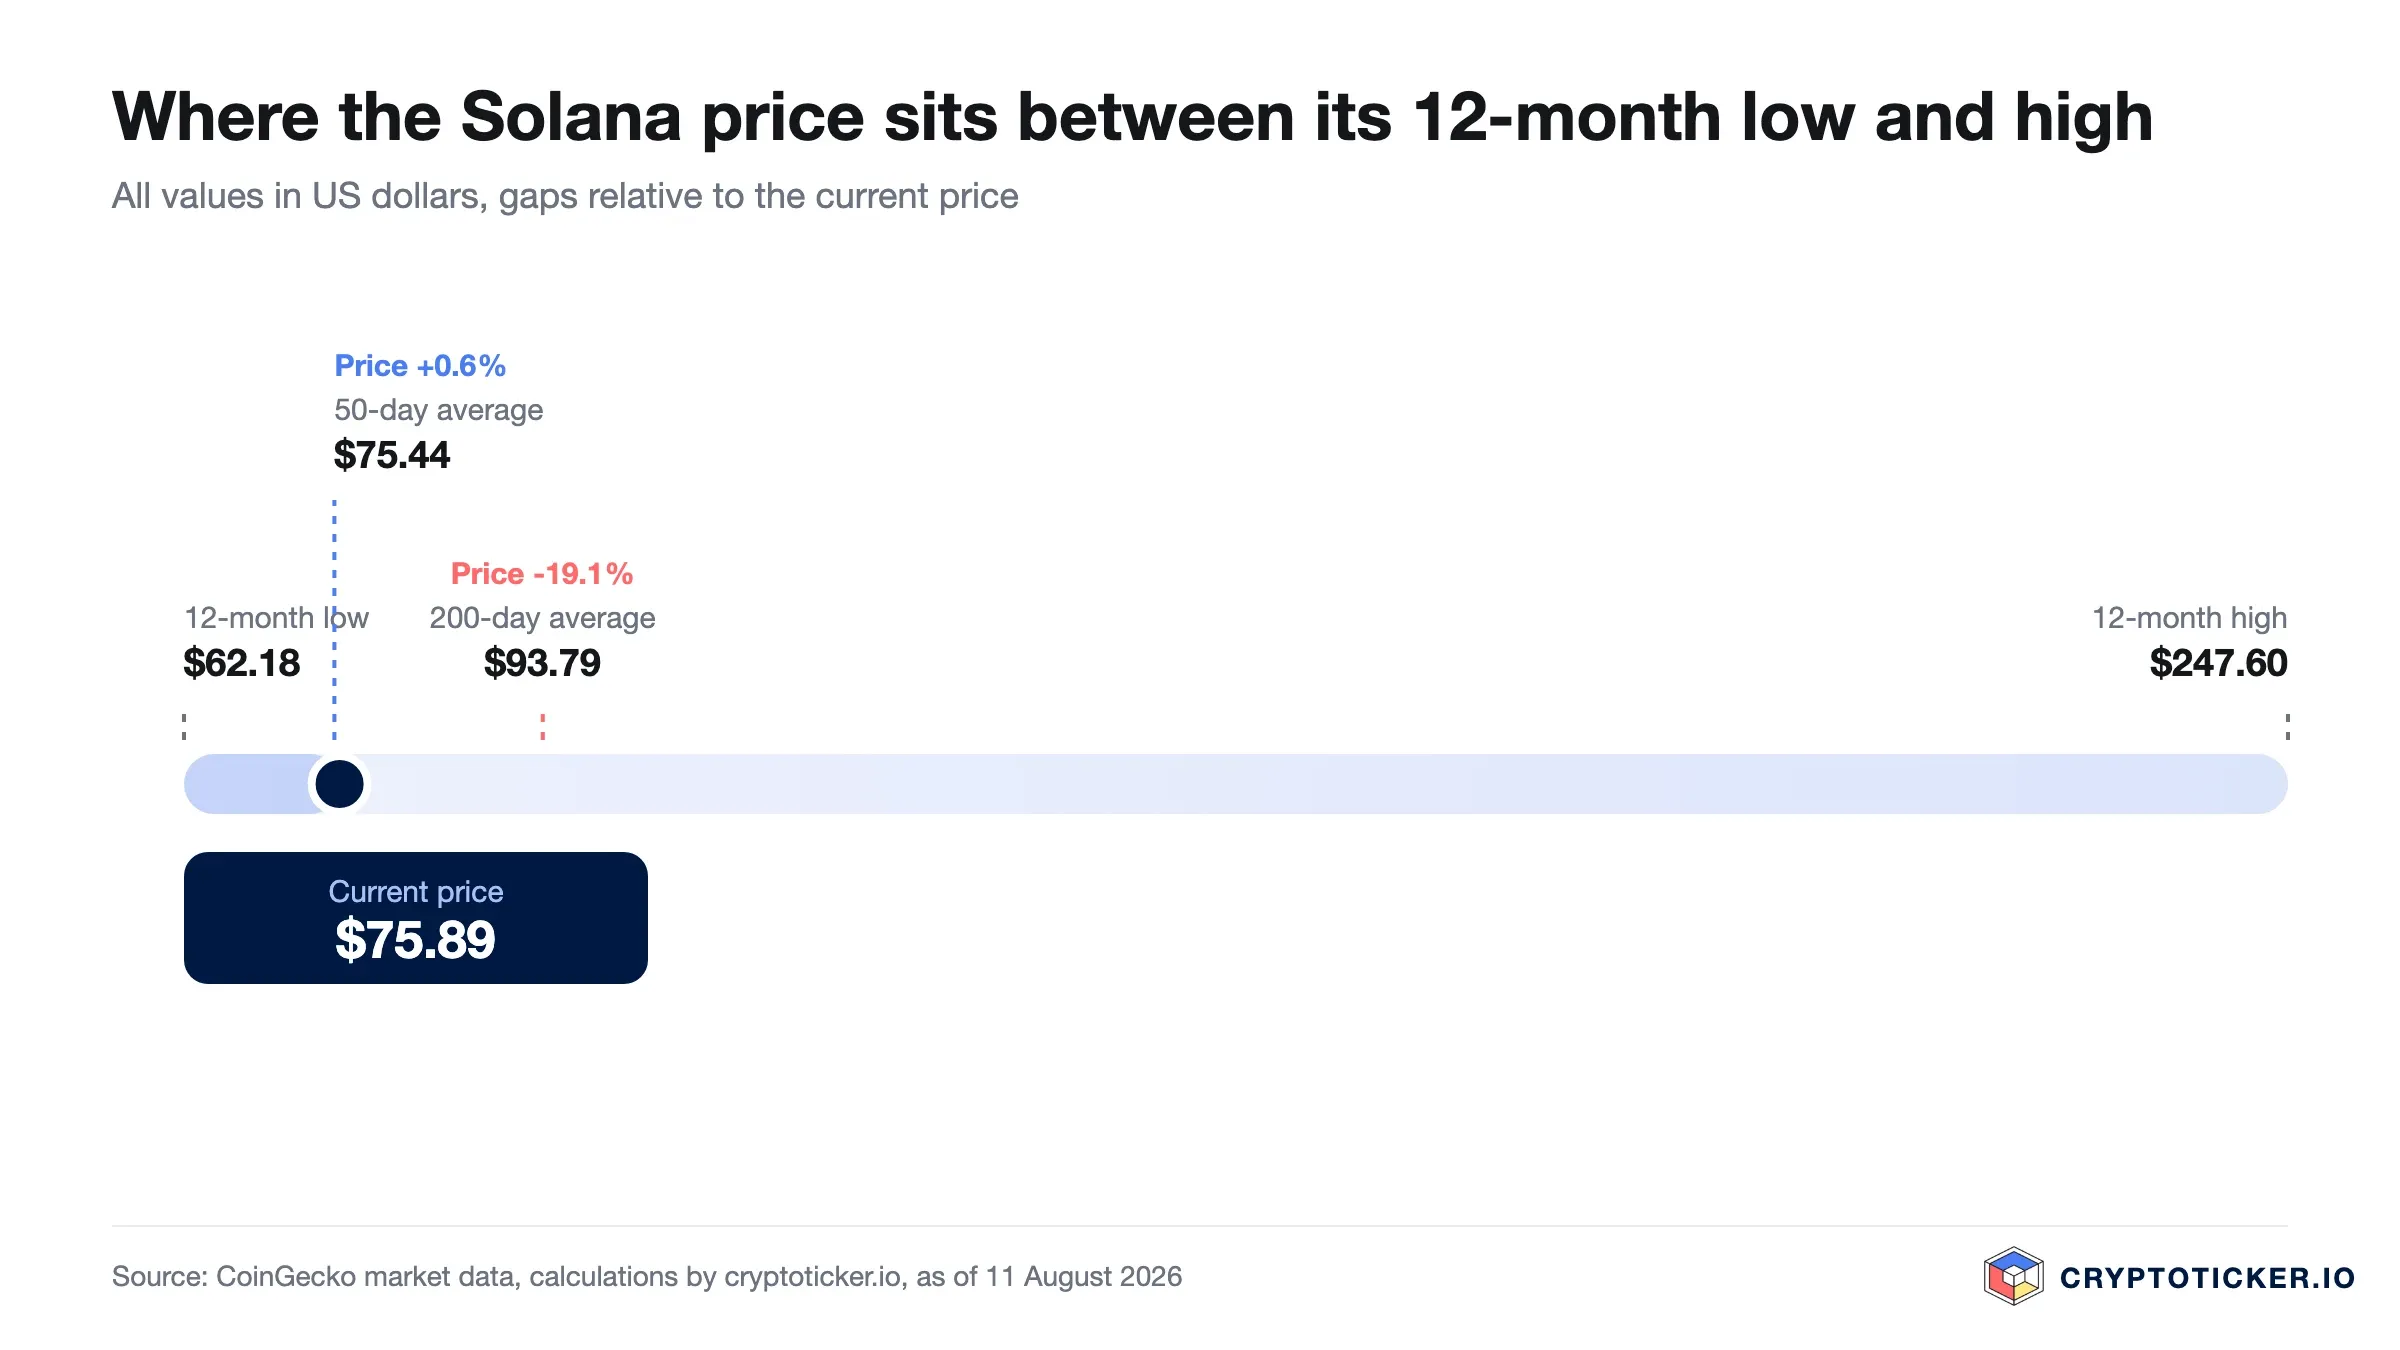
- First support: $98.48 at the 200-day average, some 6 percent lower. This line was resistance into August and is no longer. The 50-day average at $106.66 no longer sits below the price but 2.2 percent above it, and has turned into a hurdle.
- Current zone: $104.37, above the 200-day average and below the 50-day average.
- The next hurdle: $122.08, the interim high of the past 60 days, some 17 percent away.
- The downside risk: $62.18, the twelve-month low from early June, now 40.4 percent below the current price.
Over 30 days the price is now down 6.1 percent, over 90 days still up 33.9 percent, over the past seven days down 2.2 percent, and over twelve months still down 45.0 percent. The recovery of recent months therefore does not yet turn the annual balance, though it has narrowed the deficit noticeably — and on a monthly view it has tipped into the red since the last reading.
Is Solana really oversold on the monthly chart?
No, not even after the setback. The relative strength index stands at 40.1, below the midline, after 42.1 at the last reading. Oversold conventionally begins below 30, overbought above 70. Solana sits between the two, in the lower half, without reaching the oversold zone.
This matters for a buying decision because it cuts both ways. A low price is not the same as an oversold market, and a loss of 6.1 percent in a month is not yet panic. The contrarian argument existed in early June at prices around $62; anyone who bought then is up 67.9 percent today. The recovery has used that argument up. What you buy today is no longer panic but a trend change whose short-term line has already broken, and that is a different bet carrying a different risk.
What trading volume reveals about Solana demand
The finding of the last reading stands. Average daily volume over the past seven days was roughly $2.78 billion, compared with $3.45 billion measured over 30 days. That is a decline of 19.3 percent, after 18.6 percent at the last reading.
For comparison: over the same period Bitcoin's volume fell by 12.7 percent and Ethereum's by 12.5 percent. Solana is therefore still losing the most participation of the three, and the gap to the other two has widened again since the last reading — for Bitcoin and Ethereum the decline has eased, for Solana it has not. The caveat which was the weightiest in previous months, and which counted as settled in September, therefore remains open: the move is not being carried by volume.
Why has the Solana price fallen so sharply?
The disproportionate twelve-month decline has two distinguishable causes. The first is beta. Solana moves more than Bitcoin in both directions, because the capital invested there is more short-term in nature. In a market where the leader fell 28.7 percent, a 47.8 percent decline in Solana is not an anomaly but the rule. The same mechanism worked upwards and is now working downwards: over 30 days Solana is down 6.1 percent while Bitcoin is up 0.6 percent, and over seven days Solana loses 2.2 percent against 1.8 percent for the leader.
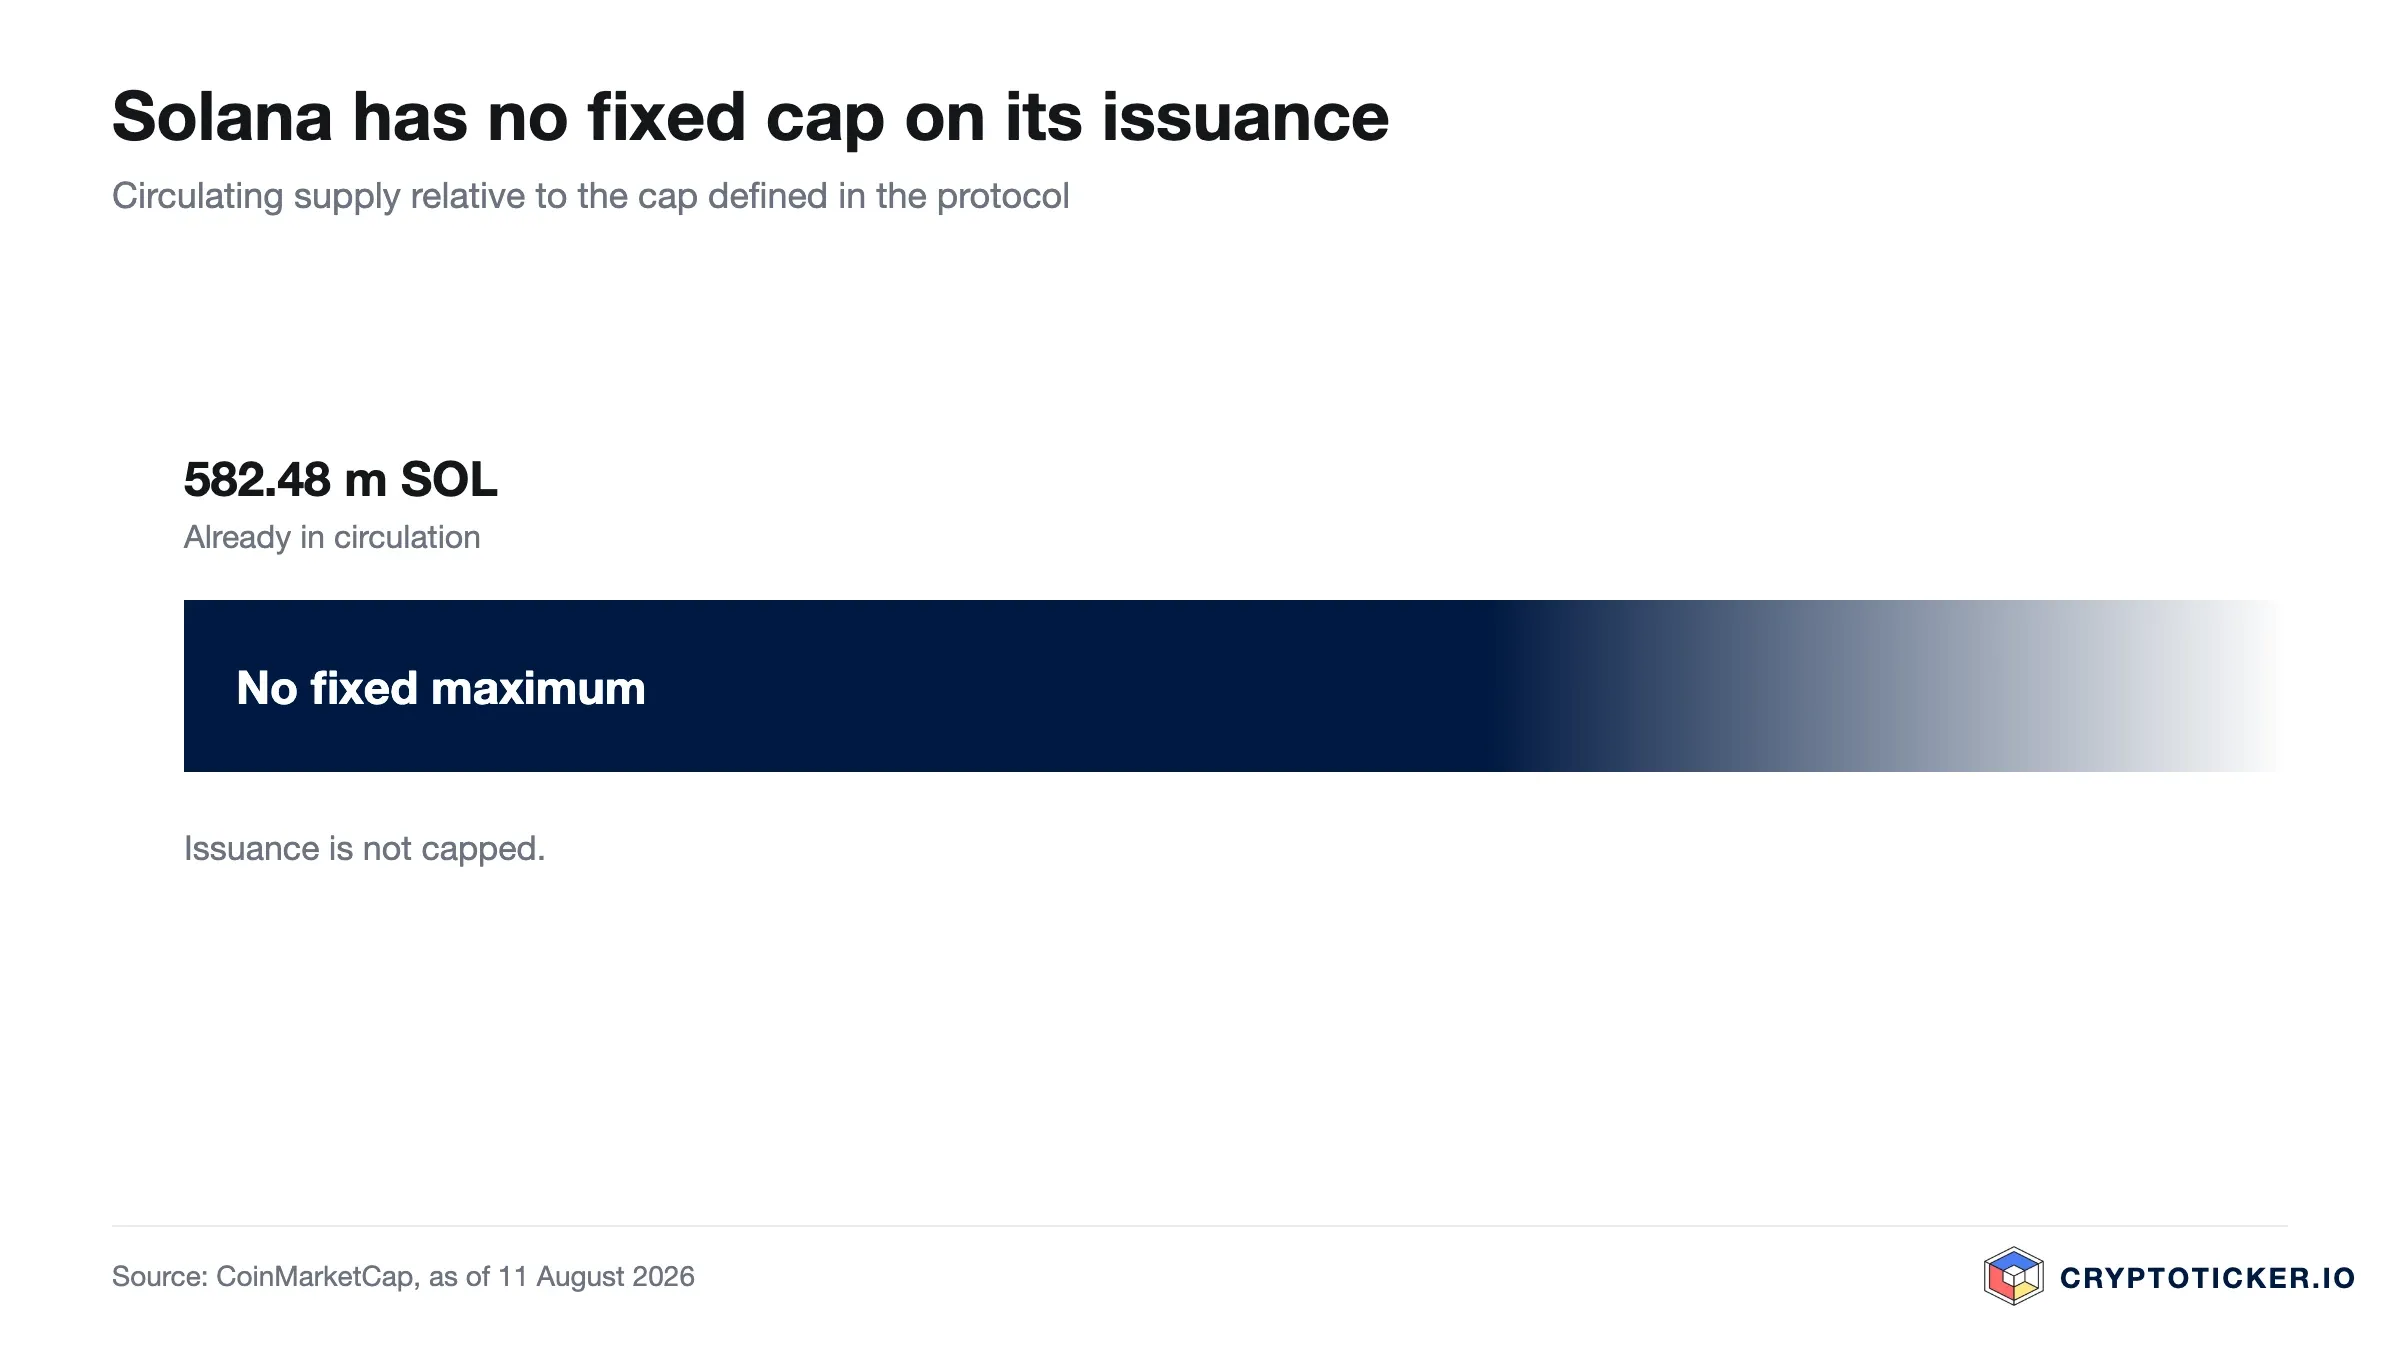
The second cause is the supply side. Solana continuously issues new units as a reward for securing the network. Issuance declines on a defined schedule, but it exists, and in a weak market it meets little demand. The mechanism is described in the protocol's official economics documentation. Unlike Bitcoin, Solana's supply side therefore works against the price rather than for it, as long as demand does not grow in step.
Which structural factors support Solana
Solana is built for high throughput at low fees, and that technical profile has an economic consequence: applications generating many small transactions can be settled there more cheaply than on networks with higher fees. This covers trading, payments and the representation of assets on a blockchain.
In that last field Solana has gained share over recent months. Representing equities and fund units as tradable tokens happens predominantly there, because the cost structure fits. For valuation this is the most interesting point, because it creates demand that does not originate inside the crypto market itself.
The honest caveat: usage and price are two different things. Low fees mean that a great deal of activity generates little revenue. A network can grow substantially without its token earning proportionally. For Solana this gap is structurally wider than for networks with higher fees.
What argues in favour of buying Solana at current prices
The drawdown of 47.8 percent from the twelve-month high is still the deepest among the three large crypto assets and sits in the range where Solana became interesting to long-horizon investors in earlier cycles. That is a historical observation, not a commitment.
The second point is the trend change itself. Since 22 August 2026 Solana has traded above its 200-day average, since 21 September 2026 the 50-day average has sat above it too, and it is up 67.9 percent from the June low at $62.18. The third point follows from that: with the 200-day average at $98.48 there is a checkable level at which this thesis can be disproved, rather than a stop 40 percent lower — the second one, the 50-day average at $106.66, has broken since this reading.
How longer-term scenarios follow from this, with methodology and weightings disclosed, is set out in our Solana price prediction, which also names where the calculation can fail.
What argues against buying Solana at current prices
Of the two caveats of previous months only one has been settled: the 50-day average sits above the 200-day average. The second remains open, because volume is not carrying the move but sits 19.3 percent below the monthly average. On top of that, the price has lost its short-term line: it sits 2.1 percent below the 50-day average, having still stood on it at the last reading. The RSI at 40.1 provides no contrarian case either, even though it has moved far back from the overbought zone; buying now means buying after a gain of 67.9 percent from the June low, some 17 percent below the interim high of the past 60 days. Over twelve months the price is still down 45.0 percent, so the move is a recovery inside a year that remains negative, not a confirmed new upward cycle. And ongoing issuance creates, as before, structural selling pressure that does not exist in this form with Bitcoin.
Then there is beta. If Bitcoin rolls over, a disproportionate decline in Solana is to be expected, just as the recovery has been disproportionate. Sizing the position like a Bitcoin position therefore means taking considerably more risk than the price levels suggest.
How to buy Solana at current prices
With Solana, the staking question matters as much as it does with Ethereum. Anyone committing coins to securing the network receives part of the new issuance and thereby offsets at least some of the dilution. Anyone who does not bears it in full. Whether a platform offers staking, on what terms and with which lock-up period, therefore belongs settled before the purchase.
The cost side follows the usual logic: trading fee, spread and withdrawal fee together determine the entry price. An overview ranked by cost, regulation and custody is available in our crypto exchange comparison.
For the European market, providers licensed under the European markets in crypto-assets regulation are the relevant candidates; the supervisor lists them in the public register of the European Securities and Markets Authority. Which ones qualify is set out in our comparison of regulated crypto exchanges. Our detailed assessment of one such provider is in the Kraken review.
So is Solana a good buy at current prices?
On the short-term question the answer has dimmed further since the last reading. The price has traded above its 200-day average since 22 August 2026 and the 50-day average has sat above it since 21 September 2026, so the dominant chart structure still holds. The price itself, however, has fallen below the 50-day average and sits 2.1 percent under it, volume sits 19.3 percent below the monthly average, and over 30 days there is a loss on the board for the first time since the summer. Of the two objections that left the trend change unconfirmed before, one is settled and one is open. The RSI at 40.1 is at least no longer an objection of its own: the recovery is no longer priced in. Buying now means buying no panic, but a trend that the longer average supports and participation currently does not.
For a long-term, staggered build-up Solana is the most speculative of the three and at the same time the one with the clearest economic story. Anyone who assumes that the representation of real-world assets on blockchains keeps growing, and that Solana holds its role in it, is buying today at roughly 52 percent of the peak price.
A smaller position than for Bitcoin seems appropriate to us, spread across several purchases, combined with staking to offset dilution and with a clearly defined point at which the assumption counts as refuted. The June low at $62.18 sits far too far away to serve as that point; closer and more practical is the 200-day average at $98.48, below which the price should not settle back after a durable trend change. That the distance to it has narrowed to roughly 6 percent is part of the calculation: the setback has made the entry cheaper and the test point nearer, and it has taken the 50-day average out of play as an intermediate step.
Buying Solana: what to take away
- Test the oversold claim against numbers, not headlines. The RSI stands at 40.1, below the midline but far above the oversold mark of 30. Neither a low price nor a loss of 6.1 percent in a month is a signal on its own. The scenarios that follow from the data, with weightings disclosed, are in our Solana price prediction.
- Build issuance into your return expectations. Solana dilutes continuously. Anyone not staking bears that dilution in full. The terms offered by the venues are set out in our exchange comparison.
- Size the position by beta, not by price level. Solana moves more than Bitcoin, in both directions. Buying through a licensed provider at least contains counterparty risk; which ones qualify is shown in our comparison of regulated crypto exchanges.
Disclosure: Some of the providers mentioned in this article work with us through partner programmes. This has no bearing on the price analysis or the assessment of the chart; the price data comes from a public market data source and can be verified there.
(As of 20 October 2026. This article is not investment advice. Prices, fees and terms change; check them with the provider before every purchase. Crypto assets are subject to high volatility and a total loss is possible.)
Transparency note: This article was produced with the assistance of artificial intelligence and reviewed by our editorial team before publication. All figures and claims were checked against the primary sources linked in the text. The feature image was generated with AI.
More on Solana: All Solana news at a glance
Related articles
- Is Ethereum a Good Buy at Current Prices?
- Solana Price Prediction: Can SOL Reclaim $100 before March 2026?
- Is Solana a Good Buy in 2026? SOL Price Analysis and Potential ROI
- Solana (SOL) Price Prediction: Can SOL Reclaim $76 and Target $90 — or Is $60 Back in Play?
- Solana at a Seven-Month High: Why SOL Is Rising Twice as Fast as Bitcoin and What Stakers Should Check
Which topics should we dive deeper into?
Select what genuinely interests you. Your picks feed directly into our editorial planning.
Crypto news that's actually worth your time.
Weekly. 60 seconds. Carefully curated by our editors: no hype, no promo flood, no spam.

June 25, 2024 6:26 PM

Solana Price Prediction: Will SOL Surpass 200$?
Why Solana, Shiba Inu, and Cardano are poised for a major rebound, according to the latest market analysis. Can Solana capitalize on the buy signals and reach a new price target?

May 10, 2026 1:29 PM
Solana Price Eyes $100 Breakout as Bitcoin Solidifies Gains Above $80k
Solana (SOL) targets the $100 psychological level while Bitcoin (BTC) holds firmly above $80,000, signaling a major shift in the 2026 crypto market structure.
July 2, 2024 5:13 PM

Solana Price Prediction And Analysis Following SOL Liquid Staking
Solana’s growing liquid staking is influencing SOL’s price. Solana price prediction and analysis following the staking is crucial, so here is what's next for SOL price...
March 15, 2025 12:01 PM

Solana Price Prediction 2025: SOL Price Breakout to NEW ATH as Cup and Handle Pattern Shapes Up
Don't miss out on Solana's technical analysis as it forms bullish patterns and approaches key support and resistance levels, indicating potentially significant SOL price movements.
March 23, 2026 10:41 AM

SOL Price Prediction: Key Levels to Watch in late March 2026
Solana (SOL) battles $90 resistance as institutional ETF inflows hit $1.45B. Explore key support levels and the impact of the Alpenglow upgrade on SOL price.
September 10, 2024 9:31 AM
Solana Regains Strength But Can It Push SOL Price Over $150
Solana shows signs of recovery, but can it push toward $150 or even $200? Analyzing these key technical and market factors impacting SOL’s price movement will help you predict SOL's future.
September 20, 2024 10:51 AM
Token 2049 Boost Solana Pushing SOL Price Past $150, Can Solana hit $200 Next?
Solana price has soared following major announcements at Token2049, but can SOL hit $200 by October?
July 19, 2024 9:35 AM

Solana Price Prediction: Will SOL Price Reach $200 Amid Market Fluctuations?
Solana's potential for a bullish breakout amid market fluctuations is high. Analyst predicts a rise to $175 or more as Solana navigates key resistance levels. Here is the full Solana price analysis...
June 4, 2024 12:42 PM

Solana (SOL) Price Prediction For June 2024
How will Solana (SOL) perform this June? Here are some key technical insights and on-chain activity that could drive its price trajectory.
November 17, 2024 3:29 PM

Solana Price Prediction: Will History Repeat Itself For SOL Price This November?
Within the current market explosion, Solana price remains in focus and speculations about whether can SOL reach a new ATH after 3 years?
October 5, 2026 2:14 PM
Top 5 Altcoins to Buy in October 2026: These Coins Could Rally Next
October 2026 could be the month altcoins finally wake up. These are the top 5 altcoins to buy now, with current prices and the catalysts behind them.
September 1, 2026 11:14 AM

XRP Price Falls 8% in a Week: Is This Dip Actually Worth Buying?
XRP gave back 8% this week after a violent August melt-up. Here is what really drove that rally, what the chart says now, and what buying here depends on.
July 31, 2024 10:08 AM

SOL Price Prediction: Did Solana Rank Drop Back to 5 Due To The SEC Recent Update?
Solana's rank dropped back to 5th position despite last week's surge in market cap leading it to the 4th position. Did SEC's recent updates lead to this drop?
July 22, 2024 10:10 AM
Solana Price Prediction: After Surpassing $180 Mark, When Is $200?
Solana (SOL) has surged past $180, aiming for further gains. Can SOL reach the $200 target?

July 20, 2025 6:53 AM
Don’t Ignore This Solana Price Rally
Solana is on the move, breaking out of consolidation with strong bullish momentum.
July 6, 2025 6:55 AM
Solana in Danger: Will SOL Plunge Below $120?
Solana’s price is stuck in a tight zone but one breakout could send SOL flying to $200 or crashing below $120.
September 18, 2026 4:41 PM
Solana Price Prediction: Why SOL Is Setting Up for $120
Solana just tagged $110 and the 200 EMA is rising. Here is what the SOL chart says about $120 and what has to hold first.
June 29, 2025 3:32 PM
Should You Buy Solana Now Before It Pops?
With fresh momentum building and key levels in sight, is SOL about to surprise traders with a sharp move higher?

August 11, 2026 5:35 PM

Is Bitcoin a Good Buy at Current Prices?
Bitcoin trades about 28 percent below its twelve-month high and has reclaimed both moving averages. What chart structure, RSI and trading volume say about buying at current prices.
September 21, 2026 10:19 PM

Solana at a Three-Month High: What Is Holding the SOL Price Up as ETF Inflows Dry Up
Solana trades above every hourly price of the past 90 days and leads the five largest coins over one month. ETF inflows have shrunk to a fraction since the end of August. What is moving the price instead, where the levels sit, and what to check before you buy or stake.
September 2, 2024 9:13 AM
Solana Price Analysis: What Will Happen To SOL Price This September 2024?
With Solana facing significant bearish pressure, what can investors expect in September 2024? Here are the key support and resistance levels that could determine SOL’s next move...
June 28, 2024 12:25 PM

Solana News Today: Why is Solana Price up 10%?
Why is Solana's price up by 10%, despite the downtrend in the market? And what's behind the current optimism breaking key resistance levels?
January 17, 2026 4:44 PM

$1,000 in Solana in January 2026: How Much Could You Have in 5 Years? The September Check
Anyone who put $1,000 into Solana on 17 January 2026 bought about 6.94 SOL at $144. In September that is worth about $840: SOL fell to $62 in June before recovering.
March 24, 2025 6:00 AM

SOLANA May Be a Top Crypto Investment for April 2025, Here's WHY?
Solana is emerging as one of the top crypto investments. Here is a Solana price prediction and key levels to watch in April 2025.
July 28, 2024 4:04 PM

Solana Crypto Surge: How Did Solana Take Over BNB?
How did Solana (SOL) grow so fast and surge past Binance Coin (BNB) to become the fourth largest cryptocurrency? Here is how it happened...
More from CryptoTicker