
Is Cronos a Good Buy at Current Prices?
As of November 11, 2026: Cronos has fallen below both moving averages and trades just above its twelve-month low. We check with our own calculations what speaks for and against buying.


Which topics should we dive deeper into?
Select what genuinely interests you. Your picks feed directly into our editorial planning.
Crypto news that's actually worth your time.
Weekly. 60 seconds. Carefully curated by our editors: no hype, no promo flood, no spam.
As of 11 November 2026: Cronos with updated figures
Cronos closed at $0.0471 on 10 November 2026, 31.7 percent below the $0.0690 on which the analysis below, dated 1 October 2026, is based. The figures in this section are daily closing prices from CoinGecko; cryptoticker.io calculated the moving averages and the RSI from them.
| Metric | 10 November 2026 |
|---|---|
| Closing price | $0.0471 |
| 50-day average | $0.0551 |
| 200-day average | $0.0628 |
| RSI (14 days) | 30.4 |
| Change over 30 days | −22.4% |
| Change over 90 days | +0.9% |
| Twelve-month high | $0.1253 (11 November 2025) |
| Twelve-month low | $0.0462 (18 August 2026) |
| Daily trading volume (30-day average) | $5.5 million |
That puts Cronos 14.5 percent below its 50-day average and 25.0 percent below its 200-day average. The 14-day relative strength index stands at 30.4, just above the 30 mark at which a market is often considered oversold. Trading volume averaged around $5.5 million a day over the past 30 days, below the 90-day average of around $8.5 million.
The October 1 analysis named two marks: a close below the 200-day average of $0.0681 at the time invalidates the assumption of a further recovery, and below the 50-day average of $0.0602 it counts as having broken down for good. Both have happened, since 6 October and since 12 October. The price is now only around 2.0 percent above the twelve-month low of $0.0462 from 18 August 2026, the mark the analysis named as support. On the RSI, the market counts as heavily oversold; whether $0.0462 holds is now the decisive question.
The sections below reflect the situation as of 1 October 2026.
Cronos (CRO) changes hands at 0.0690 US dollars on 1 October 2026. That price sits roughly 68.4 percent below the twelve-month high of 0.2181 dollars set on 3 October 2025, and about 49.4 percent above the twelve-month low of 0.0462 dollars printed on 19 August 2026. A gain of 25.8 percent over 30 days has carried the token above its 200-day average for the first time since the spring. The question here is narrower than the headline move suggests: is Cronos a good buy at the current price?
cryptoticker.io collected the underlying price data itself on 1 October 2026, from the 365 daily closing prices of the preceding year plus the current spot quote. The exponential moving averages and the relative strength index are derived from those closes using the standard formulas. Every figure below refers to that snapshot and will move with the market. A longer-dated view sits in our Cronos price prediction.
Cronos price analysis: where the CRO price stands and which levels matter
Three levels frame the current picture. The floor is the twelve-month low at 0.0462 dollars, set six weeks ago and therefore the most recent point at which sellers ran out of conviction. The current zone around 0.0690 dollars sits about 14.6 percent above the 50-day exponential moving average of 0.0602 dollars, which the price reclaimed in August and has held since. Overhead there is no longer an untouched barrier: the 200-day exponential moving average at 0.0681 dollars now lies 1.4 percent below the spot price, after standing 18 percent above it in the summer.
The distance between the averages tells its own story. With the 50-day line at 0.0602 dollars and the 200-day line at 0.0681 dollars, the shorter average remains 11.6 percent below the longer one, a configuration conventionally read as a market still inside a downtrend however convincing the breakout above the long average looks. The gap is narrowing, though, because the short line is rising while the long one still falls.
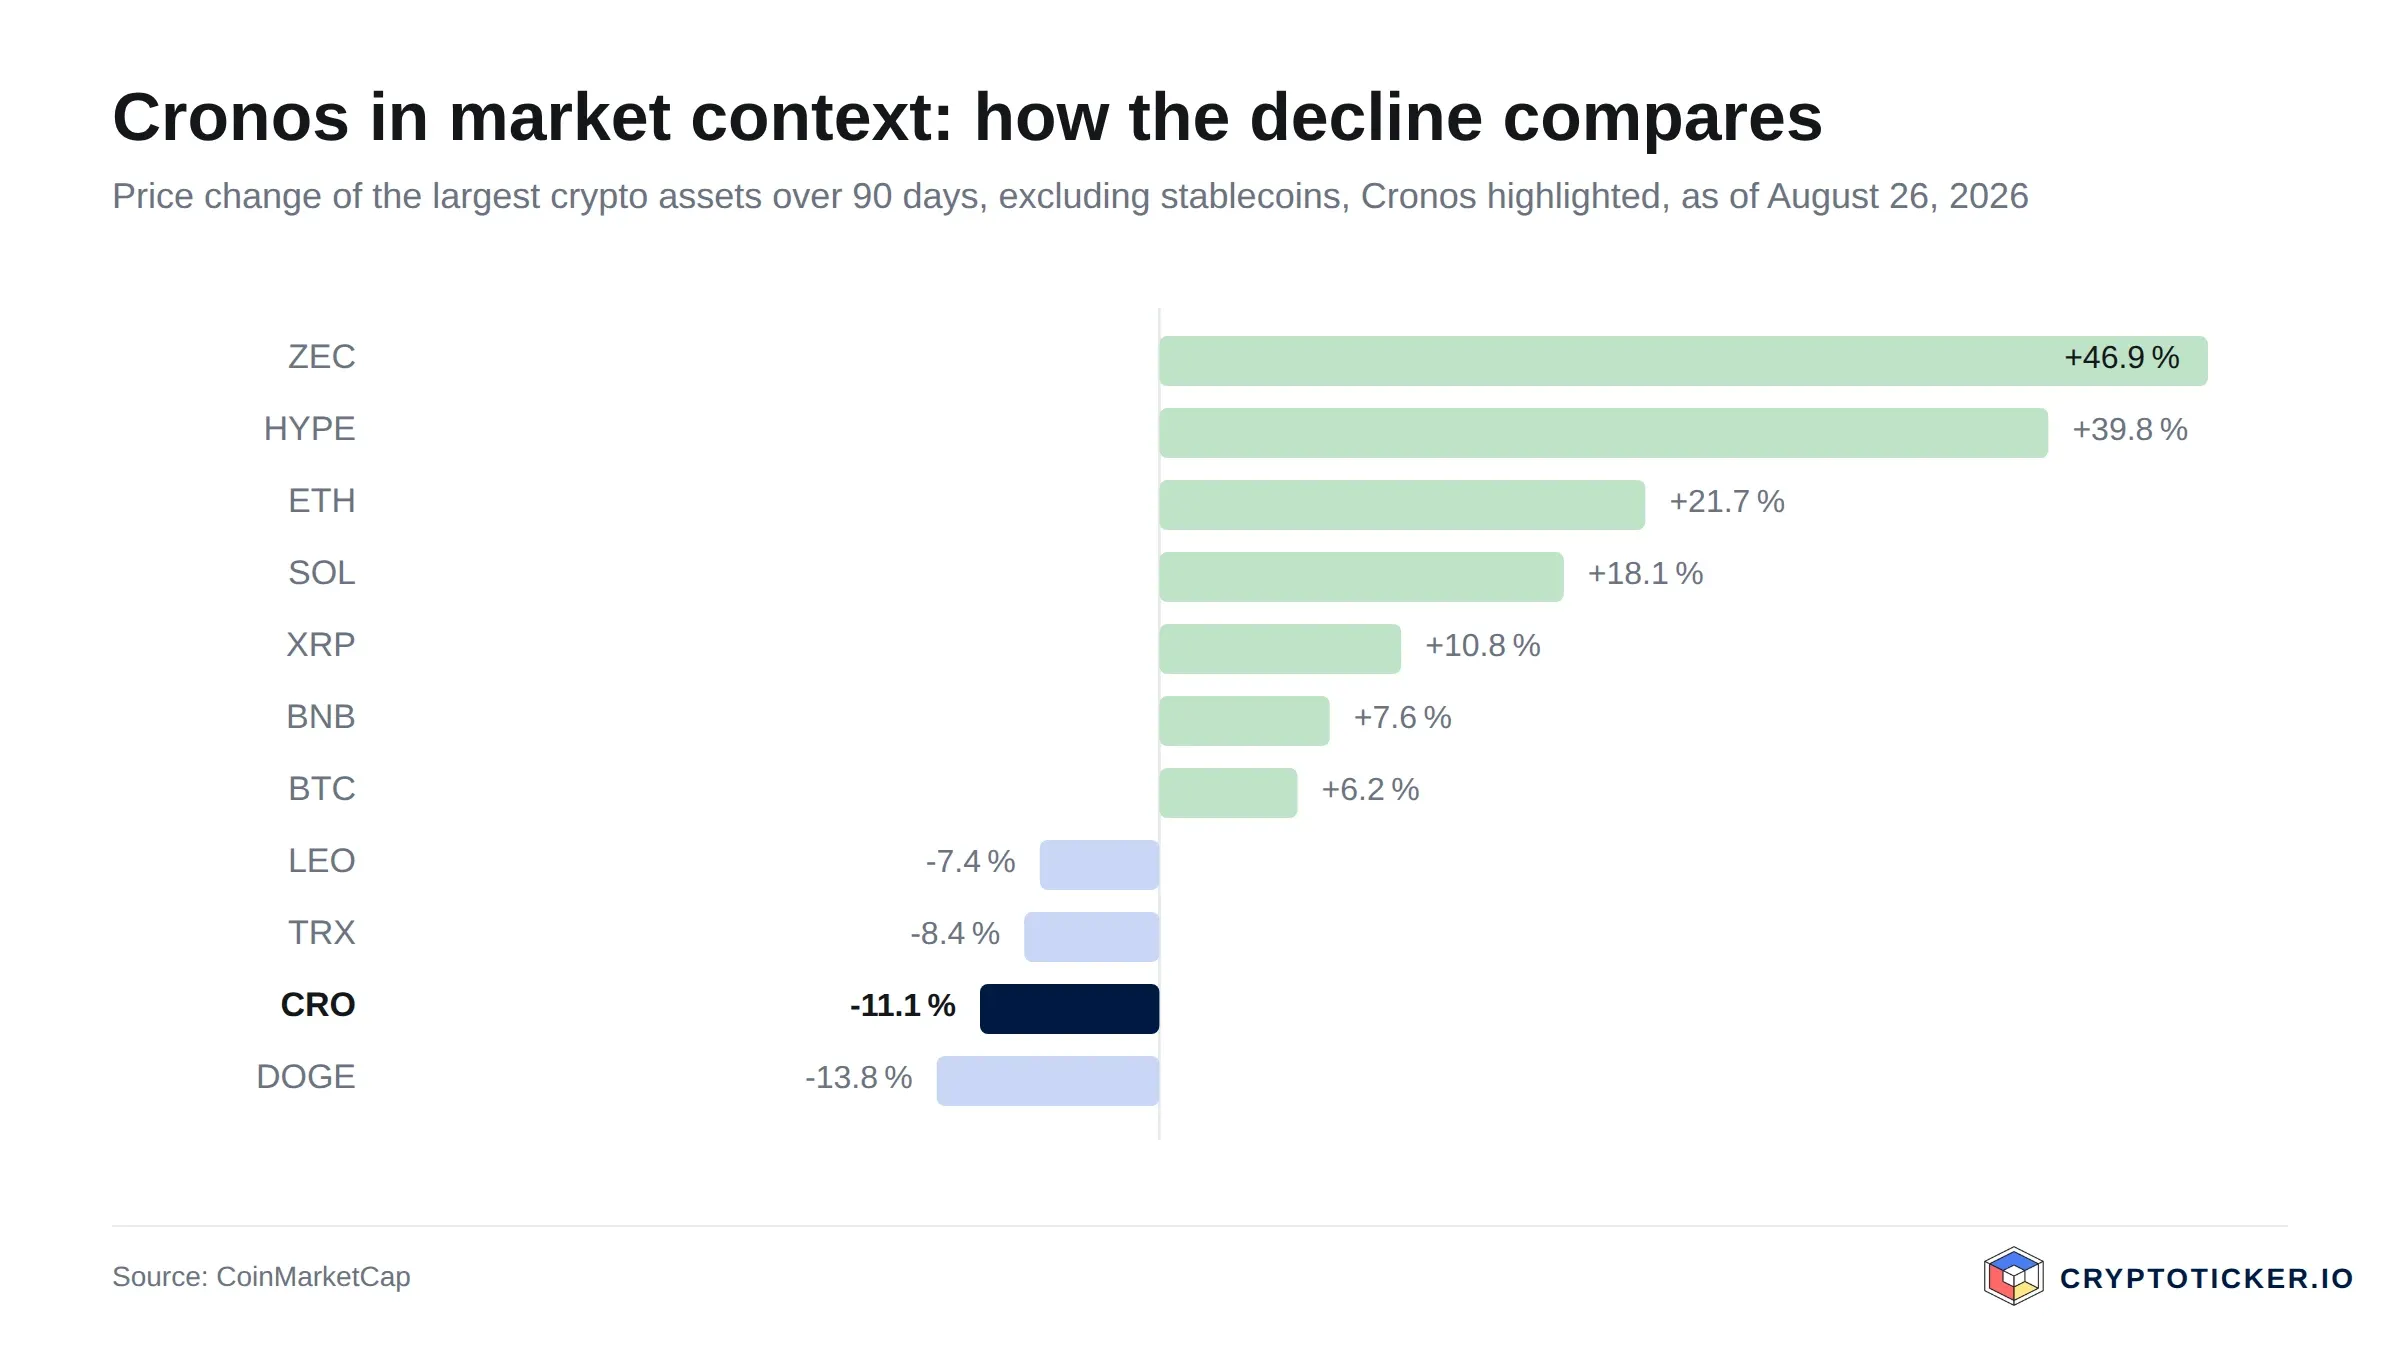
The twelve-month range puts the move in proportion. From 0.2181 dollars down to 0.0462 dollars is a drawdown of about 79 percent, and the recovery to 0.0690 dollars retraces only part of it. Cronos is down about 68.4 percent over 365 days, while gaining 13.6 percent over 90 days, 25.8 percent over 30 days and 9.9 percent over seven days.
Is the Cronos downtrend broken or only interrupted?
A downtrend is usually treated as broken when price closes above the long-term average and the sequence of lower highs ends. The first condition is now met, the second is not. At 0.0690 dollars, CRO trades above the 200-day line at 0.0681 dollars, but the margin is 1.4 percent and no higher low has formed above that line yet. The 50-day average at 0.0602 dollars was reclaimed back in August and is no longer the question.
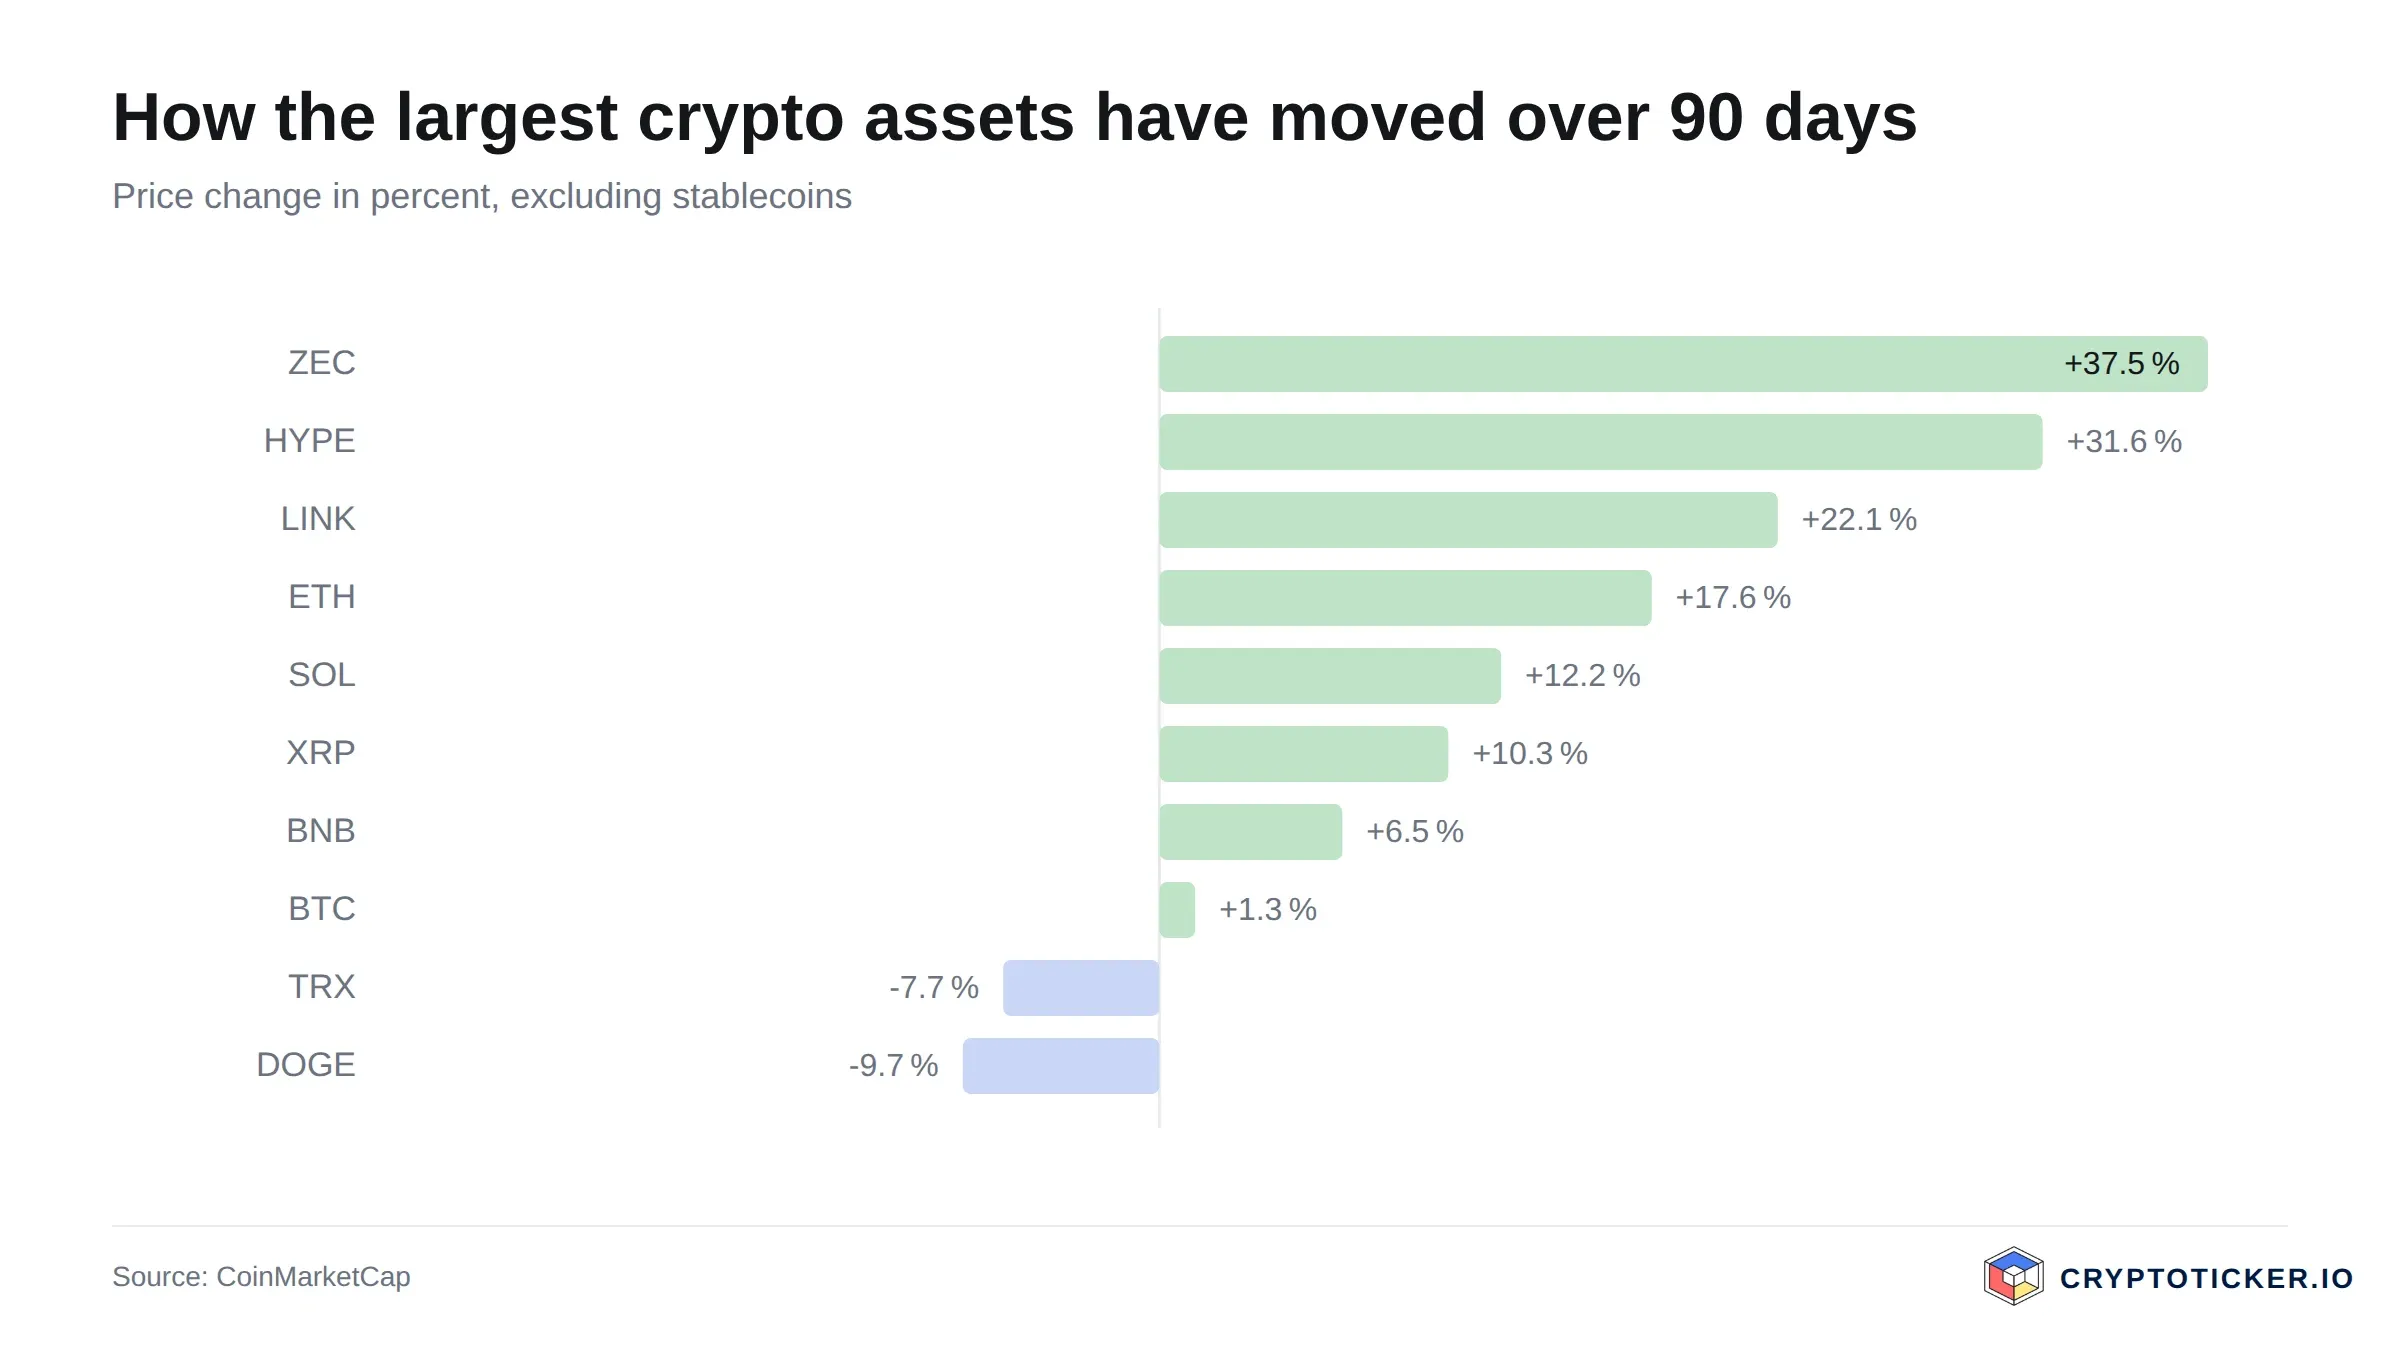
That distinction matters for anyone sizing an entry. An interruption can last weeks and still resolve downward; a break requires measurable follow-through, here several closes above 0.0681 dollars and a pullback that holds there. Until then the prudent description is a young breakout out of a downtrend that is damaged rather than finished.
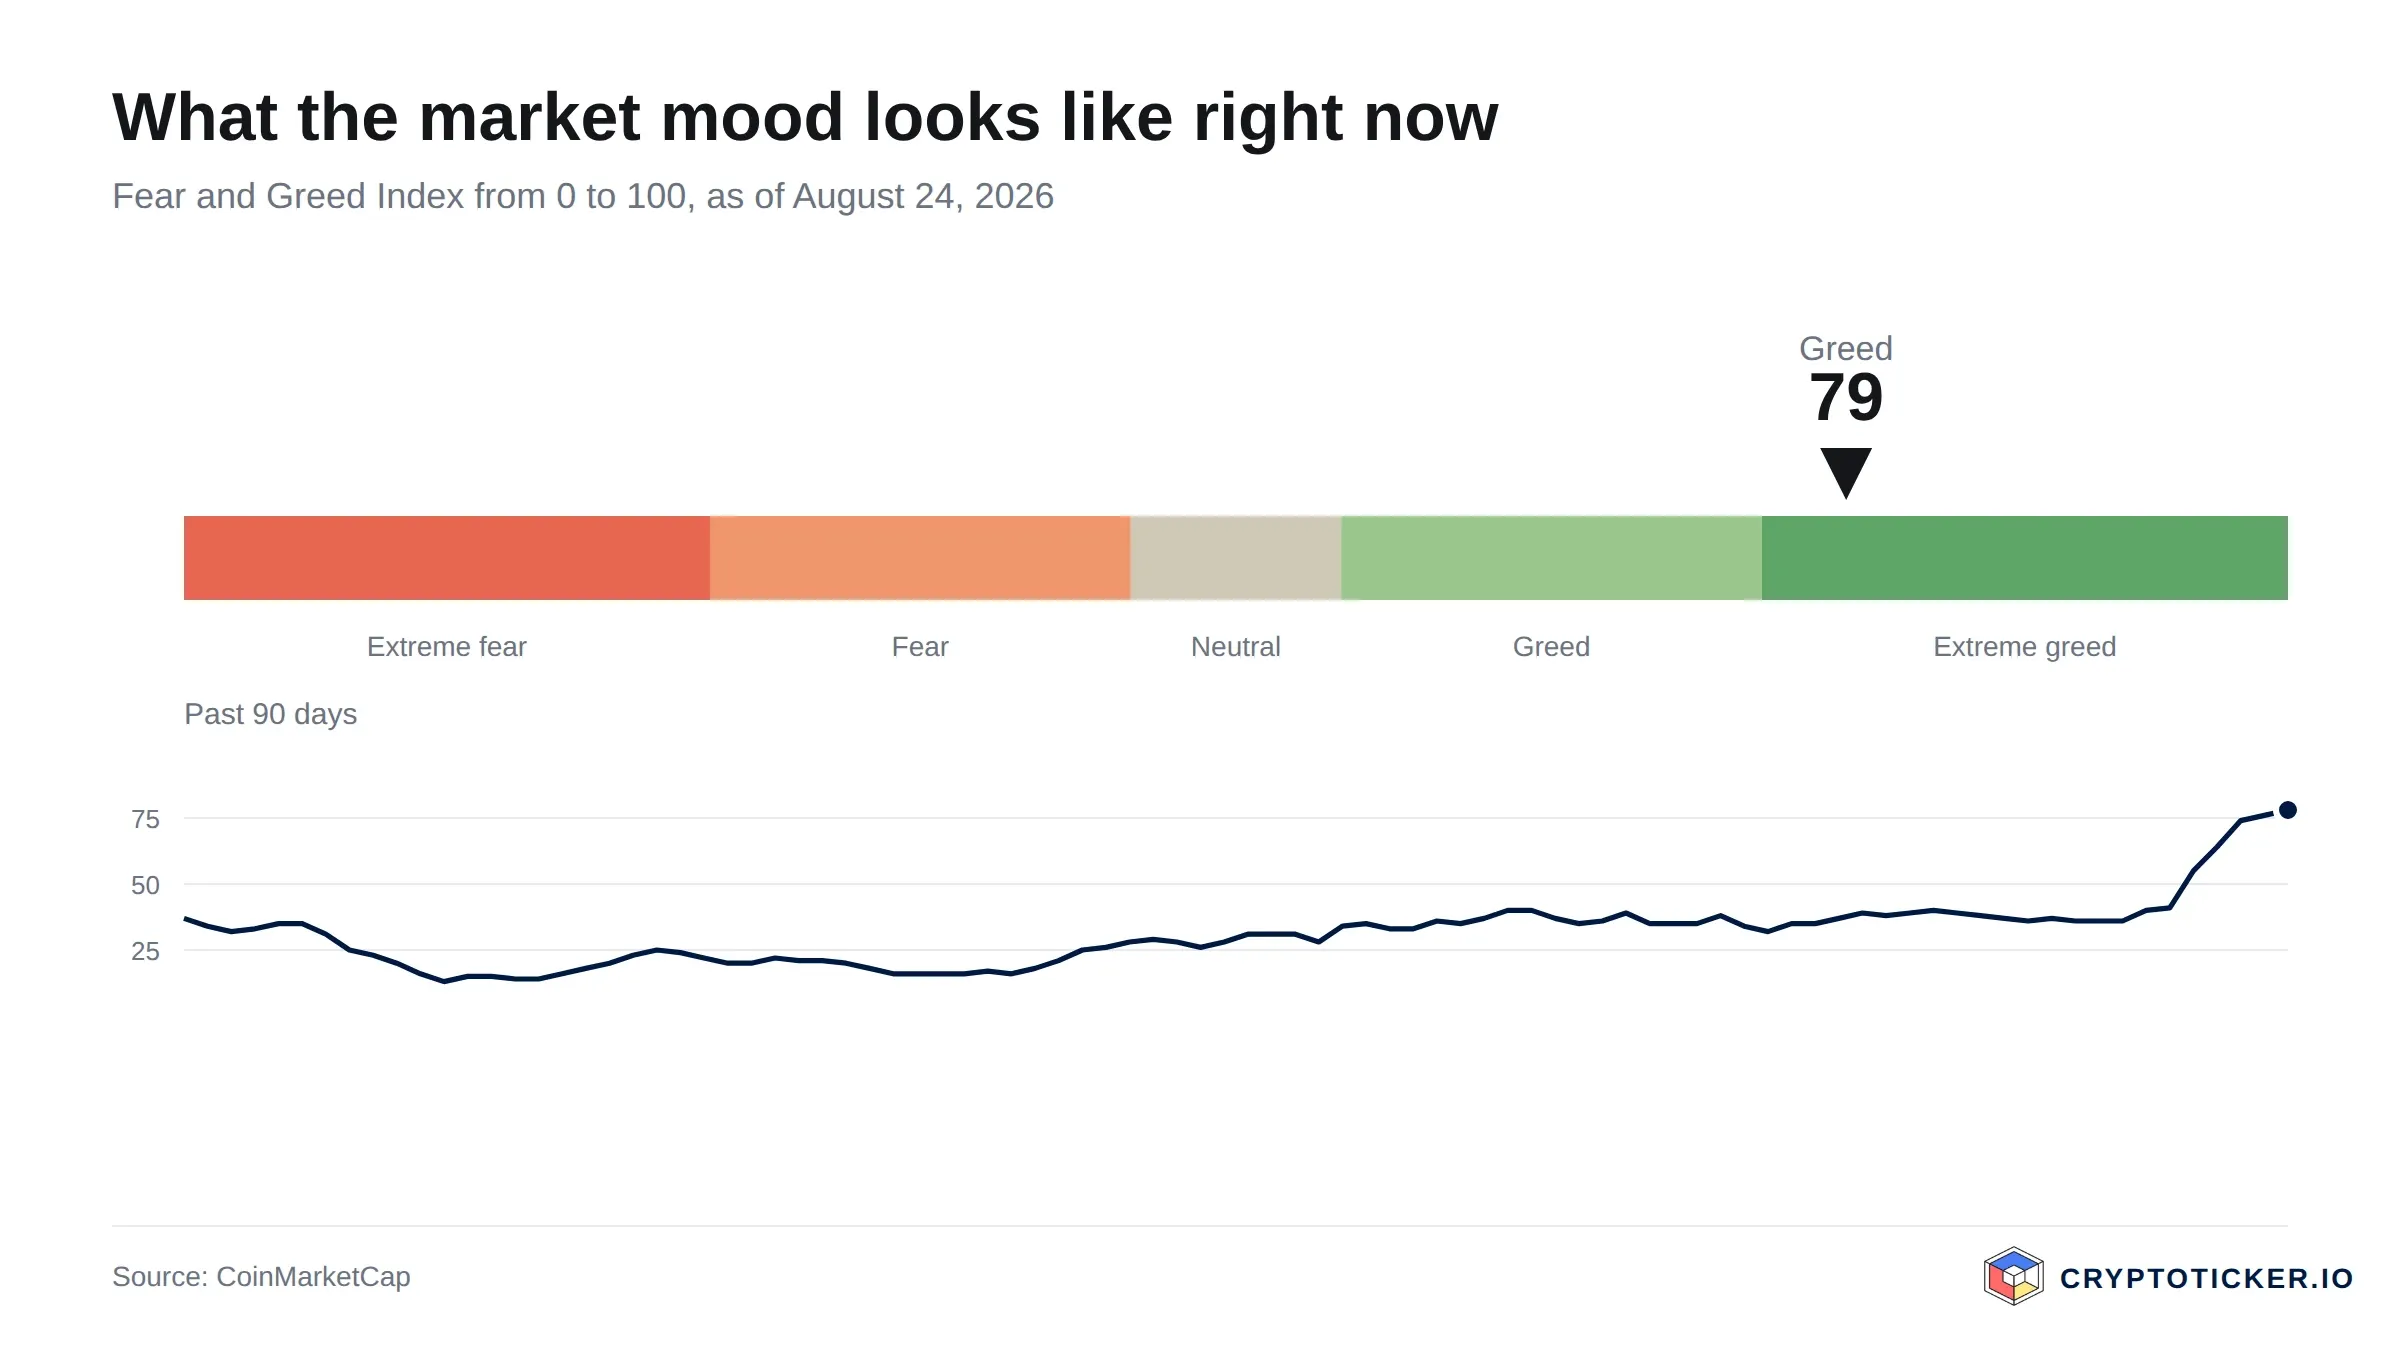
A second reading is worth stating as an inference rather than an observation: much of the 30-day move arrived alongside a broad risk-on phase, with the Fear and Greed reading at 74, in greed territory. Rallies that ride sentiment rather than token-specific news tend to give back ground when sentiment normalises. That is a plausible explanation, not a proven cause.
What RSI and moving averages mean for a Cronos entry
The 14-day relative strength index stands at 62.3. That is the upper half of the neutral band and below the 70 mark at which the indicator is conventionally described as overbought. In August the reading was above that mark while the price was lower, so the token has digested its advance rather than extending it: price higher, indicator lower. In strong trends RSI can stay above 70 for extended stretches; in countertrend bounces it more often marks the upper half of the move.
Combined with the moving averages, the picture is a token that has worked its way through its resistance band and is now sitting on top of it. Entry at 0.0690 dollars means buying about 14.6 percent above the 50-day average at 0.0602 dollars and 1.4 percent above the 200-day average at 0.0681 dollars. The asymmetry has improved since the summer but has not disappeared: the nearest support is the 200-day line a whisker below, then the 50-day line, and beneath both the twelve-month low at 0.0462 dollars, roughly 33 percent below spot.
For a longer horizon the indicator readings carry less weight than the range itself. A buyer at 0.0690 dollars pays less than a third of the 0.2181 dollar high and roughly half again more than the 0.0462 dollar low. Whether that is cheap depends on what the network is worth, which the chart cannot answer.
What Cronos trading volume reveals about demand
Reported 24-hour turnover is about 15.4 million dollars against a market capitalisation of roughly 3.43 billion dollars, which places CRO at rank 36 by size. That ratio, near 0.45 percent, is thin for a token of that capitalisation, and it is the single most important qualifier on everything above.
Thin turnover has two consequences. A rally on low volume moves price further per dollar of buying, which flatters the percentage gain. And an exit in size is harder to execute at the quoted price, because the book that produced the move up is the same one that has to absorb selling. Anyone reading the 25.8 percent monthly gain as broad accumulation should weigh how little capital was required to produce it: the thirty-day average turnover was 11.2 million dollars, and the ninety-day average 9.2 million.
Advertisement: Crypto futures trading: Bitget offers leverage of up to 100x. Leverage can lead to high losses. Our exchange comparison shows more platforms.
Which structural factors speak for Cronos
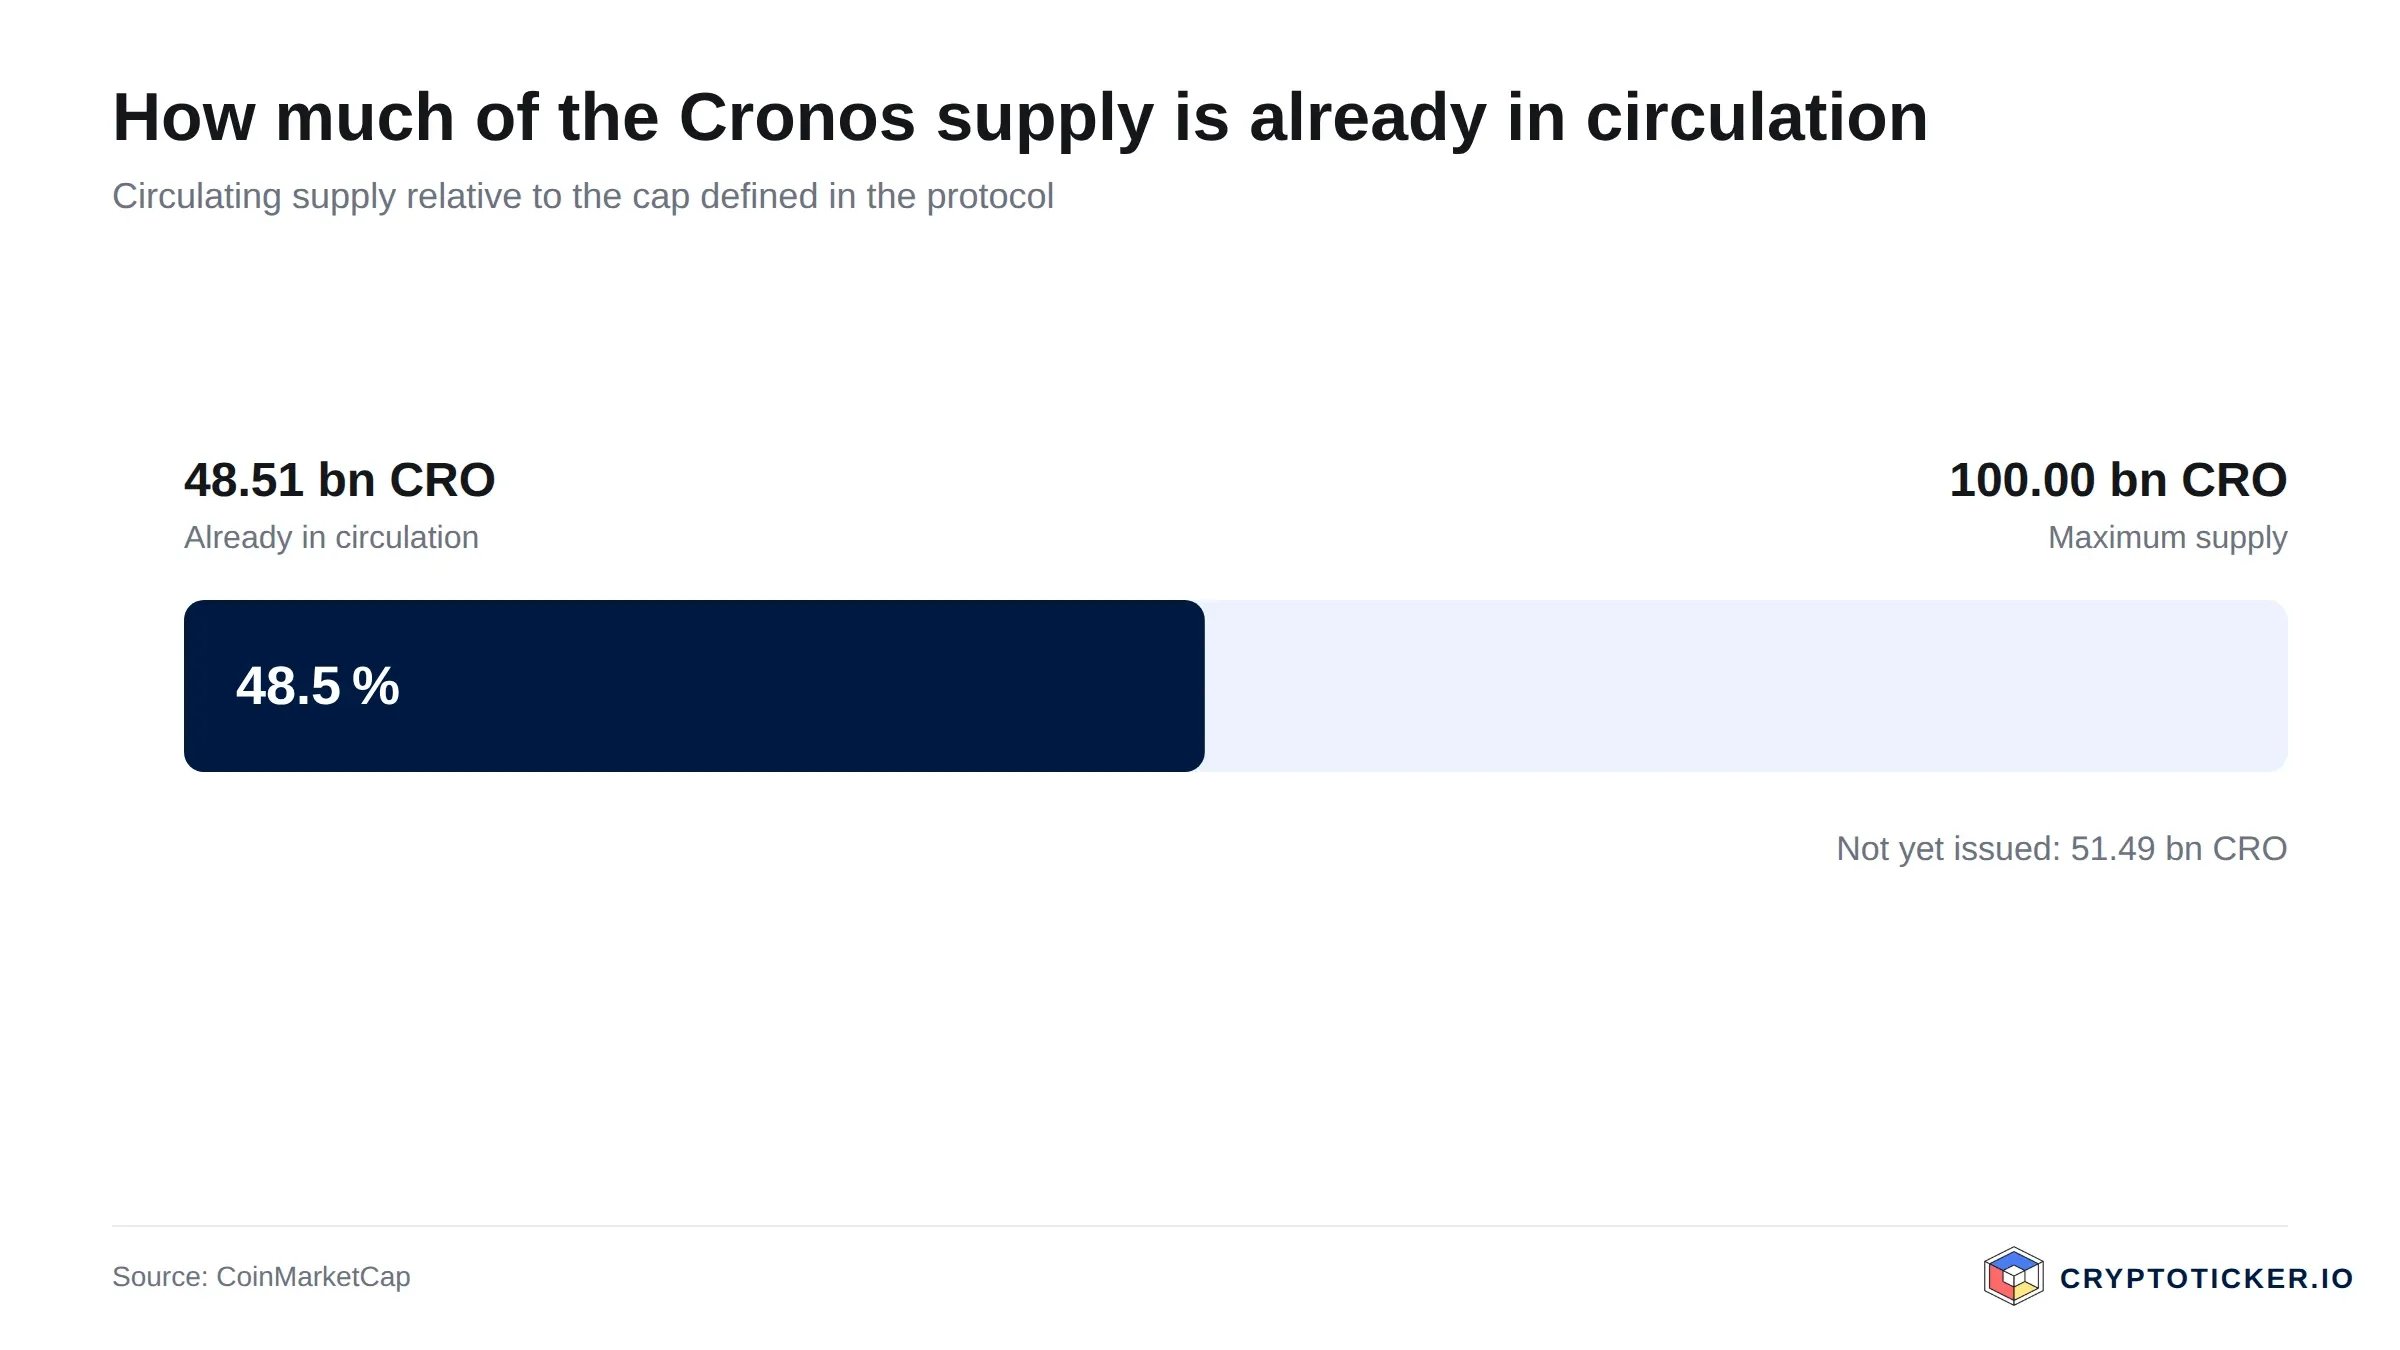
Three structural features distinguish CRO from a pure momentum token. The first is supply mechanics. Circulating supply stands at about 49.75 billion tokens against a total of roughly 98.95 billion and a stated maximum of 100 billion. The float that trades today is therefore a minority of the tokens that could eventually trade. That is a fact about the supply schedule rather than a prediction, and its effect on price depends on release pace and on demand at the time of release.
The second is the chain's technical position. Cronos runs an Ethereum-compatible execution environment, so contracts and tooling written for Ethereum deploy with limited modification. The upside is a developer base the network did not have to build; the downside is direct competition with every other chain making the same offer, on fees and liquidity rather than capability. The ecosystem it borrows from is documented on the Ethereum roadmap.
The third is regulatory placement. CRO is closely associated with a large regulated exchange business operating inside the European framework for crypto-asset markets published by ESMA. That cuts both ways: it lowers the risk of an abrupt delisting across regulated venues, and it ties the token's fortunes to a single commercial entity's performance.
What speaks for buying Cronos at current prices
- The entry sits far below the twelve-month range high. At 0.0690 dollars, buyers pay about 68.4 percent less than at the 0.2181 dollar high of October 2025. For an investor who believes the network retains value, a price this deep in its own range is a materially better starting point than any level over the past year.
- The long-term average has been reclaimed. Closing above the 200-day average at 0.0681 dollars is the condition this recovery still owed in the summer, when the price was 18 percent below that line. It has now been met, and it gives a clearly defined level immediately beneath the current price against which a position can be measured.
- The exchange linkage provides a revenue-bearing anchor. Unlike tokens whose value rests solely on future network usage, CRO is tied to an operating business with fee income and a regulated footprint. That does not guarantee a price floor, but it means the token's fundamental case can be assessed against something observable.
What speaks against buying Cronos at current prices
- The reclaim is wafer-thin. With price at 0.0690 dollars and the 200-day average at 0.0681 dollars, a decline of a couple of percent undoes it, and the 50-day average at 0.0602 dollars still sits below the long one. The 33 percent gap down to the 0.0462 dollar low defines how far a failed breakout can travel.
- Liquidity is thin for the size. Roughly 15.4 million dollars of daily turnover against a 3.43 billion dollar capitalisation makes both the upside move and any future exit less reliable than the headline market rank suggests.
- Half the maximum supply has yet to enter circulation. About 49.75 billion of a possible 100 billion tokens trade today. Any future increase in the circulating float is a headwind that demand has to absorb before price can advance.
 Compare MiCA-regulated crypto exchanges
How to buy Cronos at the current price
CRO is listed on most large regulated European venues, so the practical differences are fees, spread and custody rather than availability. Spot fees typically fall between 0.1 and 0.5 percent per trade, and the spread on a thinly traded token often costs more than the stated commission. Our exchange comparison sets the current terms side by side, and the shortlist of regulated exchanges narrows it to venues under European supervision. Two of them are covered in our Kraken review and our Bitvavo review.
Custody is the second decision. Leaving tokens on the exchange is convenient and carries that venue's operational risk; self-custody removes it and transfers key management to the holder. For positions held through a full cycle a hardware wallet is the standard answer, and the devices are compared in our hardware wallet comparison. Note that CRO exists on more than one network, and sending it to an address on the wrong one is the most common way holders lose tokens permanently.
Given the liquidity profile described above, a position built in a single market order will pay a wider spread than the same position built in parts. Fees, spreads and terms change; check them at the provider before every purchase.
Is Cronos a good buy at current prices, short term and long term?
Update of 11 November 2026: this assessment reflects the situation as of 1 October 2026. By the analysis’s own yardstick, the recovery has broken down: Cronos has closed below $0.0681 since 6 October and below $0.0602 since 12 October. The current assessment is in the section “As of 11 November 2026” at the top of the article.
Short term, the picture has improved since the summer without becoming comfortable. At 0.0690 dollars the token has already travelled 49.4 percent from its low, but the RSI at 62.3 no longer signals an overbought market, and the 200-day average at 0.0681 dollars has changed sides: it is support now, not resistance. A short-term buyer is paying up for a move that has largely happened, yet with an unusually close level at which to admit being wrong. The reading would change for the worse on a daily close back below 0.0681 dollars, and decisively so below the 50-day average at 0.0602 dollars.
Long term, the assessment turns on the exchange linkage and the supply schedule rather than the chart. At a capitalisation near 3.43 billion dollars the token is priced far below its 2025 valuation, and an investor expecting the associated business to grow inside the European framework buys that expectation at a steep discount to last year's price. That case would be refuted by a sustained fall below the 0.0462 dollar low, by circulating supply expanding materially faster than demand, or by a durable decline in the exchange business the token is tied to.
Neither reading amounts to a recommendation. The short-term technical setup and the long-term structural case have moved closer together than they were in August, but a breakout one and a half percent deep is not yet a trend change, and which reading matters depends on the holding period the buyer actually intends.
Buying Cronos: what to take away
- At 0.0690 dollars CRO trades above its 50-day average of 0.0602 dollars and above its 200-day average of 0.0681 dollars, which describes a young breakout rather than a settled uptrend. The level that would reverse that description is 0.0681 dollars, and the longer-dated view is set out in our Cronos price prediction.
- Roughly 15.4 million dollars of daily turnover against a 3.43 billion dollar capitalisation is thin, which affects both entry and exit. Where you trade therefore matters more than usual, and the current terms are compared in our exchange comparison.
- With about 49.75 billion of a possible 100 billion tokens in circulation, supply expansion is a standing headwind for any multi-year position. Holdings intended for that horizon belong in self-custody, and the devices are compared in our hardware wallet comparison.
Disclosure: Some of the providers mentioned in this article work with us through partner programmes. This has no influence on the price analysis or on the assessment of the chart situation; the price data comes from a public market data source and can be verified there.
(As of 11 November 2026; analysis as of 1 October 2026. This article is not investment advice. Prices, fees and terms change; check them with the provider before every purchase. Crypto assets are subject to high price volatility and a total loss is possible.)
Partner links: some links on this page are partner links. If you become a customer through one of them, we may earn a commission at no extra cost to you. Selection, ratings and ranking are decided independently by our editorial team. Ethics and Independence · Ownership and Funding
Transparency note: This article was produced with the assistance of artificial intelligence and reviewed by our editorial team before publication. All figures and claims were checked against the primary sources linked in the text. The feature image was generated with AI.
For later? Save this article and find it again in your profile.
Related articles
- Is Jupiter a Good Buy at Current Prices?
- Will Bitcoin Go Back Up? Three Scenarios to Year-End: $70,000, $80,000 or $100,000
- Is Aerodrome Finance a Good Buy at Current Prices?
- Solana Price Below $95: Record ETF Outflows and Whale Selling Push SOL to a 7-Month Low
- Ethereum Price Below $2,300: Is $2,000 Next or Is This the Bottom?
Which topics should we dive deeper into?
Select what genuinely interests you. Your picks feed directly into our editorial planning.
Crypto news that's actually worth your time.
Weekly. 60 seconds. Carefully curated by our editors: no hype, no promo flood, no spam.

November 2, 2026 11:37 PM

Cronos (CRO) burns 1.79 million tokens in its first monthly buyback, 0.0035 percent of supply
On October 30, Cronos for the first time bought back and destroyed its own tokens from ongoing revenue: 1,791,534.14 CRO for around $92,000. The amount equals 0.0035 percent of circulating supply, while around 1.2 billion CRO are due to be released from the reserve on November 16.

October 30, 2026 11:28 PM

Is Polygon a Good Buy at Current Prices?
Polygon sits roughly half below its twelve-month high and keeps running into both moving averages. What the chart structure, the RSI and the trading volume say about buying POL at the current price.
October 28, 2026 6:40 AM
Is Morpho a Good Buy at Current Prices?
Morpho trades around a quarter below its twelve-month high while still holding above its long-term average. What argues for and against buying into the DeFi lending token at this level.
October 27, 2026 11:25 PM

Is Arbitrum a Good Buy at Current Prices?
Arbitrum sits well below its twelve-month high and above its long-term average. We check what argues for and against buying ARB at this level, and which condition would prove the recovery wrong.
October 27, 2026 7:27 AM
Is Venice Token a Good Buy at Current Prices?
Venice Token has multiplied within twelve months and has been correcting since its September high. We check the chart, the supply and the risks of VVV against the question of whether the token is a good buy at the current price.
October 26, 2026 11:22 PM

Is Sky a Good Buy at Current Prices?
Sky is the renamed MakerDAO, and its governance token is tied to the earnings of a lending protocol with its own stablecoin. Is SKY a good buy at current prices? We weigh the chart position, the savings rate, supply mechanics and the open question of European regulation.
October 21, 2026 12:33 AM
Is Worldcoin a Good Buy at Current Prices?
As of November 11, 2026: Worldcoin has fallen below both moving averages and the marks of the October analysis, while the twelve-month low holds. What chart, supply and World ID now mean for buying WLD.
October 19, 2026 1:16 PM

Cronos (CRO): 1.17 billion tokens leave the Strategic Reserve, eleven times the daily turnover
Overnight into October 17, 1.17 billion CRO left the Strategic Reserve and entered circulation, around 2.33 percent of the circulating supply. Because CRO turns over only $6.2 million a day, the tranche is roughly eleven to twelve times the entire daily turnover.

October 12, 2026 10:27 AM
Is Bitcoin Still a Good Investment in October 2026?
Spot ETFs have changed who sets the Bitcoin price, and the easy repricing is behind us. What still supports BTC, what could break it, and how much belongs in a portfolio today.
October 1, 2026 4:30 AM

228 Million CRO Up for Burning: the Cronos Vote Ends on Saturday
Until early Saturday, CRO stakers are voting on two proposals: a burn of 228 million CRO and a commitment to put all revenue from two products into buybacks. The quorum is reached and there are no votes against. What the figures mean relative to supply, and what investors in Germany should check.
September 28, 2026 9:47 AM
XRP Price Drops Below $1.50: Where Is Ripple Heading This Week?
XRP price slips under $1.50 after a red weekend. Here is the XRP price analysis with the higher and lower targets that matter this week.
September 28, 2026 4:28 AM

Is Quant a Good Buy at the Current Price?
As of 13 November 2026: Quant has broken below its October low of 182 dollars and trades below its 50-day average, but well above its 200-day line. We check with our own price data what that means for buying at the current price.
September 20, 2026 9:21 AM

Is Ethena a Good Buy at Current Prices?
As of November 11, 2026: Ethena has fallen below both moving averages, while the zone around $0.13 to $0.14 holds. Is ENA a good buy at current prices? We examine chart, supply and the revenue question.
August 31, 2026 11:20 PM

Is Mantle a Good Buy at Current Prices?
As of November 11, 2026: Mantle has fallen below both moving averages, while the twelve-month low still holds. We check with our own price data what chart, supply and liquidity mean for buying now.
August 27, 2026 11:25 AM

Is Pump.fun a Good Buy at Current Prices?
As of 13 November 2026: PUMP has fallen below its 50-day average and sits just above its 200-day line. We check with our own price data what that and the supply overhang mean for buying Pump.fun at the current price.
August 27, 2026 6:38 AM

Is NEAR Protocol a Good Buy at Current Prices?
As of 14 November 2026: NEAR has broken out of its October range to the downside and closes below its 50-day average, but above the 200-day line. We check with our own price data what that means for buying now.
August 27, 2026 6:23 AM

Is Bittensor a Good Buy at Current Prices?
As of 14 November 2026: Bittensor has closed below its October low and both moving averages since late October, putting the trend reversal in question. We check with our own price data what that means for buying.
August 27, 2026 4:31 AM

Is AAVE a Good Buy at Current Prices?
As of November 11, 2026: AAVE has slipped below its 50-day and just below its 200-day average, while the August mark still holds. We check with our own price data what that means for buying at current prices.
August 27, 2026 3:24 AM

Is Hedera a Good Buy at Current Prices?
As of 14 November 2026: by our yardstick Hedera's bottoming has failed, and it is closing at its lowest level in twelve months. We check with our own price data what that means for buying at the current price.
August 27, 2026 2:21 AM

Is SUI a Good Buy at Current Prices?
SUI is holding its 200-day moving average and trades 51 percent above its twelve-month low, with the 50-day line now above the 200-day. We check whether the coin is a good buy at current prices.
August 26, 2026 4:21 AM
Is Uniswap a Good Buy at Current Prices?
As of 14 November 2026: Uniswap has left its mid-October range to the downside and is sitting on its 200-day average. We check with our own price data what that means for buying at current prices.
August 24, 2026 12:50 AM
Is Bitcoin Cash a Good Buy at Current Prices?
Bitcoin Cash has held its summer gains but the rally has stalled: the price now sits right on its 50-day line with the RSI back to neutral and turnover halved. We work through what speaks for and against buying BCH at current prices.
August 24, 2026 12:34 AM

Is Monero a Good Buy at Current Prices?
As of 15 November 2026: Monero has fallen below its October low and just below the 200-day average, and the October breakout has not held. We check with our own price data what that means for buying at current prices.
August 24, 2026 12:19 AM

Is Zcash a Good Buy at Current Prices?
Zcash has given back part of its September advance and now sits just above its 50-day average. We look at what the trend, the RSI and the turnover actually support, and under which conditions the case for buying ZEC breaks down.
August 23, 2026 2:21 PM

Is Hyperliquid a Good Buy at Current Prices?
HYPE slipped below its 50-day average in October, triggering the test we set in September. What buybacks, team sales and leverage mean now: is Hyperliquid a good buy at current prices?


More from CryptoTicker