
Bitcoin Price Correction: Why BTC Stalled Dead at $78,000 Again
Bitcoin corrected from $81,455 after a hawkish Fed. The chart shows the exact same rejection level as May. Here are the upside and downside targets.


Which topics should we dive deeper into?
Select what genuinely interests you. Your picks feed directly into our editorial planning.
Crypto news that's actually worth your time.
Weekly. 60 seconds. Carefully curated by our editors: no hype, no promo flood, no spam.
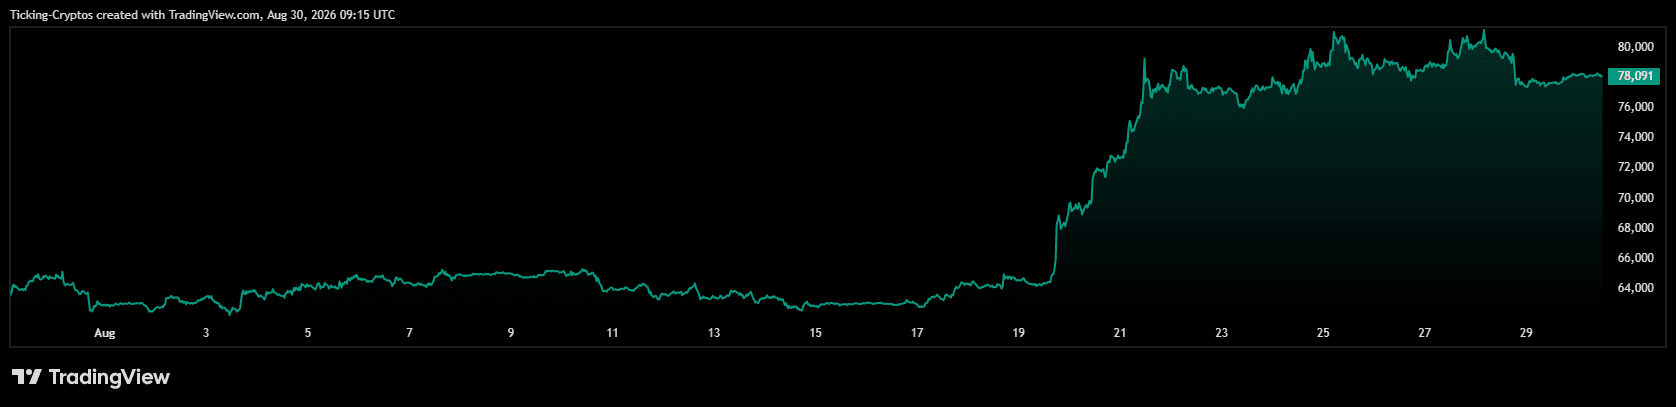
Bitcoin ran 26% in under two weeks, tagged $81,455, and then stopped at the exact price that killed the last rally. That is not a coincidence.
Why the market keeps falling, updated with every major sell-off: why is crypto down. How deep and how long every Bitcoin crash since 2011 ran: Bitcoin crash history.
As of Sunday 30 August, BTC/USD trades at $78,019 on Bitstamp, down 0.12% on the day. The weekend has been quiet. The week before it was anything but.
Why Did Bitcoin Correct After Hitting $81,000?
The trigger was macro, not crypto.
On Friday 28 August, new Fed Chair Kevin Warsh delivered his first Jackson Hole keynote. He pointed at PCE inflation still running 3.7% year over year, and a hotter 4.1% annualised over the previous six months. The message: the Fed still has work to do.
Markets repriced fast. September rate-hike odds on CME FedWatch jumped to roughly 56% from 35% a day earlier, touching 60% intraday. Gold fell 2.4%, US equities gave up early gains, and Bitcoin dropped from $81,455 to a low of $76,845 before closing near $77,800.
The leverage flush did the rest. CoinGlass logged around $486 million in liquidations across roughly 95,731 traders, with longs taking $368 million. Altcoins took it harder: $Ethereum closed at $2,443 (-2.70%), $Solana at $104.13 (-4.65%), $XRP at $1.3833 (-4.80%).

What Do Bitcoin ETF Flows Say About Institutional Demand?
US spot Bitcoin ETFs posted $201.81 million in net outflows on 28 August, snapping a nine-day inflow streak that had pulled close to $3 billion into the funds since 17 August.
ARK 21Shares ARKB drove it with $114.9 million out, followed by Bitwise BITB at $49.7 million and BlackRock IBIT at just $33.4 million. Morgan Stanley's MSBT was one of the few with fresh money at $9.3 million in.
That distribution matters. IBIT's small share of the redemptions suggests profit-taking after a fast rally, not a broad institutional exit. August month-to-date inflows still sit above $3.1 billion, the strongest month of 2026, and the funds collectively hold more than a million bitcoin. The reversal came one day after the complex crossed $100 billion in net assets.
Ether ETFs went the other way entirely, adding $102 million on the same day for a tenth straight session of inflows.
Still, ETF creations force funds to buy spot and redemptions force them to sell. If the outflows extend this week, the market loses the bid that held $80,000.
What Does the Bitcoin Chart Show Right Now?
$Bitcoin bottomed near $62,277 in mid-August, went near-vertical, cleared the 200-day EMA at $72,170 in days, and ran straight into $78,670. It is now sitting on that line, unable to close above it.
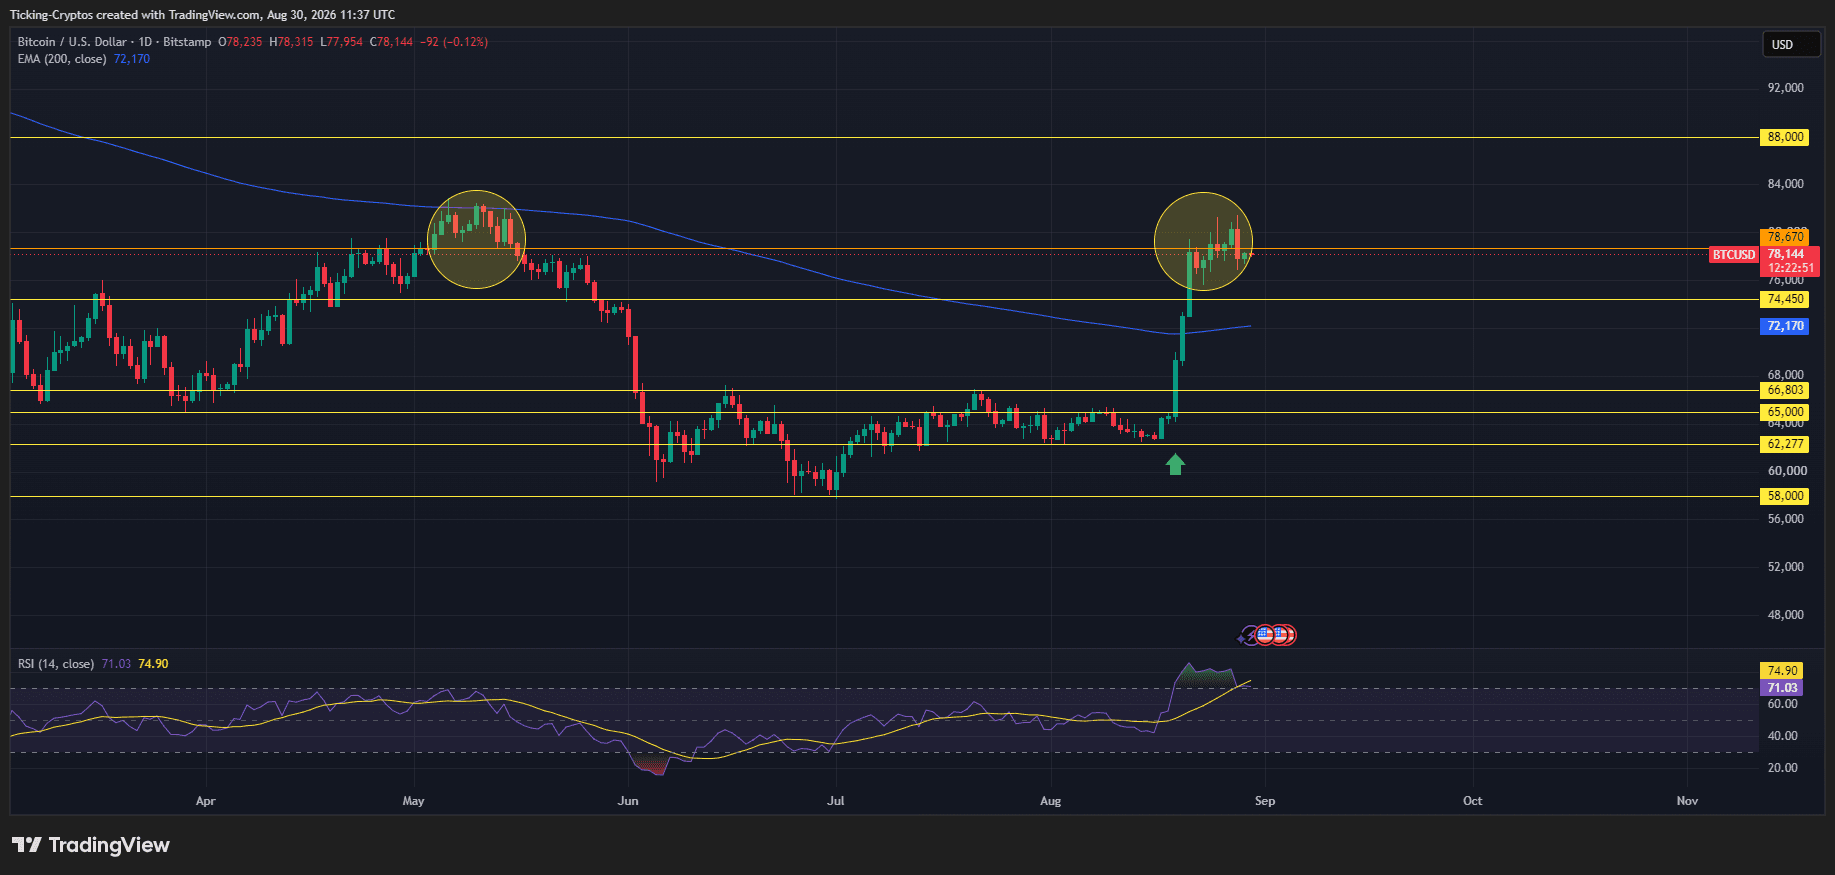
The problem is that $78,670 is the same level that capped the early May rally. Back then BTC consolidated just under it for two weeks, failed, and collapsed to the low $60,000s by June. The current structure is a near-perfect echo, with one key difference: in May the 200 EMA was overhead and falling. Today it sits below price at $72,170 and has started to flatten.
Momentum is cooling. Daily RSI reads 71.03, overbought, and has already crossed below its own moving average at 74.90.
One more detail most analysis misses: the move up was fast enough to leave a volume vacuum between roughly $68,000 and $76,000. Air like that cuts both ways.
What Are the Upside Bitcoin Price Targets?
Everything hinges on a daily close above $78,670 with volume behind it.
- $81,455 is target one, the 28 August high and effectively the same zone as the 50-week moving average near $81,000. That average has separated bull and bear phases through most of Bitcoin's history, making it the most important level of this cycle. A breakout needs genuine spot demand rather than short covering to hold above $82,000.
- $88,000 is next, the first clean structural resistance above it.
- $100,000 remains the stretch case. Standard Chartered's Geoff Kendrick has said his year-end call may now be too low, but that needs the Fed narrative to flip on a soft inflation print before 16 September.
What Are the Downside Bitcoin Price Targets?
If $78,670 rejects a second time, the levels below are clean.
- $74,450 is first support and the most likely landing zone for an ordinary pullback. Holding here keeps the uptrend intact.
- $72,170, the 200-day EMA, is the real line. Losing it means the August rally was a bear market rally.
- $66,803 to $65,000 is the shelf $BTC built through July and early August. A drop here erases most of the move but leaves the structure repairable.
- $62,277 is the rally origin. A full round trip back would be a textbook failed breakout.
- $58,000 is the bear case. Glassnode has warned that sellers look exhausted but buyers are absent, and that a break of $58,500 opens a deeper decline. Michael Terpin has flagged an October bottom near $57,000. This needs a September hike to actually land.
For context, Bitcoin has already fallen around 54% from its high this cycle, shallower than either 2018 or 2022.

 Find a crypto exchange with an EU licence
Which Bitcoin News Could Move BTC Next?
The CLARITY Act remains stuck in the Senate, with bank lobbying pushing Circle and Coinbase shares lower on 28 August. A proposed SEC crypto custody rule, RIN 3235-AN46, entered White House review on 25 August. XRP ETFs advanced in two new US filings, and Grayscale launched the first spot Zcash ETP under ticker ZCSH on NYSE Arca.
Sentiment is the risk. The Crypto Fear and Greed Index hit 72 on 28 August against a 30-day average of 42. When positioning gets that crowded that fast, small catalysts produce outsized selling. Friday proved it.
Bitcoin Price Prediction: What Should Traders Watch?
Bitcoin is at a decision point, not in a confirmed trend.
The bull case needs a daily close above $78,670, ETF flows back in net inflow this week, and the $76,700 to $77,300 area holding on a retest. Get all three and $81,000 falls, with $88,000 open behind it.
The bear case needs one thing: a second rejection here followed by a loss of $72,170. That reopens $65,000 fast, given how little volume sits in between.
The base case is chop. Overbought into resistance, strong but cooling structure underneath, and a genuinely uncertain Fed three weeks out. Ranging between $74,450 and $78,670 while RSI cools is the healthiest outcome for the bulls, and it is what the chart points at right now.
Watch the ETF prints Monday through Wednesday. That is the tell.
Frequently asked questions about the Bitcoin pullback at the 78,000 dollar mark
Partner links: some links on this page are partner links. If you become a customer through one of them, we may earn a commission at no extra cost to you. Selection, ratings and ranking are decided independently by our editorial team. Ethics and Independence · Ownership and Funding
For later? Save this article and find it again in your profile.
More on Bitcoin: All Bitcoin news at a glance
Related articles
- Bitcoin price slides to $61,400, its lowest level since July
- Bitcoin Chart Analysis: Price, Key Levels and the Week Ahead
- Bitcoin price holds $64,800 before Warsh speaks: the level that decides is $61,946
- Bitcoin price prediction: Mayer Multiple drops to 0.88, 11 percent below the 200-day line
- Bitcoin week ahead: the key dates from November 16 to 22
Which topics should we dive deeper into?
Select what genuinely interests you. Your picks feed directly into our editorial planning.
Crypto news that's actually worth your time.
Weekly. 60 seconds. Carefully curated by our editors: no hype, no promo flood, no spam.

November 14, 2026 5:21 PM

Bitcoin price breaks below the 200-week line: how low can BTC go?
Bitcoin falls below the 200-week line at around $67,755 on Saturday and hits $65,020, its lowest intraday level since August 19. Liquidations of more than $1.2 billion, ETF outflows and a Fear and Greed Index reading of 13 set the tone.
November 14, 2026 11:15 AM

Bitcoin price prediction: IBIT logs outflows for an 11th straight session
US spot bitcoin ETFs lost money on Friday for the seventh session in a row, and BlackRock's IBIT for the eleventh. Bitcoin is holding at around $67,200, with sentiment stuck in extreme fear.

November 13, 2026 7:19 PM

Ethereum price prediction: Foundation wallet sells for a fourth time, ETF outflows 87 times larger
Analysis: a wallet attributed to the Ethereum Foundation sold another 2,000 ETH on November 13. Set against the outflows from US ether ETFs that is a footnote, and with the price below $2,000 other levels matter more.
November 12, 2026 5:42 PM

Bitcoin price falls below $72,000: the reasons behind the drop
Bitcoin fell below $72,000 and its 200-day moving average on Thursday, its lowest level since August 20. The Nvidia CEO's resignation, MSCI's removal of Strategy, ETF outflows and rate worries all hit on the same day.
November 11, 2026 5:13 AM

Bitcoin price at $73,700: outflows from BlackRock's IBIT show no sign of stopping
Analysis: Bitcoin trades at around $73,700 on Wednesday morning, just above its 200-day moving average. BlackRock's bitcoin fund IBIT has lost money for seven trading days in a row, $1.66 billion in total, while equities rallied.
November 10, 2026 9:24 PM

Bitcoin price prediction: lowest level since August, will the $72,000 zone hold?
Analysis: bitcoin falls to its lowest level since August 20 after the US inflation data and tests the 200-day average at $73,150. What ETF outflows, the options market and the Fed mean for the zone between $72,000 and $75,000.
November 9, 2026 1:17 PM

Ethereum falls below $2,100: weakest against bitcoin since July
Ether fell 5.3 percent on November 9, 2026, to around $2,119, losing almost three times as much as bitcoin. One ether now buys only 0.0283 bitcoin, the lowest since July, as long liquidations and ETF outflows add to the pressure.

November 9, 2026 11:17 AM

Bitcoin slips below Strategy's $75,451 cost basis as Saylor's 849,327 BTC go underwater
Analysis: Bitcoin trades at around $74,030 on Monday, below the $75,451 average price at which Strategy bought its 849,327 BTC. What the SEC filing reveals about the purchases, which levels matter now and how Bitcoin and Strategy shares are taxed in Germany.
November 9, 2026 5:13 AM

Bitcoin price holds $74,800 as the 200-day average at $73,170 faces US inflation data
Analysis: Bitcoin starts the week at around $74,800 after briefly dropping to $73,477 on Sunday evening, its lowest level since August 21. The 200-day moving average sits just below, and US inflation data is due on Tuesday.

November 7, 2026 10:59 PM

Will Bitcoin Go Back Up? Three Scenarios to Year-End: $70,000, $80,000 or $100,000
Bitcoin (BTC) is 40% below its record, ETFs are bleeding cash and the Fed may hike. What happened since early November, which levels decide between $70,000, $80,000 and $100,000, and what price history says about the 53 days to New Year's Eve.
November 7, 2026 11:12 AM

Bitcoin Price Prediction: BTC Sits on the $75,700 Cost Basis of Recent Buyers
Analysis: Bitcoin trades at around $75,900 on Saturday, almost exactly at the cost basis of investors who bought in the past 155 days. Which levels count until the end of November, and what this means for purchases made since June.
November 6, 2026 9:19 PM

Bitcoin price prediction: $430 million outflow pushes the 2026 ETF balance below zero
Analysis: US bitcoin ETFs lost $869.8 million in four trading days, and the balance for 2026 is back below zero. What the outflows reveal about the price at $75,800, which levels count until the end of November and what investors in Germany can make of it.
November 5, 2026 8:07 AM

Bitcoin Price Prediction: 24,912 Calls Against 8,223 Puts, What Friday's Expiry Decides
On Friday, Bitcoin options worth about $2.65 billion expire at Deribit, with three times as many calls as puts. The price sits just above max pain. Which levels count now and what range the options market is pricing in.
November 4, 2026 8:36 PM

Bitcoin Price Jumps Above $80,000: Why the Market Rose After the Midterms
Bitcoin (BTC) jumped above $80,000 although Trump and the Republicans clearly lost the midterms. Oil, Wall Street and $378 million in short liquidations explain the move. Which levels count now and what could tip the picture.
November 4, 2026 7:42 AM

Bitcoin ETF Outflows Pass $1 Billion: Why Institutions Are Selling After the Midterms
Spot Bitcoin ETFs bled over $1 billion in three sessions as the Binance hack and the midterms spooked institutions. Where does BTC go next?
November 3, 2026 9:29 AM

Solana Price Below $95: Record ETF Outflows and Whale Selling Push SOL to a 7-Month Low
Solana price drops under $95 after a record $71 million ETF outflow and whale dumping. SOL is 19% down in a month. Is $78 the next stop?
November 2, 2026 5:37 PM

Bitcoin miners earn 14.2 percent less per exahash as difficulty hits a record
Analysis: Since September 19, the Bitcoin network has demanded 11.8 percent more computing work per block, while the price has fallen over the same period. What this gap means for the coming weeks, and which level below the price actually holds.
October 31, 2026 9:46 AM

Bitcoin Price Crash Continues: BTC Slips Below $78,000, Here Is the Next Target
Bitcoin price crashes below the key $78,000 area as selling pressure builds. We analyze the chart and reveal the next short-term target for BTC.
October 30, 2026 8:02 AM

Bitcoin Price After Binance Hack: Only 2% Down. What Comes Next?
Bitcoin fell only 2% after the biggest crypto hack ever drained $2.8 billion from Binance. Here are the higher and lower Bitcoin price targets now.
October 27, 2026 12:31 PM

XRP Price Crashes Below $1.30: What Caused It and What Comes Next
XRP price has dropped below $1.30 after weeks of selling. Here are the factors behind the XRP crash and the next high and low price targets.
October 26, 2026 7:36 AM

Bitcoin Price Crash: Top 3 Reasons Why BTC Price Dropped Below $80,000
Bitcoin price crashed below $80,000 over the weekend. Oil, ETF outflows and a wave of liquidations explain the move, and the Fed decides this week.
October 9, 2026 4:16 PM

Bitcoin Price Prediction: Standard Chartered Sticks to $100,000 as ETFs Shed $729 Million in Two Days
Standard Chartered is holding to $100,000 by year-end, yet US spot ETFs lost $729 million on Wednesday and Thursday. Bitcoin stands at around $83,100. What would have to happen by December, and which levels count now.
September 21, 2026 10:40 AM

Bitcoin Price Explodes Past $84,000: Here Is What Is Driving BTC
Bitcoin just ripped through months of resistance in a single session. Here are the real reasons behind the BTC rally and the level that matters next.
September 11, 2026 8:32 AM

Bitcoin Price Drops 4% in a Week, and the Chart Just Got Interesting
Bitcoin price fell 4% this week and lost the $78,000 shelf. Here is what the chart says about the next support, resistance and price targets.
September 6, 2026 11:19 AM
Bitcoin Price Today: BTC Holds Firm Before The Biggest Week Of The Month
Bitcoin sits near $80,000 after a jobs report killed a four-month high. CPI, the Fed and a Senate vote all land in the next ten days.

More from CryptoTicker