
Why Is Crypto Down Today? The Reasons Behind Every Crypto Sell-Off
Why crypto is falling today, updated with every major move: the current trigger, the six forces behind almost every crypto sell-off, a five-minute checklist and a timeline of the 2026 drops.


Which topics should we dive deeper into?
Select what genuinely interests you. Your picks feed directly into our editorial planning.
Crypto news that's actually worth your time.
Weekly. 60 seconds. Carefully curated by our editors: no hype, no promo flood, no spam.
Update, November 6, 2026, 5:47 p.m. CET: Crypto is down again today. Bitcoin trades at $75,588, 1.1 percent lower than 24 hours ago and 40.0 percent below its record of $126,080 from October 6, 2025 (CoinGecko). In the afternoon it dipped to $74,762 on Bitstamp, the lowest price since August 21. The whole market lost 2.9 percent to $2.56 trillion, XRP fell 4.6 percent to $1.19 and Ether 1.9 percent to $2,224. Sentiment flipped within a day: the Fear and Greed Index dropped from 50 to 28, back into fear. Leverage is still being flushed out: $467 million in positions were liquidated over 24 hours, 78 percent of them longs, after more than $1 billion in the 24 hours before (CoinGlass). The trigger was Thursday's sell-off in Nasdaq chip stocks, which cost Bitcoin 5.6 percent on the day, its largest daily loss since June 2.
Where that leaves Bitcoin: still 29 percent above its June 30 close of $58,559, the bottom of the current decline so far. How deep and how long earlier crashes ran is set out in our Bitcoin crash history, what defines a bear market and how long one lasts in our guide, and how close stocks are to a stock market crash in 2026 in our analysis.
Update, November 6, 2026, 1 am CET: Bitcoin fell to $75,208 late on Thursday, its lowest level since September 16. Two new pressure points: Trump Media moved 4,259 BTC to Crypto.com ahead of a possible $1 billion note repayment on November 30 (why that could force a sale), and Trump's announced Russia deal brought no relief rally (what the deal means for Bitcoin).
Update, November 5, 2026: Bitcoin fell from $80,962 to $75,568 on Thursday as a Nasdaq chip rout wiped out leveraged longs. The reasons, the levels that count now and how to hedge: Bitcoin crash explained.
Why is crypto down today? On November 1, 2026, hardly at all: Bitcoin is holding at $77,909, up 0.7 percent from 24 hours ago, and the total crypto market is up 0.6 percent at $2.62 trillion. Behind the market lies a hard week. On October 29 a hack drained crypto worth around $6.3 billion from Binance's hot wallets, and on October 30 the Nasdaq and gold fell sharply. Over seven days Bitcoin is down 3.2 percent, over 30 days 8.9 percent. Since the morning of November 1, the first withdrawals at Binance are running again.
This page is the standing answer to the question. At the top you find the current move, below it the six forces behind almost every crypto sell-off, a checklist to see for yourself what is moving the market, and the timeline of the 2026 drops with their triggers. We update it with every major move; the date at the top shows how fresh the answer is.
Crypto market check, November 1, 2026, 3:29 p.m. UTC
- Bitcoin: $77,909, up 0.7 percent in 24 hours, down 3.2 percent in 7 days and 8.9 percent in 30 days
- Total crypto market: $2.62 trillion, up 0.6 percent in 24 hours
- Bitcoin dominance: 59.9 percent of the market
- Fear and Greed Index: 34, fear
- Binance: withdrawals for Bitcoin, Ether, BNB and USDT and USDC on Ethereum and BNB Smart Chain open again since the morning, around 95 percent of the loss replaced according to Binance
- Next dates: Binance's full proof of reserves expected by Tuesday, November 3, the same day as the US midterm elections
 Buy crypto: the best exchanges compared
The week behind the drop: the Binance hack and the US stock sell-off
The trigger came on-chain. From 8:24 p.m. UTC on October 29, 2026, large amounts of Ether, stablecoins and other tokens left Binance's hot wallets within about 40 minutes. In its update of October 30, Binance puts the loss at around $6.3 billion; around $3 billion has been frozen on-chain, and the exchange says it will cover the losses from its SAFU fund and its own money. On November 1, Binance reported that around 95 percent of the amount has been replaced (Recovery Update #4) and reopened the first withdrawals. What is confirmed is laid out in our report on the Binance hack and the hot wallets, and the reopening in Binance reopens withdrawals.
The market reacted within minutes. BNB, the exchange's own coin, fell 6.3 percent from $738.90 to $692.32 by 8:50 p.m. UTC. Bitcoin slid from $80,327 to a low of $78,763 at 9:00 p.m. UTC, and according to CoinGlass data about $628 million in leveraged positions were liquidated within an hour, almost all of them bets on rising prices. Our timeline of the Binance hack and the liquidations follows the move minute by minute.
The hack hit a market that was already on edge. On October 28 the Federal Open Market Committee left its target range for the federal funds rate at 3.75 to 4 percent, according to the Fed statement of October 28, but two members, Lisa D. Cook and Beth M. Hammack, wanted a quarter-point increase. A pause with two votes for a hike tells traders that the next step could be up rather than down, and higher rates raise the cost of the borrowed money that fuels leveraged crypto trading.
The next day the pressure came from Wall Street. On October 30 the Nasdaq Composite closed 2.86 percent lower and the S&P 500 1.82 percent, gold lost 3.3 percent and Coinbase fell 10.6 percent (daily closes from Yahoo Finance). Bitcoin held above $77,000. Whether the two are linked is examined in Binance hack and stock market crash within 24 hours. Two dates matter in the new week: Binance expects to publish its full proof of reserves by Tuesday, November 3 (UTC), and on the same day the US elects the House and a third of the Senate; what the vote means for crypto is in the 2026 midterms and Bitcoin.
Coins you hold yourself are out of reach of an exchange hack. Our hardware wallet comparison shows which devices fit.
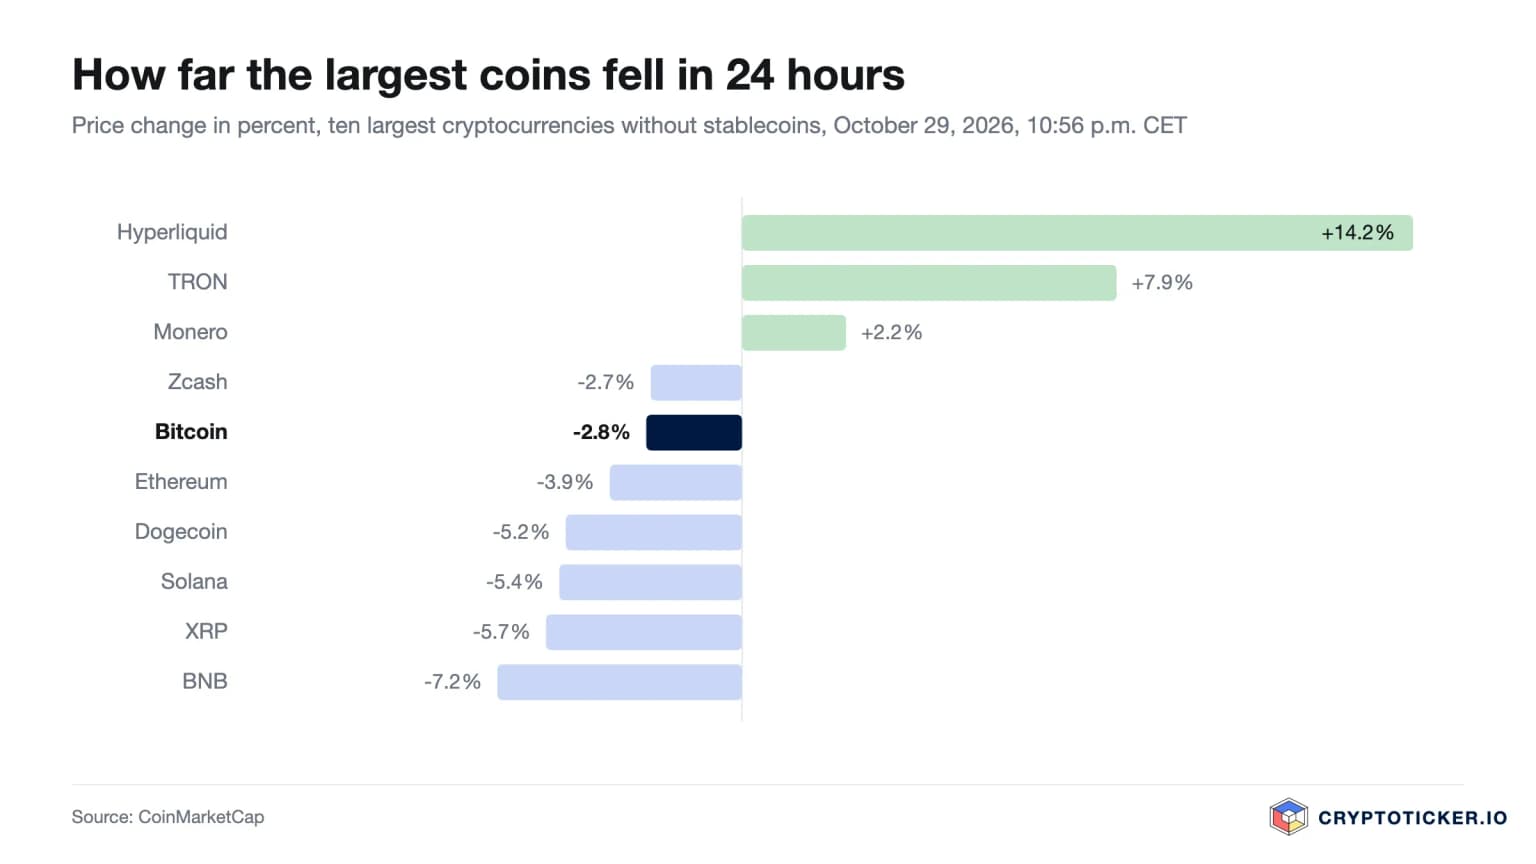
Six reasons why crypto falls
Almost every crypto sell-off of the past years goes back to one or more of six forces. Knowing them turns the daily question into a quick check: which of the six is active today?
1. Interest rates and the Fed
Crypto is priced like a high-risk asset. When the Fed raises rates, or signals that it might, money moves into bonds and cash, and borrowing for leveraged bets gets more expensive. Fed meetings, the minutes three weeks later and US inflation data (CPI and PCE) are the dates that move crypto most reliably. The sell-offs of October 7 and October 14, 2026 both started with one of these dates, and the Fed decision of October 28 set the tone for October 29.
2. Leverage and liquidations
Many traders buy Bitcoin with borrowed money on futures exchanges. When the price drops a few percent, exchanges close these positions automatically, and each forced sale pushes the price lower and triggers the next one. On October 7 and 8, 2026 long positions worth more than $651 million were liquidated in one move. You can follow this in real time on our crypto liquidations chart and the open interest chart.
3. ETF outflows
Since 2024, US spot ETFs for Bitcoin and Ether have been a major source of demand. Days with large outflows mean that big investors are selling through regulated products, and that selling reaches the spot market directly. ETF outflows were one of three documented reasons for the early October drop from $86,592 to below $83,000.
4. Risk-off in stocks, oil and the dollar
Crypto rarely falls alone. When the Nasdaq drops, oil spikes or the dollar strengthens against the yen, investors cut risk everywhere at once. On October 22, 2026 the crypto market lost 4.2 percent in a day while the Nasdaq Composite fell 2.1 percent and Brent crude climbed to a five-month high.
5. Regulation and politics
Decisions in Washington, Brussels or Beijing can move the whole market within minutes. The clearest example of 2026: on September 15 the US Senate blocked the market structure bill by 49 votes to 50 and Bitcoin slid to $76,000. Everything about the bill and its next steps is in our explainer on the CLARITY Act. Geopolitics belongs here too: on August 10 Iran rejected talks with the US until 2029, and Bitcoin dropped below $64,000.
6. Hacks, whales and forced sellers
A large exchange hack, a big holder moving coins to an exchange, a government selling seized Bitcoin or a miner selling reserves can all trigger a drop, often on a weekend when trading is thin. The latest example is the suspected hack at Binance on October 29, 2026, which sent BNB down 6.3 percent within half an hour and Bitcoin below $79,000. These moves are usually short; the question is whether they hit a market that is already nervous for one of the five reasons above.
 CryptoTicker trading game: try it free
How to check why crypto is down in five minutes
You do not need to wait for an explanation. These five checks show within minutes which force is behind a move, and all of them are free.
| Check | Where | What it tells you |
|---|---|---|
| Liquidations in the last 24 hours | Liquidations chart | High long liquidations mean leverage is being flushed out; such drops often end quickly |
| Open interest | Open interest chart | Falling open interest with falling prices means traders are closing bets, not new sellers arriving |
| Fed, CPI and PCE dates | Fed meeting calendar | A drop on a rate or inflation day is a macro move that affects all coins |
| Bitcoin dominance | Bitcoin dominance chart | Rising dominance in a falling market means money is fleeing altcoins first |
| Market sentiment | Fear and Greed Index | Readings under 25 signal extreme fear, readings over 75 extreme greed |
A useful rule of thumb: if only one coin falls, look for news about that coin. If the whole top 20 is red and Bitcoin falls less than the rest, the cause is almost always macro or leverage. Our gainers and losers overview shows this at a glance.
Crypto sell-offs in 2026 and what caused them
The table lists the major drops of the year with the price of Bitcoin on the day and the trigger. Each row links to our analysis from that day.
| Date | Bitcoin | Trigger |
|---|---|---|
| June 24, 2026 | below $60,000 | Bitcoin breaks the $60,000 floor |
| August 10, 2026 | about $63,890 | Iran rejects talks with the US until 2029 |
| September 15, 2026 | about $76,010 | Senate blocks the CLARITY Act |
| October 7 to 8, 2026 | from $86,592 to below $81,000 | ETF outflows, $651 million in liquidations, Fed minutes |
| October 14, 2026 | about $81,712 | US inflation above forecast |
| October 22, 2026 | Ether down 5.4 percent | Nasdaq and oil, risk-off across markets |
| October 25 to 26, 2026 | low near $79,200 | Bitcoin loses $80,000 |
| October 29, 2026 | low of $78,763 | Binance hack, around $6.3 billion according to Binance |
| October 30, 2026 | close of $77,198 | US stock sell-off: Nasdaq down 2.86 percent, gold down 3.3 percent |
| November 5, 2026 | close of $75,942 | Nasdaq chip sell-off, more than $1 billion in liquidations |
Is crypto going to recover?
Nobody can tell you when a drop ends, but history gives a frame. Bitcoin trades 38.2 percent below its all-time high of $126,080, and over 90 days it is still up 22.5 percent. Drawdowns of 30 percent and more have also happened in Bitcoin's bull markets, for example in 2017 and 2021. Deeper crashes of more than 50 percent are rarer; our Bitcoin crash history lists every one of them since 2011 with the time it took to recover.
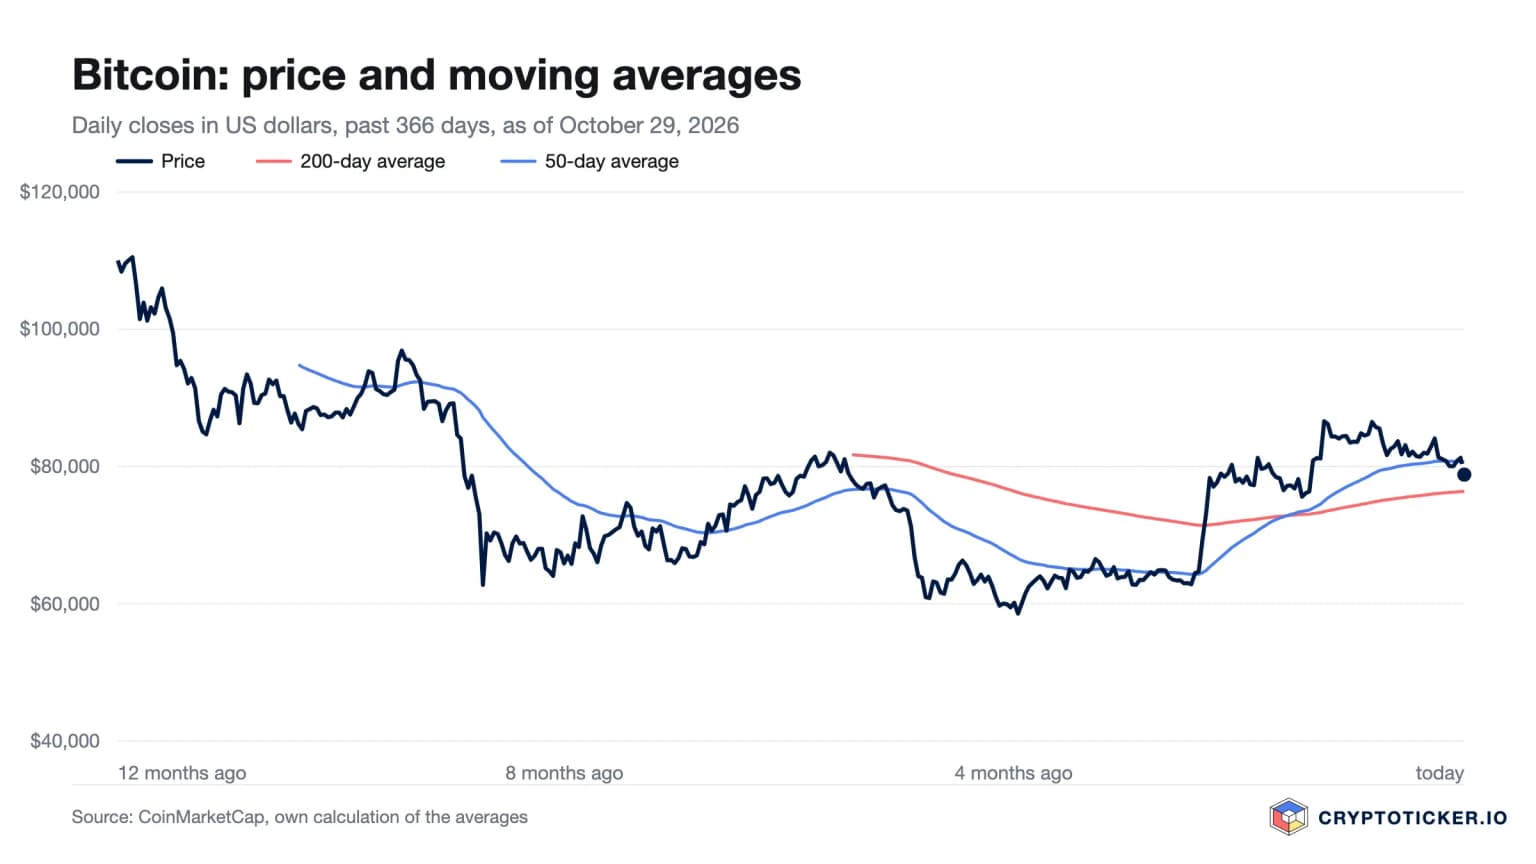
What decides the next weeks is visible in the six forces above: whether the Fed actually hikes in December, whether ETF flows turn positive and whether leverage keeps building. The chart below shows where Bitcoin stands relative to its 50-day and 200-day averages, the two lines many traders use to judge the trend: on October 29, Bitcoin trades about 2 percent below its 50-day average of $80,692 and about 3 percent above its 200-day average of $76,389. For a longer view, see our Bitcoin price prediction.
What to do when crypto is falling
A falling market is when most expensive mistakes happen. Four habits help, whatever your strategy:
- Do not trade with borrowed money in a falling market. Liquidations are what turn a 3 percent dip into a 15 percent crash for the people affected.
- Check where your coins are. If you hold on an exchange, make sure it is regulated; our crypto exchange comparison shows licences and fees side by side.
- Decide in advance. A fixed savings plan or a price level written down before the drop protects you from selling at the low out of fear.
- Look at the reason, not just the price. A macro sell-off hits every coin; a drop caused by a hack or a delisting is a problem of that one coin.
- Think about tax. Under German law, a loss on coins sold within a year can be offset against gains from private sales (§ 23 EStG); the free CryptoTicker Crypto Tax Calculator shows what that means for you.
If you are wondering which coins to watch after a sell-off, our monthly updated list of the best crypto to buy now explains the current picks and how we choose them.
This page is updated with every major market move. Last update: November 6, 2026. It is market information, not investment advice; crypto assets can lose value quickly.
Frequently asked questions: why is crypto down today?
Transparency note: This article was produced with the assistance of artificial intelligence and reviewed by our editorial team before publication. All figures and claims were checked against the primary sources linked in the text. The feature image was generated with AI.
Related articles
- Why Is Crypto Down Today? The 5 Reasons Behind the November 3 Sell-Off
- Crypto Crash Today: Why Is Bitcoin Stuck Below $82,000?
- Crypto Crash: Why the Top Cryptos Lost Up to 4% in One Week
- Crypto Crash Reason: Why Bitcoin Fell Below $81,000 and Altcoins Bled Even Harder
- Crypto Market Crash Deepens as Bitcoin Breaks Below $75K
Which topics should we dive deeper into?
Select what genuinely interests you. Your picks feed directly into our editorial planning.
Crypto news that's actually worth your time.
Weekly. 60 seconds. Carefully curated by our editors: no hype, no promo flood, no spam.

May 8, 2026 9:32 AM

Crypto Crash Today: Why Is Bitcoin Crashing below 80K?
Bitcoin price has slipped below $80,000 as geopolitical tensions and profit-taking trigger a crypto crash today. Here are the market dynamics behind the BTC drop.
November 7, 2026 9:46 AM

Crypto Crash: Why Bitcoin, Ethereum, XRP and Solana Fell This Week and What Comes Next
Bitcoin lost its post-election gains, ETH hit a 10-week low and XRP led the losses. The four drivers behind this week's crypto crash and the levels to watch.
September 29, 2026 10:38 AM

Bitcoin Falls Toward $83,000 as Trump Rejects Iran Ceasefire Deal
Bitcoin slipped toward $83,000 after Trump rejected Iran's Hormuz proposal, sending oil above $100 and wiping out $478 million in crypto liquidations.
March 26, 2026 1:23 PM

Crypto Ignores Bullish News as War Risk Takes Over — Why Bitcoin and Ethereum Are Falling Anyway
Bitcoin and Ethereum fall despite bullish crypto news as war risks, oil spikes, and macro pressure dominate market sentiment.
July 8, 2026 6:22 PM
Why Is Crypto Crashing Today: US Strikes on Iran and a Collapsing Ceasefire
Fresh US airstrikes on Iran and a ceasefire declared "over" sent crypto into the red today. Here's why Bitcoin, Ethereum and altcoins are bleeding.
January 30, 2026 10:12 AM

Crypto Crash Reason: Why is Bitcoin Crashing Today and Key Supports
The crypto market is facing a sharp correction. What are the crypto crash reasons today, and what are Bitcoin support levels, and how are macro factors hitting prices?
September 15, 2026 4:24 PM

Why Is Crypto Crashing Today? Bitcoin Slides to $76,000 as the CLARITY Act Vote Wobbles
Bitcoin slid to $76,000 and the entire top 20 turned red as CLARITY Act odds collapsed before today's Senate vote. Here is what is really driving it.
June 24, 2024 8:16 PM

Bitcoin News Today: Bitcoin CRASH OVER or MORE Down To Go?
Bitcoin Price Crash below 60k, and the crypto market follows. Why this decline and how low can it go?

August 10, 2026 6:52 PM
Why Is Crypto Down Today? Iran Shuts the Door on US Talks Until 2029
Crypto gave back its morning gains after Iran ruled out talks with Washington until 2029. Bitcoin lost $65,000, oil jumped 5% and altcoins bled again.
February 26, 2025 5:36 PM

Crypto News: Will The Crypto Market Crash Further or Recover NEXT?
The crypto market crash has taken its toll on Bitcoin and other major altcoins, with a general market cap decrease of over $0.3T. So, what comes next?
July 27, 2024 2:34 PM

Why Is The Crypto Market Up TODAY?
With the Bitcoin 2024 Conference taking place now in Nashville, the crypto market is showing bullish signals, intriguing traders around the future of Bitcoin and Altcoins.
June 24, 2026 6:50 PM

Crypto Crash Reason: Why Bitcoin Just Smashed Below $60,000
Bitcoin has crashed below $60,000 and the entire market is bleeding red. Here's the real reason behind the crypto crash — and what's dragging everything down.
February 24, 2026 7:51 AM
Crypto Crash Reasons: Why Bitcoin Just Plunged Below $63k
Bitcoin has fallen below the $63,000 mark as a massive crypto crash wipes out millions in liquidations. Here is why the crypto market is down today.
April 7, 2025 11:06 AM

Why are Cryptos Crashing Today?
The cryptocurrency market experienced a significant downturn with Bitcoin falling to $76,300 and Ethereum plunging to $1,490. Here's why cryptos are crashing.
June 4, 2026 1:23 PM

Is the Crypto Crash Manipulated? Bitcoin and ETH Shed Billions
Bitcoin and Ethereum have plunged sharply, wiping out billions in market cap amid massive ETF outflows, sparking concerns over potential market manipulation.
June 2, 2026 6:13 PM
Bitcoin Crash to $67,400 as Google and Berkshire Team Up for Massive $80B AI Fund
Bitcoin fell 5.6% to $67,400 as a massive $80B AI capital raise backed by Berkshire Hathaway triggered an institutional capital rotation out of crypto.

October 29, 2026 9:40 PM

Crypto Crash After Binance Hack: $628 Million Liquidated in One Hour
At 20:24 UTC a Binance hot wallet was drained of about $2.8 billion. Within an hour Bitcoin fell below $79,000 and BNB lost 6.3%. Here is the minute-by-minute timeline, the prices of all major coins and what could come next as Asia wakes up.
October 31, 2026 12:36 AM

Binance Hack, Then a Stock Market Crash: Coincidence or Connection?
The largest crypto theft in history on Thursday evening, Wall Street's worst day since June on Friday. Are the Binance hack and the stock market crash connected? Our analysis of timeline, sizes and money flows, and where crypto and stocks really meet.
May 16, 2026 10:50 AM

Crypto Crash: Bitcoin Slips to 78k as Market Reverses Friday Pump
Crypto prices face a sharp downturn after a brief Friday pump. Bitcoin hovers at 78k, threatening a deeper crash if macro support breaks.
February 28, 2026 10:20 AM

BREAKING NEWS: Crypto Crash as US and Israel Strike Iran
Crypto markets crashed as the US and Israel launched joint strikes on Iran. Bitcoin fell below $64,000 amid mass liquidations and rising geopolitical tension.
October 31, 2026 12:02 AM

Stock Market Crash: Why US Stocks Now Swing Like Meme Tokens
Intel and Reddit lost 29 percent in a single day, almost twice as much as Bitcoin on its worst day since 2020. The Nasdaq had its worst day since June. The triggers of the stock market crash, why US stocks now move like crypto tokens and what comes next week.


More from CryptoTicker