Crypto Crash Reason: Why Bitcoin Just Smashed Below $60,000
Bitcoin has crashed below $60,000 and the entire market is bleeding red. Here's the real reason behind the crypto crash — and what's dragging everything down.


Bitcoin has cracked the psychological $60,000 floor, and the entire crypto market is drowning in red. After spending most of the day clinging to support, BTC broke down hard in the afternoon session and is now changing hands around $59,462 — a level not seen in months.
If you're wondering what's behind this crypto crash, you're not alone. Let's break down exactly what happened and why everything is falling apart at once.
Bitcoin Price Today: What Happened to Bitcoin?
The intraday damage is brutal. Bitcoin opened the day holding firm near the $62,651 previous close, even pushing toward $62,800 in the early hours. Then came the breakdown.
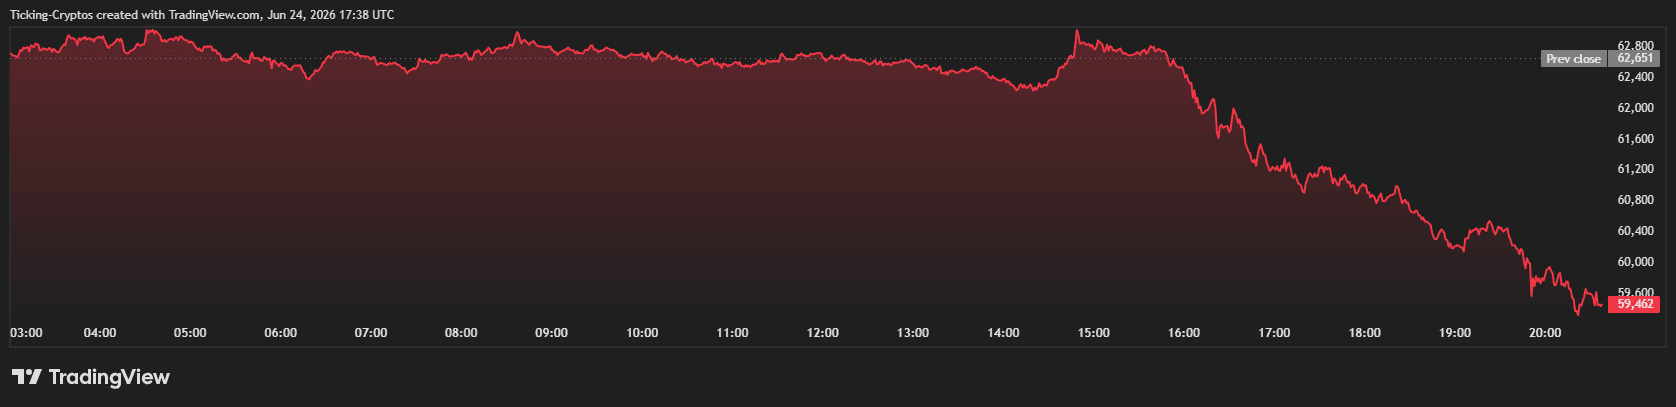
Looking at the chart, the real bleeding started around 15:00 UTC. After one last failed push higher, BTC rolled over and never looked back — a textbook lower-high, lower-low cascade. The drop accelerated through the afternoon, slicing through $62,000, then $61,000, then $60,000 like they weren't even there. By 20:00 UTC, Bitcoin had bottomed near $59,462, marking a decline of more than 5% on the day.
This wasn't a slow grind. It was a sharp, leveraged flush — the kind of move that triggers cascading liquidations and feeds on itself.
Crypto Crash Today: How bad is the damage across the market?
This is not a Bitcoin-only story. The entire top of the market is deep in the red:
- Bitcoin ($BTC): ~$59,447 — down 5.02% on the day, down 9.76% over 7 days, and a painful 32.07% in the red year-to-date.
- Ethereum ($ETH): ~$1,570 — down 5.48% today and a brutal 47.07% YTD, making it one of the worst performers among the majors.
- $BNB: ~$552 — down 3.87% on the day, holding up slightly better than the rest.
- $XRP: ~$1.05 — down 4.43% today and down 13.16% over the week, one of the heaviest weekly losers.
- Solana ($SOL): ~$65 — down 5.21% on the day and a staggering 47.44% YTD.
Only the stablecoins (USDT, USDC) are holding their pegs, as you'd expect. Everything else is bleeding, and the year-to-date numbers tell the bigger story: this isn't just a bad day, it's the continuation of a deep, grinding downtrend.
Crypto crash reason: why is everything falling?
So what's actually driving this? It's not one single trigger — it's a perfect storm of pressure points hitting at once.
1. Tech and AI stocks dragged everything down
The biggest immediate culprit is risk-asset spillover. Tech and AI stocks sold off sharply, dragging crypto and other risk assets lower, with major chipmakers and AI companies dropping on profit-taking and rotation out of high valuations, causing Bitcoin to move in tandem as investors turned defensive. When traders flee high-valuation tech, crypto gets caught in the same wave.
2. Sticky inflation and a hawkish Fed
Macro is still working against crypto. Ongoing worries over inflation and Fed rate cuts have kept investors cautious, with sticky inflation data delaying hopes for rate cuts and reducing appetite for high-risk assets. As long as rates stay high, speculative assets like Bitcoin stay under pressure.
3. Relentless ETF outflows
Institutional demand has been draining away. Modest but ongoing spot Bitcoin ETF outflows have added selling pressure and could intensify if they accelerate again. ETF flows are one of the clearest signals of institutional appetite, and right now that signal is flashing red.
4. The Saylor "never sell" narrative cracked
Sentiment took a structural hit earlier this cycle when Strategy made its first Bitcoin sale in over three years, breaking from the company's long-standing principle that Bitcoin should be amassed and never sold. Even though the dollar amount was tiny, the symbolic blow to market confidence still lingers.
5. The CLARITY Act catalyst is slipping away
The one bullish catalyst the market was banking on is fading. Bitcoin's key catalyst for renewed investor interest, the crypto market structure bill known as the Clarity Act, is drifting further out of reach as legislative priorities shift and lawmakers remain divided on key provisions. With no near-term regulatory green light, there's little to spark a relief rally.
Bitcoin Price Future: What are the key levels to watch now?
With $60,000 gone, the technical picture has turned ugly. On higher timeframes, $BTC remains in a clear downtrend with lower highs and lower lows, momentum stays bearish, and sellers remain in control unless a major catalyst appears.
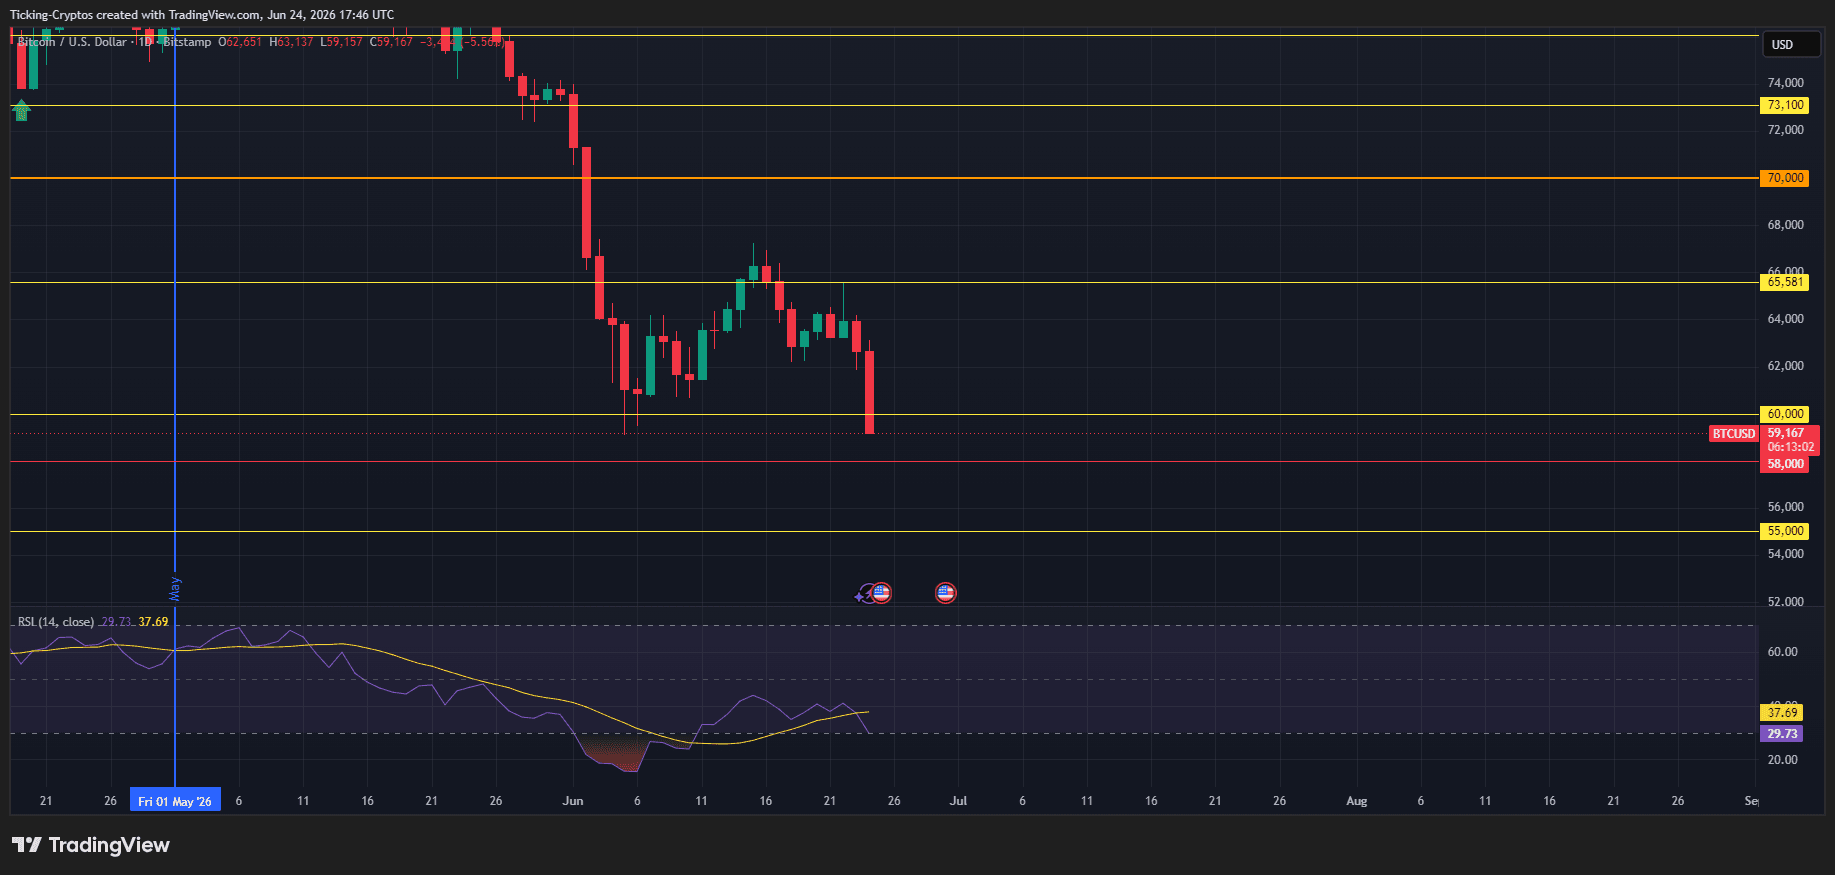
On the downside, immediate support sits around the $55,000 level — both the February 2026 lows and a significant volume node — and a break below that would likely accelerate selling toward the $50,000–$52,000 range. On the upside, the old $60,000 floor now flips into resistance, and the immediate major resistance sits near $74,000 — a long way back up.