
Bitcoin Price Rips to $69,749: Here Is the Next Target
Bitcoin just posted its biggest daily candle since June and stopped 251 dollars short of $70,000. The measured move points somewhere very specific.


Which topics should we dive deeper into?
Select what genuinely interests you. Your picks feed directly into our editorial planning.
Crypto news that's actually worth your time.
Weekly. 60 seconds. Carefully curated by our editors: no hype, no promo flood, no spam.
Bitcoin has broken out of a six-week range with the most violent daily candle since early June. BTC opened at $64,686, ran to an intraday high of $69,749, and sits at $68,761, up 6.20% on the day.
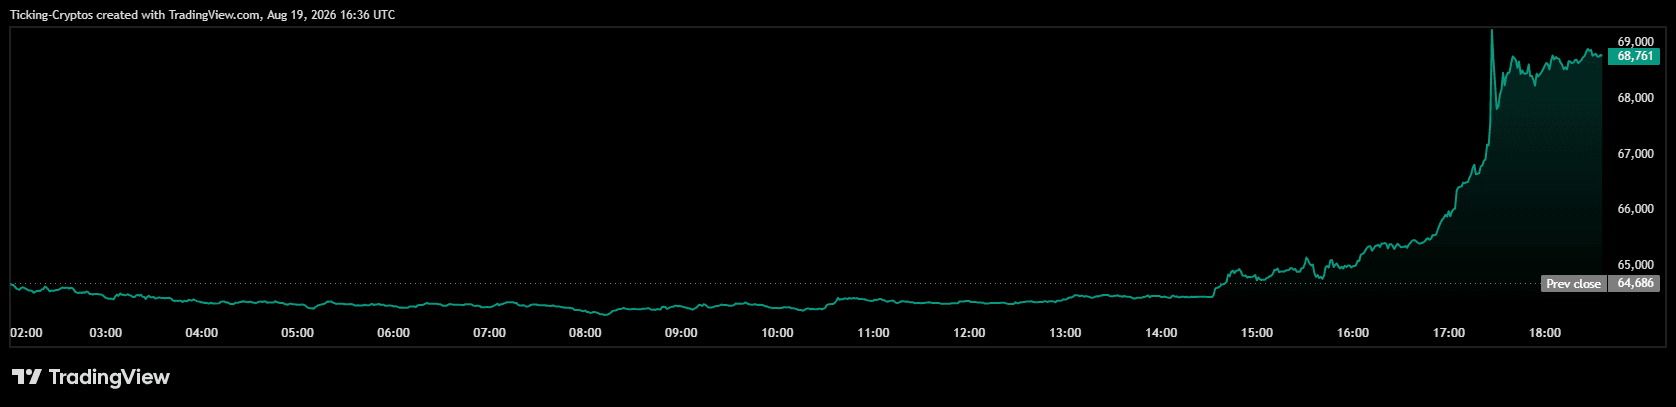
Why Bitcoin Price up today
The trigger came from the bond market, not from crypto. The US Treasury announced it will at least double the size of its long-dated buyback operations, from $2 billion to at least $4 billion per operation, starting 9 September. Long-end yields dropped immediately, the dollar weakened, and analysts nicknamed the move "QE Lite."
 Compare the best crypto exchanges
 CryptoTicker trading game: try it free
That mattered because $Bitcoin had spent the entire year losing a competition against a 30-year Treasury paying over 5% risk-free. Make the safe option less rewarding and capital rotates back into risk. The move was then amplified by roughly $10 billion of short liquidation liquidity sitting above the price, which turned a rally into a forced-buying cascade.
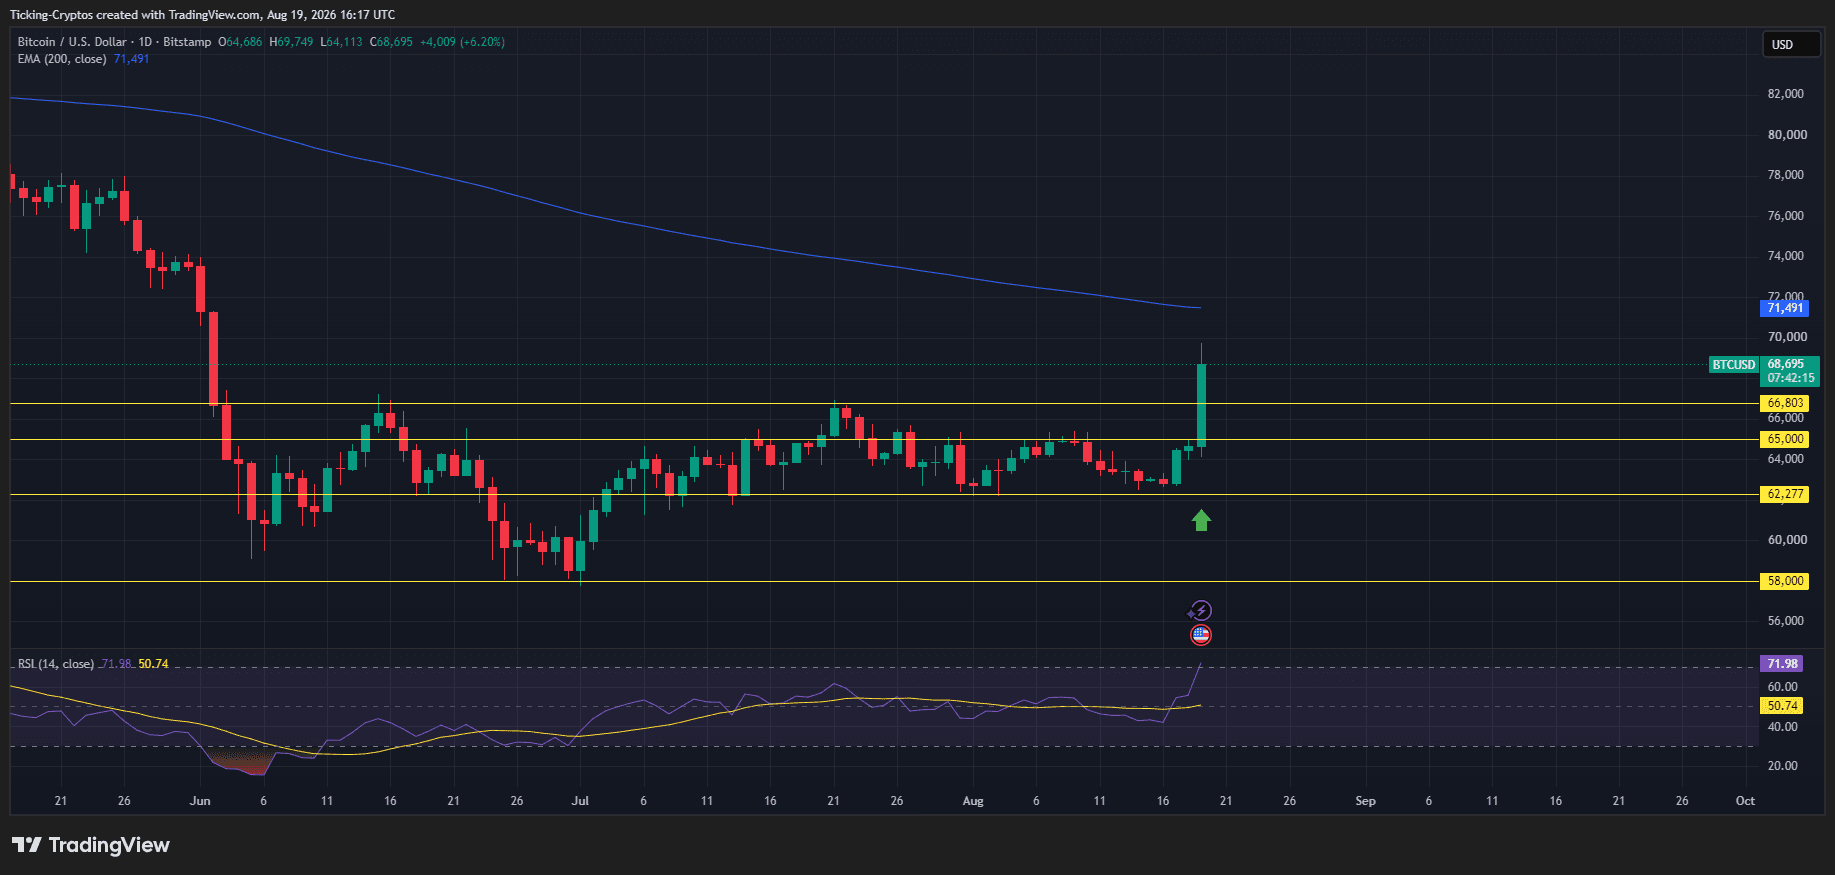
1. What just broke
The range that trapped Bitcoin since June is gone.
- $62,277 was the floor that absorbed every flush
- $65,000 was the psychological pivot that capped every attempt
- $66,803 was the ceiling that rejected every single rally since June
All three are now below the price. The daily candle opened at $64,686 and ran 7.83% to its high, clearing every one of them in a single session.
2. What the range height tells us
This is the part worth paying attention to.
The range measured $66,803 at the top and $62,277 at the floor, a height of $4,526. The standard measured-move projection adds that height to the breakout point:
$66,803 + $4,526 = $71,329
Now look at where the 200-day EMA sits: $71,491.
Two completely unrelated methods, one geometric and one based on a moving average, land within $162 of each other. That confluence zone around $71,300 to $71,500 is the next target, roughly 4% above the current price.
 FOMO FamilySponsored
From the chart to the trade, on your phone
We used FOMO Family ourselves and bought tokens with it. Deposit, find the token, buy: it takes seconds, with no wallet setup. Our link gets you ten percent off the fees.
Get the app and 10% off fees →Crypto is high risk, a total loss is possible. Partner link.
3. Why that zone is the real fight
The 200-day EMA is not just another line. It is the level that separates a relief rally inside a downtrend from an actual trend change. Bitcoin has not closed a daily candle above it since this decline began, and it is still sloping downward.
There is a second obstacle sitting just under it. Short-term holders, meaning wallets holding coins for less than 155 days, have an average cost basis near $68,700. Bitcoin is trading almost exactly at that number right now, which means every buyer from the decline just got back to breakeven. Breakeven is historically where a lot of people sell to get out.
So Bitcoin faces two walls in quick succession: a supply overhang at current price, then the EMA at $71,491.
📈 Trading this move?
Days like this are exactly when having a broker account already open matters. XTB gives you crypto, stocks, ETFs, indices and commodities from a single regulated European account, with no inactivity fee and no minimum deposit.

CFDs are complex instruments and come with a high risk of losing money rapidly due to leverage.
The momentum problem: Will Bitcoin Crash Again?
The daily RSI jumped to 71.98 from a moving average sitting at 50.74. That gap is enormous. It tells you the move was near-vertical rather than a gradual build, and it puts the daily RSI into overbought territory for the first time in months.
Vertical moves into overbought conditions resolve two ways: a sharp continuation that squeezes the remaining shorts, or an equally sharp snapback that fills the candle. The indicator will not tell you which comes first.
Bitcoin Price Prediction: The levels to watch
Upside
- $70,000 is 0.36% above today's high, and round numbers attract liquidity
- $71,329 to $71,491 is the confluence target, measured move plus 200-day EMA
- $75,000 becomes the conversation only if the EMA breaks and holds, roughly 9% higher
Downside
- $66,803 flipping from resistance to support is the first real test of the breakout
- $65,000 losing this means the breakout failed
- $62,277 back to square one
Frequently asked questions about the Bitcoin breakout to 69,749 dollars
More on Bitcoin: All Bitcoin news at a glance
Related articles
- Bitcoin Price Prediction: 24,912 Calls Against 8,223 Puts, What Friday's Expiry Decides
- XRP Price Crash Continues: XRP Loses $1.30 Support, Here Is the Next Target
- Bitcoin Price Crash Continues: BTC Slips Below $78,000, Here Is the Next Target
- Bitcoin Price Crash: Top 3 Reasons Why BTC Price Dropped Below $80,000
- Bitcoin Price Prediction: Standard Chartered Sticks to $100,000 as ETFs Shed $729 Million in Two Days
Which topics should we dive deeper into?
Select what genuinely interests you. Your picks feed directly into our editorial planning.
Crypto news that's actually worth your time.
Weekly. 60 seconds. Carefully curated by our editors: no hype, no promo flood, no spam.

September 23, 2026 7:36 AM

Cardano Price Prediction: ADA Rockets 30% as Bulls Eye the Next Big Target
Cardano price jumped over 30% in a week, reclaiming the 200 EMA. Here's what's driving ADA and the price targets traders are watching next.
September 22, 2026 5:54 PM
XRP Price Prediction: Breakout Puts $1.80 Back In Play
XRP just snapped its descending trendline and reclaimed $1.50 with RSI at 67. Here is what the daily chart says about the road to $1.80 and above.
September 21, 2026 10:40 AM

Bitcoin Price Explodes Past $84,000: Here Is What Is Driving BTC
Bitcoin just ripped through months of resistance in a single session. Here are the real reasons behind the BTC rally and the level that matters next.
September 11, 2026 8:32 AM

Bitcoin Price Drops 4% in a Week, and the Chart Just Got Interesting
Bitcoin price fell 4% this week and lost the $78,000 shelf. Here is what the chart says about the next support, resistance and price targets.
September 6, 2026 11:19 AM

Bitcoin Price Today: BTC Holds Firm Before The Biggest Week Of The Month
Bitcoin sits near $80,000 after a jobs report killed a four-month high. CPI, the Fed and a Senate vote all land in the next ten days.
August 30, 2026 1:32 PM
Bitcoin Price Correction: Why BTC Stalled Dead at $78,000 Again
Bitcoin corrected from $81,455 after a hawkish Fed. The chart shows the exact same rejection level as May. Here are the upside and downside targets.
August 25, 2026 3:56 PM

Bitcoin Price Cracks $80,000 Then Cools While Altcoins Push Higher
Bitcoin cleared 80,000 dollars for the first time since May, then slipped to 79,100. Chart analysis, upside targets and key support levels.
August 21, 2026 6:07 PM
Bitcoin Cash Explodes 29% In A Day: Why BCH Outperformed BTC?
Bitcoin Cash jumped 29.41% to $288, the biggest daily gain of any major coin. The reason has almost nothing to do with Bitcoin Cash itself.
August 21, 2026 5:08 PM

Ethereum Price Above $2,300: 3 Reasons Why ETH Is Leading This Rally
Ethereum jumped past $2,300 and is now testing $2,400. ETH is outpacing Bitcoin, and the reasons are specific to Ethereum.
August 21, 2026 7:43 AM
Bitcoin Price Above $75,000: 3 Reasons Why BTC Is Exploding
Bitcoin cleared $75,000 for the first time since May and is up almost 20% this week. Here are the 3 reasons and the next target.

August 19, 2026 10:44 PM
Hyperliquid Price Explodes 22%: Here Is the Next Target
HYPE ripped from $57.96 to $72.16 in a single day. The chart shows one level standing between it and a new record.
August 19, 2026 6:42 PM

XRP Price Explodes 6.6%: Here Is the Next Target
XRP printed a low of $0.99524, took out every stop under the dollar, and closed 7.9% higher. Here is what the reversal sets up.
August 19, 2026 6:13 PM
Ethereum Price Explodes 9.5% and Stops 1% Short of THE Level
ETH just outran Bitcoin, reclaimed $2,000 and closed 23 dollars below the line it has not touched all year.
August 16, 2026 3:33 PM
XRP Price on the Edge of $1: Why the Next Bitcoin Drop Could Crash XRP to $0.80
XRP price is stuck at $1 after breaking it several times. Weekly RSI at 31 and a weak Bitcoin put the next supports at $0.90 and $0.80.
August 8, 2026 10:00 AM
Bitcoin Price Prediction: BTC Is Sitting On The Line That Decides The Next Big Move
Bitcoin is knocking on the door of a key resistance zone. A clean break opens the path much higher, while losing a nearby floor risks a fast slide down.
August 7, 2026 2:16 PM
Bitcoin Price Analysis: Why BTC Rose Despite The Crypto Bill Delay
The Senate punted the CLARITY Act to September and Bitcoin rose anyway. The chart explains why, and it is not the story most people are telling.
July 15, 2026 7:50 AM
Bitcoin Breaks $65,000: Why BTC Is Ripping Higher and Where It Goes Next
Bitcoin just smashed through $65,000 on cooling US inflation. Here's the price analysis, macro triggers and what ETH, XRP, SOL and DOGE are doing.
July 11, 2026 2:16 PM
Bitcoin Price Prediction: Can BTC Reach $70,000 After the CPI Test?
Bitcoin is grinding higher into a make-or-break week. One level is capping the rebound, one macro event could decide the next move — here's what the chart says.
July 3, 2026 11:42 AM

Ethereum Price Jumps 5% Above $1,700 as Bitcoin Reclaims $60K — Here Are the Next Targets
ETH surged over 5% in 24 hours to reclaim $1,700 as BTC pushed back above $60K on a dovish Fed. Here are the key levels and targets that decide the next move.
June 22, 2026 2:21 PM

Bitcoin Price Prediction: Saylor Buys More BTC as Market Tests $65K
Strategy added 520 BTC as Bitcoin trades near $65K. Is Saylor calling the bottom, or is BTC still facing rejection risk?
May 17, 2026 5:14 PM
Bitcoin Price Prediction: Fed Liquidity Turns Bullish as BTC Holds Near $78K
Bitcoin holds near $78K as Fed liquidity signals improve. Could rising liquidity support the next BTC recovery?
May 10, 2026 1:29 PM
Solana Price Eyes $100 Breakout as Bitcoin Solidifies Gains Above $80k
Solana (SOL) targets the $100 psychological level while Bitcoin (BTC) holds firmly above $80,000, signaling a major shift in the 2026 crypto market structure.
May 2, 2026 4:56 PM
Crypto Price Prediction May 2026: Bitcoin Targets $90,000 as Altcoins Prep for Breakouts
Bitcoin eyes $90,000 in May 2026. Ethereum, XRP, and Cardano prepare for major breakouts contingent on a bullish BTC trend.
April 22, 2026 9:11 AM
Bitcoin Price Hits $78,000 as Ceasefire Extension Ignites Bullish Momentum
Bitcoin breaches $78,000 following the US-Iran ceasefire extension and a $2.5 billion MSTR purchase. Here is the weekly BTC chart for key 2026 price targets.
April 20, 2026 5:18 PM

Bitcoin Breakout or Breakdown? The $74K Level That Will Decide Everything
Bitcoin hovers near $74K as markets await a breakout or breakdown. Key levels, CME gaps, and macro risks could decide the next move.


More from CryptoTicker