
Ethereum Price Explodes 9.5% and Stops 1% Short of THE Level
ETH just outran Bitcoin, reclaimed $2,000 and closed 23 dollars below the line it has not touched all year.





Which topics should we dive deeper into?
Select what genuinely interests you. Your picks feed directly into our editorial planning.
Crypto news that's actually worth your time.
Weekly. 60 seconds. Carefully curated by our editors: no hype, no promo flood, no spam.
Ethereum has just delivered its strongest daily gain of the summer, jumping 9.51% to $2,098.70 after opening at $1,916.50 and running as high as $2,112. It outperformed Bitcoin by a wide margin, and it is now sitting 1.13% below the single most important level on its chart.
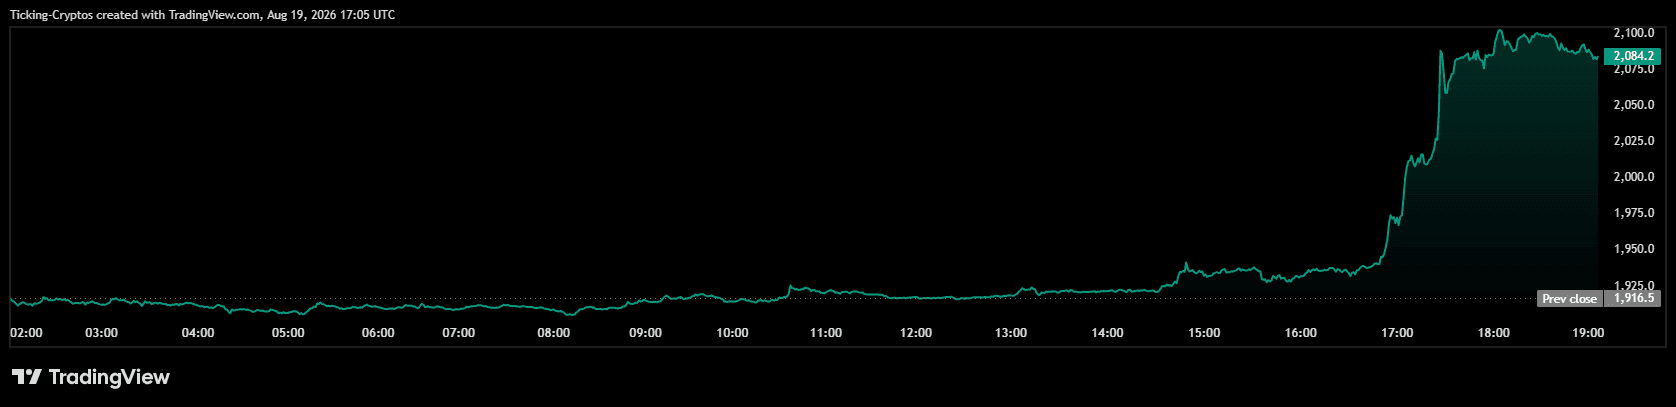
Why Ethereum Price is up today
Same trigger as the rest of the market: the US Treasury announced it will at least double its long-dated bond buybacks, pushing yields down and the dollar lower in a move analysts labelled "QE Lite." Easier financial conditions send capital back toward risk.
But $Ethereum did not just participate, it led. ETH gained 9.51% while Bitcoin gained 6.20%. That is the point of this article, because in crypto, who leads tells you what kind of move this is.
The setup nobody was watching
Ethereum spent seven weeks doing almost nothing. From early July onward, price ground sideways between roughly $1,800 and $1,950, never breaking out, never breaking down. The daily RSI moving average flatlined near 55.
Then in one session ETH travelled 10.87% from its intraday low of $1,904.90 to its high of $2,112, blowing through the $2,000 handle it had not seen in weeks.
The number that matters: 2,122.4
Here is the whole story in one line: Ethereum's 200-day EMA sits at $2,122.40. ETH closed at $2,098.70.
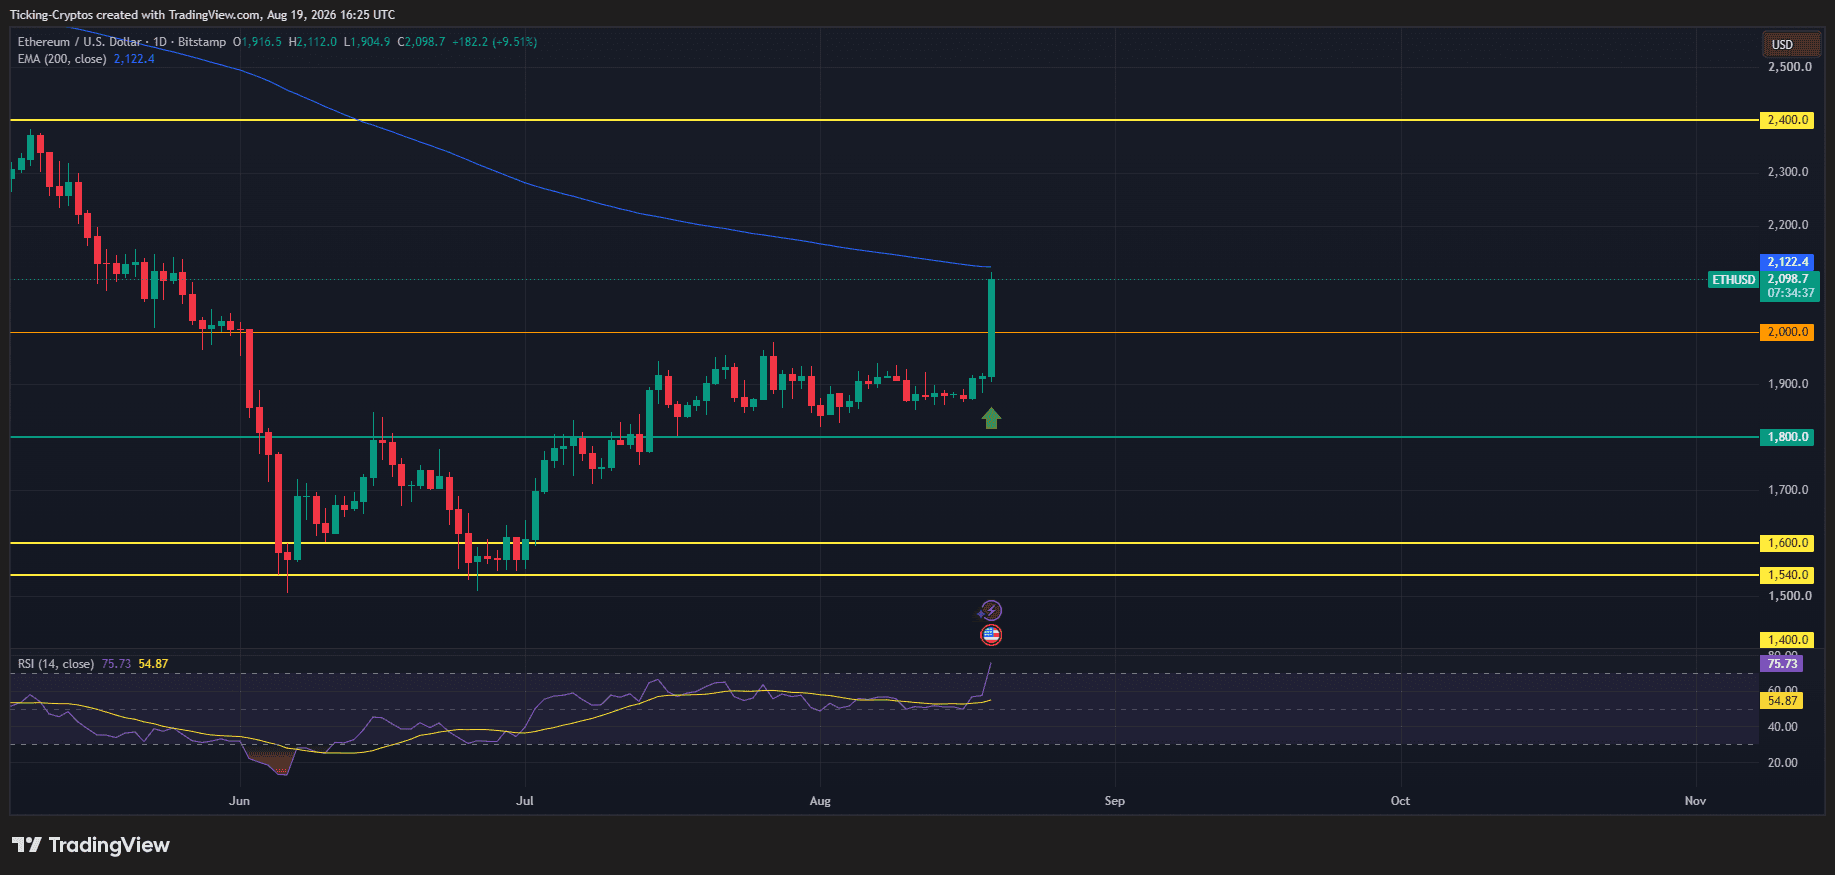
That is a gap of 1.13%. The intraday high of $2,112 came within 10 dollars of touching it before sellers stepped in.
This is the level Ethereum has been trading below for the entire decline. It is the line that separates "oversold bounce" from "the trend has actually changed." And after seven weeks of nothing, ETH covered the entire distance to it in a single day and then stalled.
That is not a coincidence. That is where the sellers were waiting.
What happens if it breaks
If Ethereum takes out $2,122 and holds it on a daily close, the chart opens up considerably, because there is very little structure between there and the next major level.
 FOMO FamilySponsored
From the chart to the trade, on your phone
We used FOMO Family ourselves and bought tokens with it. Deposit, find the token, buy: it takes seconds, with no wallet setup. Our link gets you ten percent off the fees.
Get the app and 10% off fees →Crypto is high risk, a total loss is possible. Partner link.
The $1,800 to $2,000 band that contained ETH through July and August is 200 dollars wide. Projecting that height above the breakout gives $2,200 as the first mechanical target.
Above that, the next horizontal level of any significance is $2,400, which is 14.36% higher than the current price. That is the level that capped Ethereum before the June collapse, and there is a lot of open air between $2,200 and $2,400.
So the sequence is straightforward: $2,122 first, then $2,200, then $2,400.
⚽ Bitpanda is giving away a full season in the stands
Quick break, because this one closes in days. Bitpanda's "The Stands Await" draw hands one winner two tickets to every home league match of the 2026/27 season at FC Bayern München, Arsenal, AC Milan or FC Basel.
Redeem your club code (BAYERN26, ARSENAL26, ACMILAN26 or BASEL26) and invest at least 50 euros before 24 August 2026, 23:59 CEST.

👉 Enter the Bitpanda draw here
Home domestic league matches only. No cups, no Champions League, no away games. Travel and accommodation are not included.
Ethereum Crash: What happens if it fails
The rejection scenario is equally clean. If ETH cannot close above $2,122, the levels below are well defined:
- $2,000 is the first line. It was resistance for weeks and needs to hold as support now, or the breakout is a one-day event
- $1,800 is where the July and August base sat, and losing it would undo the entire summer
- $1,600 and $1,540 are the deeper shelves from the June capitulation
The warning in the RSI
The daily RSI is at 75.73 against a moving average of 54.87. That is not just overbought, it is a 21-point gap opened in a single session.
Readings that stretched usually mean one of two things: the start of a genuine momentum regime, or exhaustion. What separates them is what the price does at the level it just ran into. And Ethereum ran directly into its 200-day EMA.


Frequently asked questions about the Ethereum price
More on Ethereum: All Ethereum news at a glance
Related articles
- Ethereum (ETH) Up To $4000: Can ETH Break Out From The 3K Levels?
- Bitcoin Price Rips to $69,749: Here Is the Next Target
- Ethereum Price Prediction: ETH Is Preparing for a Breakout From This Ascending Channel Formation
- Ethereum Price Hit $2,600 Then Stalled: Here Is What Decides the Next Move
- Ethereum Price Prediction: Can BlackRock’s $103M Buy Push ETH to $4,000?
Which topics should we dive deeper into?
Select what genuinely interests you. Your picks feed directly into our editorial planning.
Crypto news that's actually worth your time.
Weekly. 60 seconds. Carefully curated by our editors: no hype, no promo flood, no spam.

August 21, 2026 5:08 PM

Ethereum Price Above $2,300: 3 Reasons Why ETH Is Leading This Rally
Ethereum jumped past $2,300 and is now testing $2,400. ETH is outpacing Bitcoin, and the reasons are specific to Ethereum.
August 10, 2025 11:00 PM

Ethereum Price Prediction: Can the OKX Giveaway Boost ETH Price to a New ATH?
Ethereum trades above key support with bullish momentum. Could OKX’s latest giveaway help push ETH toward a new all-time high?
February 26, 2025 9:17 AM

Ethereum Price Prediction: Ethereum Price Poised for a Breakout with the SEC Staking Approval Fuel Optimism
Find the Ethereum price prediction based on Ethereum's price movements, bullish technical indicators, and the impact of SEC's acknowledgment of Grayscale's Ethereum ETF staking proposal.
August 13, 2025 8:40 AM

Ethereum Price Hits New High at $4,678 – $5K SOON as BlackRock Buys $318.7M in ETH...
Ethereum reached a new high of $4,678, edging closer to its 2021 record. With BlackRock purchasing $318.7M worth of ETH, the $5K milestone may be next.
December 19, 2024 11:38 AM

Is an Ethereum Price Crash Imminent?
Ethereum price has dipped igniting fears of a potential price crash. Analysts highlight bearish signals, but some still predict a recovery. Which is it next?
August 24, 2026 12:22 PM

Ethereum Price Prediction: Is $3,000 the Next ETH Target?
ETH ripped 29% and reclaimed the 200 EMA. Our Ethereum price prediction explains the path to $3,000 and the one level that kills the bull case.

August 30, 2026 10:56 AM

Ethereum Price Prediction: Can ETH Blast Toward $2,750 Next?
Ethereum price prediction after a 30% August rally: ETH sits at $2,453 with RSI cooling. Here are the bullish and bearish ETH price targets.
May 2, 2026 4:56 PM

Crypto Price Prediction May 2026: Bitcoin Targets $90,000 as Altcoins Prep for Breakouts
Bitcoin eyes $90,000 in May 2026. Ethereum, XRP, and Cardano prepare for major breakouts contingent on a bullish BTC trend.
February 19, 2025 7:40 PM

Ethereum Price Prediction: Is ETH Heading Toward $4,000?
Ethereum is showing signs of a major price move, with only 6.38% of its total supply left on exchanges. Could ETH be heading toward $4,000? Here’s what on-chain data and market trends indicate.
September 18, 2026 11:39 AM

Ethereum Price Prediction: Why ETH Is Closing In on $3,000
Ethereum is coiling between $2,400 and $2,600 with a rising 200 EMA underneath. Here is what the ETH chart says about $3,000.
April 19, 2026 6:34 PM

Ethereum Price Analysis: Key Levels Holding, Will ETH Crash or Bounce Toward $2,500?
Ethereum tests critical support near $2,330. Will ETH bounce toward $2,500 or break lower? Full price analysis and targets.
May 16, 2026 2:22 PM

Ethereum Price Analysis as ETH risks Crashing below the $2,000 Support
Ethereum struggles to stay above key support levels. Technical charts and rising exchange inflows indicate that ETH could drop below $2,000 soon.
July 27, 2026 10:57 AM
Ethereum Price Analysis: ETH Rips 30%, Is $2,000 Next?
Ethereum just printed a 55-day high of $1,980 and is up 30% in 30 days. Here is what the 3H chart says about $2,000 and the targets beyond it.
June 21, 2026 6:07 PM

Ethereum Price Prediction: ETH Trendline Break Could Decide the Next Move
Ethereum price prediction as ETH trades near $1,726 and tests a key trendline. Can Ethereum recover, or is more downside ahead?
July 30, 2024 3:46 PM

XRP Price Prediction: Why Is ONLY XRP Price UP While The Crypto Market Is DOWN?
Despite the recent crypto market downturn, how did only XRP Price surge and break its 10-day resistance level?
June 12, 2024 2:17 PM

Ethereum (ETH) Price Prediction For BULLISH And BEARISH Scenarios
The latest analysis of Ethereum's price movements as of June 12, is divided between the 2 scenarios: bullish and bearish. But what drives each, and which is more likely to occur?
September 26, 2026 1:02 PM
Ethereum Price Prediction: ETH Defends Key Support, Is $3,000 Next?
Ethereum is consolidating near $2,700 after a rejection at $2,800. Our Ethereum price prediction looks at what ETH needs for a run at $3,000.
February 18, 2026 6:53 AM

Ethereum Price Prediction: Will the $2,000 Support Hold or Is a Deeper Correction Looming?
Ethereum price struggles to maintain the $2,000 psychological level. Analyze the latest ETH coin news and price predictions for 2026 amid market consolidation.
August 22, 2024 9:00 PM

MAJOR Bitcoin News: Bitcoin Price SURGE Expected At This Level
Bitcoin and Ethereum are at critical junctures, with key resistance levels in sight. Are the markets poised for a breakout, or will bearish pressures prevail? Explore the latest analysis and insights.
July 3, 2026 11:42 AM

Ethereum Price Jumps 5% Above $1,700 as Bitcoin Reclaims $60K — Here Are the Next Targets
ETH surged over 5% in 24 hours to reclaim $1,700 as BTC pushed back above $60K on a dovish Fed. Here are the key levels and targets that decide the next move.
January 15, 2026 4:40 PM

Ethereum Price Prediction: Will ETH Break $4,000 in Q1 2026?
Ethereum is showing strong bullish momentum in early 2026. Can ETH break the $4,000 barrier? Here's what's happening to Ethereum coin price.
August 10, 2024 6:02 PM

Ethereum Price Prediction: Amid Mixed Signals What To Expect For ETH Price?
Ethereum faces volatility and competition, but signs of bullish activity and whale accumulation suggest potential recovery. How does it compare to Solana, and what does the future hold for ETH?
May 22, 2025 5:27 PM

Ethereum Price Prediction: KEY Levels to Watch for Next Week
Ethereum is showing strong momentum as it trades at $2,660. With key levels in play and bullish signals flashing, what will ETH do next week?
August 2, 2024 10:32 PM
Ethereum Price Crash: What Next Support Levels For ETH Price Below $3K?
Ethereum fees just hit their lowest since late 2023, and now Ethereum price is trading near $3K with a high potential to drop below it... What's next?
November 17, 2025 8:55 PM

BREAKING: Ethereum Price Crashes Below $3,000 as Bitcoin Triggers Market Meltdown
Ethereum drops under $3,000 after Bitcoin’s fall below 92K. Chart signals deeper weakness as key support levels fail.


More from CryptoTicker