
Ethereum Price Analysis: ETH Rips 30%, Is $2,000 Next?
Ethereum just printed a 55-day high of $1,980 and is up 30% in 30 days. Here is what the 3H chart says about $2,000 and the targets beyond it.


Which topics should we dive deeper into?
Select what genuinely interests you. Your picks feed directly into our editorial planning.
Crypto news that's actually worth your time.
Weekly. 60 seconds. Carefully curated by our editors: no hype, no promo flood, no spam.
$Ethereum has quietly put together one of its strongest months of 2026. ETH tagged $1,980 in early European hours on July 27, a level it had not seen in 55 days, and is now trading around $1,958 after a marginal pullback. Zoom out and the move is bigger than it feels: ETH bottomed near $1,540 in late June and has gained roughly 30% in 30 days.
 Compare the best crypto exchanges
The rally has been methodical rather than explosive. Higher lows since July 1, a clean break of $1,800 in mid-July, and now a direct test of the psychological $2,000 barrier. The question for traders is whether this is the start of a genuine trend expansion or the final leg of a relief rally into heavy supply.
What Does the ETH Chart Actually Show?
The 3-hour chart tells a clean story in three phases.
- Phase one, the base. Between June 24 and June 30, $ETH ground sideways in a tight $1,540 to $1,600 box. That range low was defended three separate times. It is the single most important reference level on the entire chart, because it is where sellers ran out of ammunition.
- Phase two, the breakout. ETH cleared $1,600 on July 1 and never looked back. Price ran to $1,800 by July 5, stalled, pulled back to $1,720, and then built a higher base. On July 14 a single large candle punched through $1,800 on visibly expanded volume. That level has since flipped from resistance into support, which is the textbook behaviour you want to see after a breakout.
- Phase three, the grind higher. From July 15 onward ETH built a $1,800 to $1,935 range, tested the top twice (July 16 and July 22), pulled back to a higher low near $1,845 on July 25, and then broke out again on July 26 into the current $1,980 high.
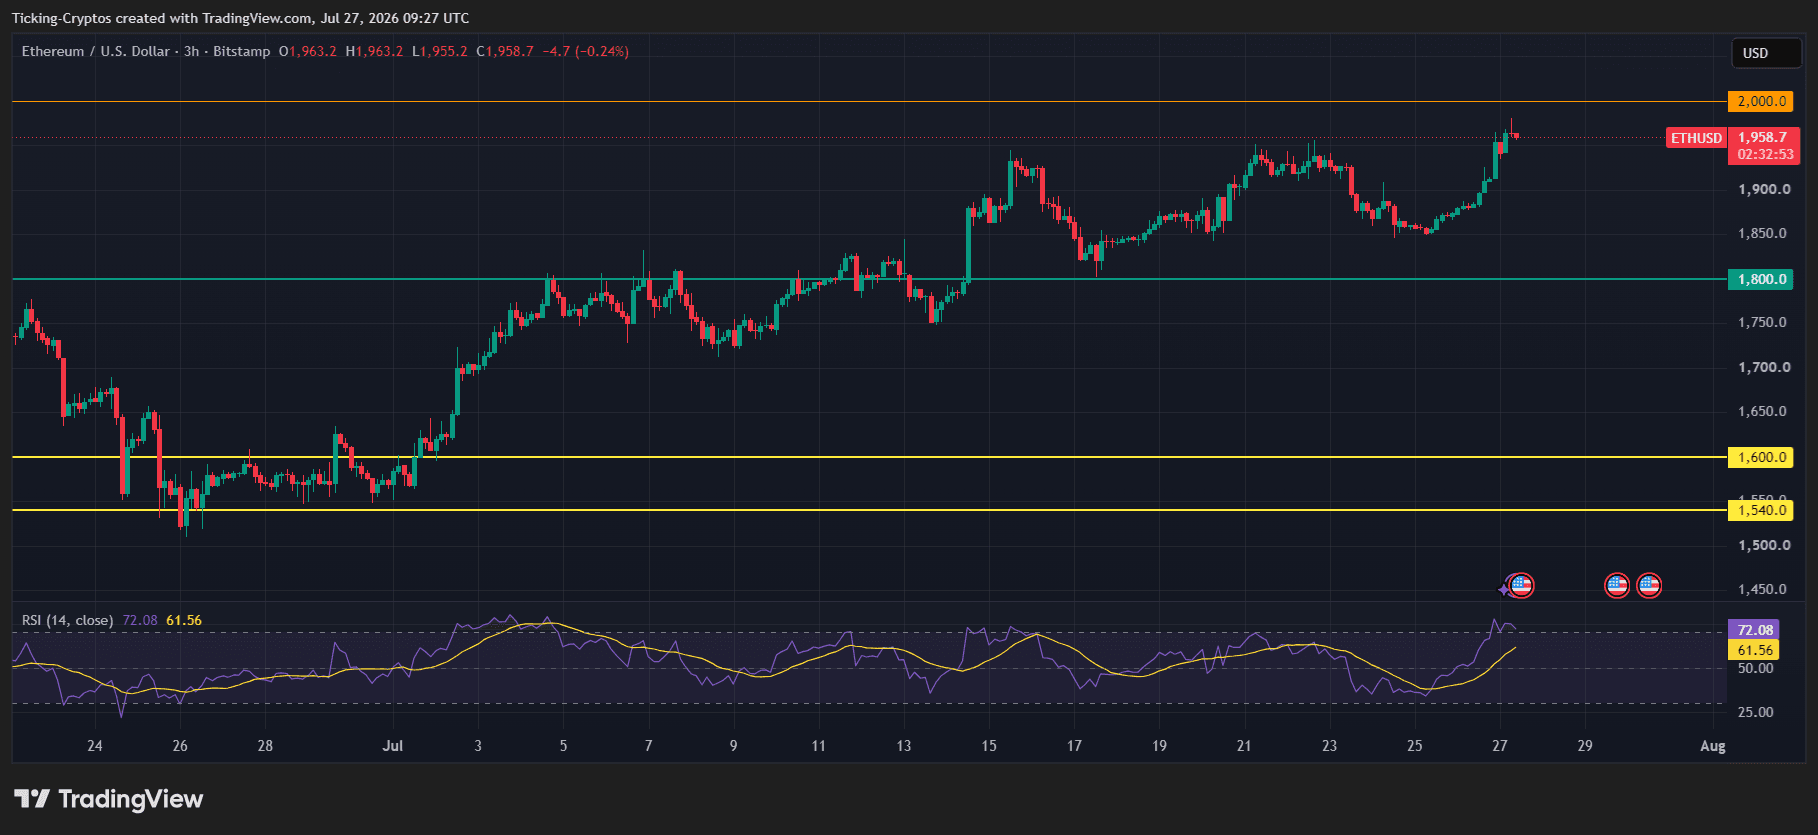
The structure is intact: higher highs, higher lows, and a flipped support level holding on every retest. Nothing on this chart is broken.
Is ETH Overbought at RSI 72?
The 14-period RSI sits at 72.08, comfortably above its 61.56 signal line. That is technically overbought territory, and it is the first thing bears will point to.
Context matters here. RSI above 70 in a downtrend is a sell signal. RSI above 70 in a confirmed uptrend is a momentum confirmation. Look at what the oscillator did during this move: it peaked near 78 in early July and price kept climbing for three more weeks. More importantly, RSI never broke below 40 on any of the pullbacks. That is the signature of a bullish regime, not an exhausted one.
The caveat worth flagging: price has made a higher high at $1,980 while RSI is reading lower than its early-July peak. That is a mild negative divergence. It does not invalidate the trend, but it does suggest the next leg needs fresh buying rather than momentum alone.
What Are the Upside Targets for Ethereum?
- Target 1: $2,000. The obvious one. Round numbers attract liquidity, stops sit above them, and options open interest clusters there. A 3H close above $2,000 with follow-through volume is the trigger for everything else.
- Target 2: $2,070. This is the measured move. The July consolidation between $1,800 and $1,935 was roughly $135 tall. Project that from the breakout point and you land at $2,070. Measured moves are not guarantees, but they give you a mechanical, non-emotional first objective.
- Target 3: $2,150 to $2,200. Above the measured move, ETH runs back into supply left behind from the late-May and early-June breakdown. This is where anyone who bought the previous range and held through the drawdown gets their chance to exit at breakeven. Expect resistance to be sticky here.
Worth noting: prediction markets earlier this month priced only a 32% chance of ETH touching $2,000 before July closes. That positioning is now badly offside, which is exactly the kind of setup that produces squeeze candles.
 CryptoTicker trading game: try it free
Where Is the Downside Risk?
Bulls have three lines of defence, in order:
- $1,900: the immediate breakout retest. A dip here is normal and healthy.
- $1,845 to $1,850: the most recent higher low from July 25. Losing this breaks the short-term sequence and puts the July rally on hold.
- $1,800: the structural line. This is the flipped resistance, and it is the level that defines whether the entire July trend is still alive. A sustained 3H close below $1,800 turns the chart neutral to bearish and reopens $1,600 as a downside magnet.
Below that, $1,600 and then the $1,540 base are the last stops. A return there would mean the whole 30% move was a bull trap, which the current structure does not support, but it is the map you want if things break.
What Could Move ETH This Week?
The chart shows US macro event markers clustered on July 27, 29 and 30, and they matter.
The FOMC announces its rate decision on Wednesday, July 29 at 2:00 PM ET, following a two-day meeting. Consensus is for another hold in the 3.50% to 3.75% range, so the reaction will hinge on the statement language and the press conference rather than the number itself. Any hint of a more accommodative stance would be fuel for high-beta assets like ETH.
On top of that, a wave of mega-cap tech earnings lands in the same week, which tends to drive broad risk sentiment. Crypto has been trading with a high correlation to the Nasdaq for most of 2026.
The underlying bid, though, looks structural rather than macro. Spot ETH ETF flows have held up through the consolidation, staking participation is at record levels, and ETH's market cap has climbed back to roughly $237 billion. Those are slow-moving drivers, and they are the reason this rally has been a grind rather than a spike.
The Bottom Line for ETH Traders
Ethereum is in a confirmed short-term uptrend testing the most watched round number on its chart. The bull case needs a decisive close above $2,000 to open $2,070 and then $2,150. The bear case needs a loss of $1,845 to stall the move and $1,800 to end it.
The asymmetry currently favours the bulls, but $2,000 is a level that rarely breaks on the first attempt.
Frequently asked questions about the Ethereum price in July 2026
More on Ethereum: All Ethereum news at a glance
Related articles
- Ethereum price prediction: 986,847 ETH queue to stake while only 4,320 ETH wait to exit
- Ethereum Price Prediction: 77,441 Puts for November 13, Then the Options Market Flips
- Ethereum Price Below $2,300: Is $2,000 Next or Is This the Bottom?
- Ethereum Crash: The Binance Hacker Sits on 195,000 ETH. Is a Sell-Off Coming?
- Ethereum price prediction: $2.9 billion outflow, what to watch now
Which topics should we dive deeper into?
Select what genuinely interests you. Your picks feed directly into our editorial planning.
Crypto news that's actually worth your time.
Weekly. 60 seconds. Carefully curated by our editors: no hype, no promo flood, no spam.

October 26, 2026 9:32 PM

Ethereum price prediction: the 200-day line is the level that decides
Analysis: Ethereum trades at $2,308 on Monday evening and falls for the fourth day in a row, below the 200-day average of $2,329 for the first time since August 20. Price, averages and the Fed date on Wednesday are documented; the editorial team's assessment stands separately in the text.
October 24, 2026 10:24 PM

Ethereum price prediction: the premium for leveraged buys falls to zero, and $2,311 is the level that decides
Analysis: it is documented that the funding rate for leveraged Ethereum buys on OKX has fallen to zero for the period up to midnight, the first time since October 13, and that Ether is quoted at $2,300 on Saturday evening. Our assessment follows further down: cheap leverage turns no price, and the 100-day line at $2,311 decides the direction.
October 12, 2026 10:19 AM

Ethereum price prediction: the price turned higher at $2,495.93, and two dates decide this week
Ether's daily low came in at $2,495.93, so the level held by 93 cents. Two fixed dates shape the week: the US price index on Wednesday and the options expiry on Friday.

October 9, 2026 1:06 PM

Ethereum Price Under $2,500: Is ETH a Good Buy Right Now?
Ethereum has slipped below $2,500 and the question in every chat group is the same: buy the dip, or stay out? Here is what is driving the price, what the near-term levels are, and what the long-term forecasts actually assume.
October 8, 2026 1:16 PM

Ethereum Price Prediction: “We Thought It Would Take Five Years”, and 100,000 Ether Separate BitMine From Its Buying Cap
BitMine holds 6,016,414 Ether and stops buying at five percent of the circulating supply, around 100,000 Ether short of that line. At the same time the spot ETFs pulled $506.3 million over five days, and Glamsterdam has no date for mainnet.
October 7, 2026 8:42 PM

Can XRP Price Reach $10? Here Is What the Math Says
XRP trades near $1.42 after losing $1.50. We check the $10 forecasts, the charts and the market cap math to see if XRP can really reach $10.

October 4, 2026 7:26 PM

Ethereum price prediction: five strong Octobers since 2018, but the last two closed lower
For Ether, October has been a positive month in five of the eight years since 2018, though not in 2024 and 2025. ETH enters this October at around $2,690, and the Sepolia testnet forks on October 6. What the record shows and which levels count.
October 3, 2026 1:22 PM

Ethereum Price Prediction: Ether ETFs Lose $118 Million in Three Days, Bitcoin Funds Gain
Roughly $118 million has left the US spot Ether ETFs over three consecutive trading days, while the Bitcoin funds are gathering cash again. ETH closes at its lowest level since September 20. These are the levels that now count.
October 2, 2026 4:40 PM

Ethereum price prediction: Citi raises its twelve-month target to $3,028, and what you can do now
Citi has raised its twelve-month target for Ethereum from $2,240 to $3,028. Anyone following that horizon also decides the tax on the gain with the purchase date.
September 30, 2026 10:15 AM

Ethereum Price Prediction: 1.6 Million ETH Face a 28-Day Wait for Activation, and What You Can Do Now
1,603,958 ETH are standing in the entry queue for Ethereum staking and waiting almost 28 days for activation. What that tied-up supply means for the price levels, for your yield and for the 256 euro exemption limit at the German tax office.
September 28, 2026 4:15 PM

Ethereum Price Prediction: The Level That Decides ETH Before the October 6 Sepolia Fork
Ethereum trades at $2,675.39 on September 28, just under 3 percent below the supply zone at $2,750 to $2,800. On October 6 the Sepolia test network forks to Glamsterdam, and separately from that, holders in Germany still have to settle before the year end what the holding period and the exemption limit allow.
September 27, 2026 4:25 PM

Ethereum Price Prediction: What to Check on ETH Before the Quarter Turns
Ethereum trades at 2,714.60 dollars on September 27, 2026 and remains pinned to the zone between 2,750 and 2,820 dollars. Which levels decide October, how far apart the analyst targets sit, and which checks to complete before the quarter turns.
September 26, 2026 1:02 PM

Ethereum Price Prediction: ETH Defends Key Support, Is $3,000 Next?
Ethereum is consolidating near $2,700 after a rejection at $2,800. Our Ethereum price prediction looks at what ETH needs for a run at $3,000.
September 24, 2026 10:36 PM

Ethereum Price Prediction: What to Check on Staking, Leverage and Where You Buy After Three Attempts at $2,800
Ether stands at $2,700 and has bounced off the zone around $2,800 three times in thirty days, without a single daily close above it. What our own count shows, and the three things to settle before the next attempt.
September 23, 2026 7:36 AM

Cardano Price Prediction: ADA Rockets 30% as Bulls Eye the Next Big Target
Cardano price jumped over 30% in a week, reclaiming the 200 EMA. Here's what's driving ADA and the price targets traders are watching next.
September 22, 2026 7:20 PM

ETH Price Prediction: What to Check at the $2,800 Mark Now
Ether stands at $2,735.96 on September 22, 2026, right below the zone at which it has failed repeatedly. Instead of a target number, you get four checks that count before your next order: holding period, buying route, the staking line and the distance to liquidation.
September 22, 2026 5:54 PM
XRP Price Prediction: Breakout Puts $1.80 Back In Play
XRP just snapped its descending trendline and reclaimed $1.50 with RSI at 67. Here is what the daily chart says about the road to $1.80 and above.
September 18, 2026 9:15 PM

Ethereum Breaks Through the $2,600 Mark: What Is Behind the Short Squeeze and What to Check Now
Ethereum rises almost 7 percent to $2,616 and clears the mark it failed at only days ago. Short positions worth $85 million were forcibly closed in the process. What that reveals about the rally and what you should check now.
September 18, 2026 11:39 AM

Ethereum Price Prediction: Why ETH Is Closing In on $3,000
Ethereum is coiling between $2,400 and $2,600 with a rising 200 EMA underneath. Here is what the ETH chart says about $3,000.
September 14, 2026 4:55 PM

Ethereum Price Hit $2,600 Then Stalled: Here Is What Decides the Next Move
Ethereum price tapped $2,600 for the first time since January, then faded. The Fed, the 200 EMA and a wall of ETH supply now decide the next leg.
August 30, 2026 10:56 AM
Ethereum Price Prediction: Can ETH Blast Toward $2,750 Next?
Ethereum price prediction after a 30% August rally: ETH sits at $2,453 with RSI cooling. Here are the bullish and bearish ETH price targets.
August 24, 2026 12:22 PM

Ethereum Price Prediction: Is $3,000 the Next ETH Target?
ETH ripped 29% and reclaimed the 200 EMA. Our Ethereum price prediction explains the path to $3,000 and the one level that kills the bull case.
August 19, 2026 6:13 PM
Ethereum Price Explodes 9.5% and Stops 1% Short of THE Level
ETH just outran Bitcoin, reclaimed $2,000 and closed 23 dollars below the line it has not touched all year.
July 23, 2026 11:31 AM
Ethereum Price Nears $2,000: Can ETH Break Resistance? Price Targets & Analysis
Ethereum trades at $1,921 and is testing the key $2,000 level after a strong July recovery. Here are the high and low targets to watch next.
July 3, 2026 11:42 AM

Ethereum Price Jumps 5% Above $1,700 as Bitcoin Reclaims $60K — Here Are the Next Targets
ETH surged over 5% in 24 hours to reclaim $1,700 as BTC pushed back above $60K on a dovish Fed. Here are the key levels and targets that decide the next move.


More from CryptoTicker