
Ethereum Price Hit $2,600 Then Stalled: Here Is What Decides the Next Move
Ethereum price tapped $2,600 for the first time since January, then faded. The Fed, the 200 EMA and a wall of ETH supply now decide the next leg.


Which topics should we dive deeper into?
Select what genuinely interests you. Your picks feed directly into our editorial planning.
Crypto news that's actually worth your time.
Weekly. 60 seconds. Carefully curated by our editors: no hype, no promo flood, no spam.
Ethereum spent most of the last three weeks doing very little, then packed an entire month of drama into a single session. On 11 September, $ETH ripped from roughly $2,437 to as high as $2,667, printed its first move above $2,600 in around eight months, and then handed most of it straight back. As of 14 September, the Bitstamp ETHUSD pair is trading near $2,505, up a rounding-error 0.19% on the session.
That combination, a violent spike followed by three days of nothing, is the whole story right now. $Ethereum has the buyers. What it does not yet have is the follow-through. Below is the macro picture and the technical picture, and where the two collide.


What Happened to the Ethereum Price This Week?
The trigger was the August US Consumer Price Index, released on 11 September. Headline inflation came in at 3.4% year over year, matching expectations, while core CPI rose 0.3% month over month, slightly hotter than forecast. On paper that is a mildly hawkish print. Crypto rallied anyway.
The reason is positioning, not economics. Traders had been leaning short into the data, and the move detonated them. Roughly $665 million in crypto positions were liquidated across the market in 24 hours, with about $400 million of that on the short side. Ethereum alone accounted for around $250 million, more than Bitcoin's roughly $170 million. Ali Martinez also flagged that ETH transfers above $1 million jumped 14% on the day, which points at large holders adding rather than retail chasing.
So the spike was real demand meeting thin liquidity above the range. The problem is what happened next: ETH closed the week near $2,619 and has since slid back under $2,500 before stabilising around $2,505. A breakout that cannot hold its breakout level is a test, not a trend.
Why Does the Fed Rate Hike Matter for the Ethereum Price?
Here is the part most ETH holders are underweighting. The Federal Reserve meets on 15 and 16 September, and the market is not debating the size of a cut. It is pricing a hike.
Futures and prediction markets have been assigning roughly 80% to 87% probability to a 25 basis point increase, which would lift the federal funds rate off the 3.50% to 3.75% range it has held all year. Goldman Sachs and J.P. Morgan have both moved their forecasts to include the hike. J.P. Morgan's team pointed at two drivers: energy costs kept elevated by ongoing supply disruption tied to the Iran conflict and the Strait of Hormuz, and investor doubt about the Fed's inflation credibility after it held in July. Separately, prediction markets put the odds of zero rate cuts across all of 2026 at above 90%.
For a duration-sensitive risk asset like ETH, that is a headwind, full stop. Higher policy rates and a 10-year Treasury yield hovering near 4.8% raise the opportunity cost of holding a non-yielding asset, and they compress the multiple the market is willing to pay for future growth.
The interesting wrinkle is that ETH rallied into this anyway. Goldman Sachs analyst Jonathan Shugar has argued that risk assets can still appreciate through a hiking move, which is one explanation for why institutional demand for ETH products has not flinched. Either the market has fully digested the hike and is looking past it, or it is about to get a reminder. Wednesday settles the argument.

Are Ethereum ETF Inflows Still Supporting ETH?
This is the strongest leg of the bull case, and it is not close.
Spot Ethereum ETFs absorbed $216.41 million on 11 September alone, according to SoSoValue data, with BlackRock's ETHA taking $148.8 million of that, its biggest single day since January. Combined trading volume across ETH ETF products topped $2.56 billion, nearly matching Bitcoin's $2.6 billion. Ethereum was the only major crypto fund category to record net inflows that day. Bitcoin and Solana products both saw money leave.
Zoom out and the divergence gets sharper. Ethereum spot ETFs sit at roughly $863 million in net inflows for 2026, while Bitcoin spot ETFs are around $1 billion net negative on the year. ETH also outperformed BTC on price from 11 August to 10 September, gaining about 33% against Bitcoin's 23%.
There is a corporate bid underneath it too. Bitmine, chaired by Fundstrat's Tom Lee, had accumulated roughly 5.9 million ETH by September, around 4.9% of circulating supply, with most of it staked. Lee has been publicly calling for what he describes as a face-ripper rally for short sellers. Treat the commentary as talking a book, but the accumulation itself is a genuine supply constraint.
What Does the Ethereum Technical Analysis Show on the 3-Hour Chart?
The 3-hour chart is unusually clean right now.
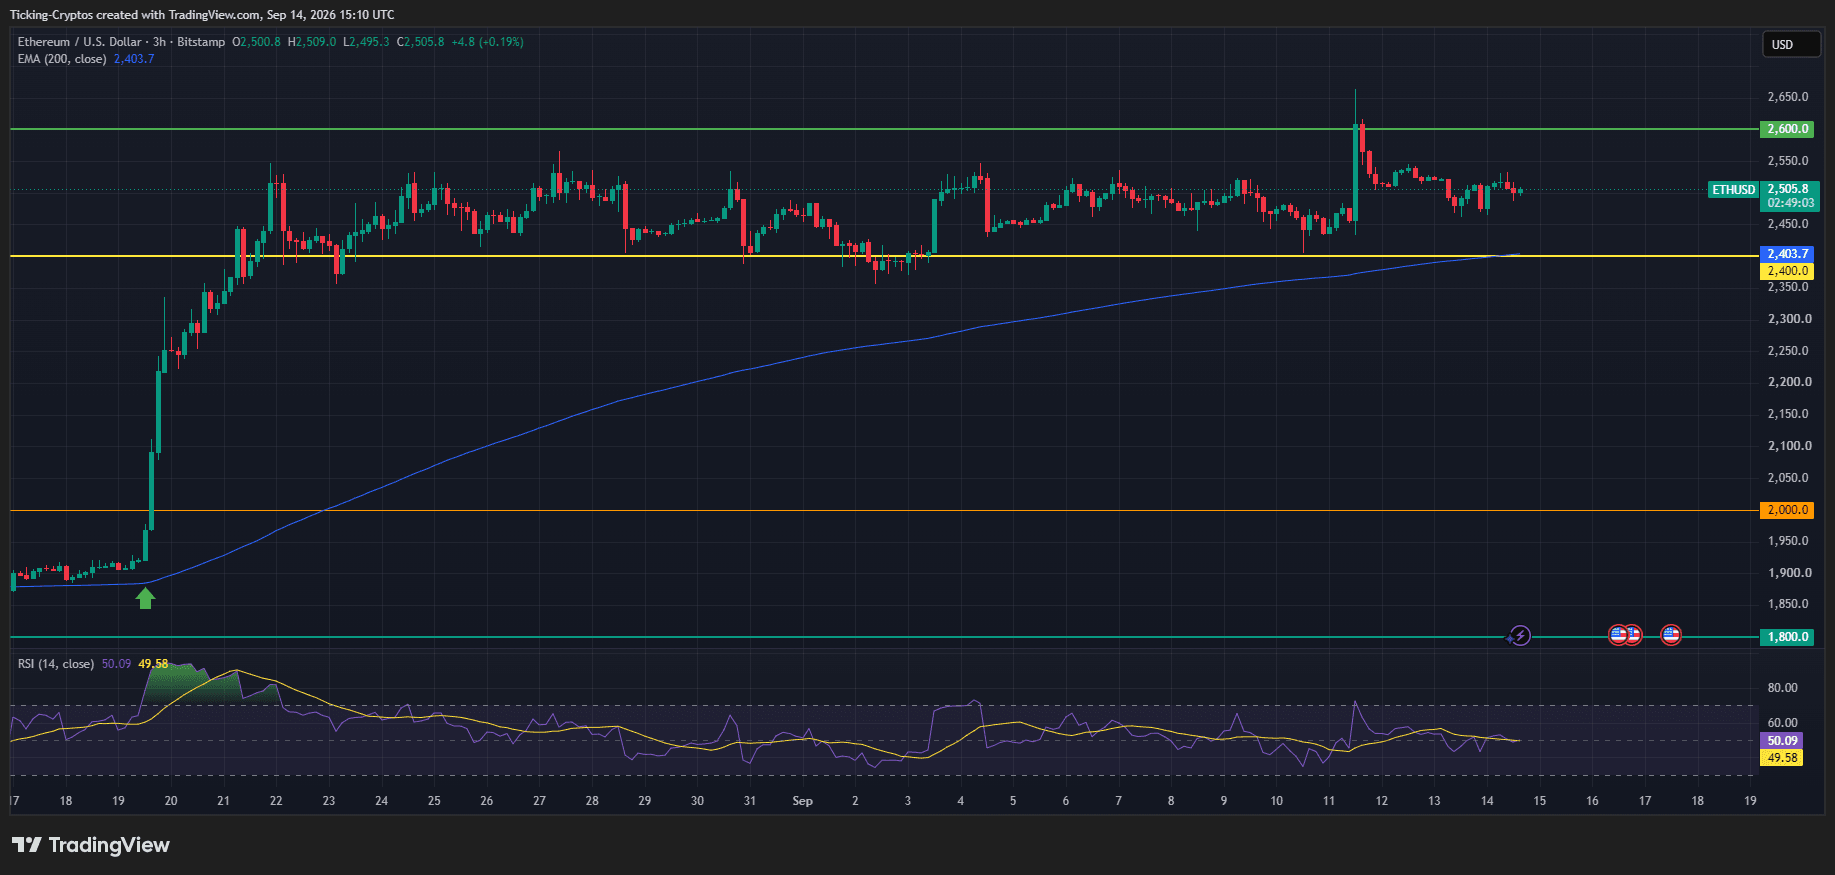
- The 200 EMA has caught up to price. The 200-period EMA sits at $2,403.7, and it has spent the last four weeks grinding higher from the $1,900 area while price went sideways. It has now converged almost exactly with the horizontal $2,400 level. When a moving average and a historical horizontal stack on top of each other, that level stops being a line and becomes a decision point.
- The breakout base is intact. The green arrow on the chart marks the 19 August ignition around $1,870. ETH added more than 30% in roughly 48 hours, clearing the descending trendline that had capped every rally since the August 2025 peak near $4,958. Everything since has been consolidation above that breakout, not a failure of it. Higher lows have held since the 3 September dip to the $2,370 zone.
- Momentum is flat, not weak. RSI (14) reads 50.09 with its signal line at 49.58. That is textbook neutral. The 11 September spike pushed RSI into the low 70s and it has since unwound back to the midline without price giving up the range, which is a healthy reset rather than a distribution signal. It also means neither side currently has an edge from momentum alone.
- The rejection candle matters. The 11 September wick to roughly $2,667 with a close back under $2,600 left a clear upper shadow. That is a supply print. Until ETH closes a candle above $2,600 and holds it, that wick is the ceiling.
Where Are the Key ETH Support and Resistance Levels?
Resistance:
- $2,550 is the immediate ceiling and the level analysts are watching for a weekly close. Clear it and $2,600 comes back into play quickly.
- $2,600 is the marked horizontal on the chart and the level that rejected on 11 September. It is the line that separates chop from trend.
- $2,700 to $2,800 is the real problem. Ali Martinez has pointed out that roughly 10 million ETH changed hands inside that band, creating a heavy supply wall. Every one of those holders is close to break-even, and break-even is where people sell. Clearing that zone is the precondition for any serious $3,000 conversation.
Support:
- $2,490 to $2,450 is the near-term shelf where the current range has been holding.
- $2,400 is the one that counts, because it is the horizontal and the 200 EMA together. Holding it keeps the August structure alive.
Below that, the chart offers very little until the $2,000 horizontal, with the next marked level all the way down at $1,800. That gap is thin air, which is exactly why $2,400 is worth defending.

What Is the Ethereum Price Outlook From Here?
Three scenarios, in rough order of probability as the chart currently sits.
- Range continuation (most likely near term). ETH keeps chopping between roughly $2,450 and $2,600 through the Fed decision. RSI at 50 and fading volume since the breakout both argue for this. Boring, but it is what consolidation above a breakout usually looks like.
- Bullish resolution. A daily or weekly close above $2,550, ideally confirmed by another heavy ETF inflow day, opens $2,600 and then the $2,700 to $2,800 supply wall. Getting through that band on volume is what would put $3,000 on the table. The ETF bid and the Bitmine accumulation are the fuel for this path.
- Bearish resolution. A close below $2,400 breaks both the horizontal and the 200 EMA in one move, which would invalidate the higher-low structure built since 3 September. A hawkish Fed surprise on 16 September, a hike plus language pointing at more, is the obvious catalyst. The measured downside from there runs toward the $2,220 area where the 50-day EMA sits, with little structural support before $2,000.
One more calendar item worth keeping on the radar: the Glamsterdam upgrade has slipped to Q4 2026, with the Sepolia testnet fork scheduled for 28 September and developers cautioning that the date can still move. It is not a this-week catalyst, but a confirmed testnet fork would give bulls a narrative to work with heading into October.
The short version: Ethereum has the institutional bid, the broken trendline and the higher lows. What it does not have is a close above $2,600 or a Fed that wants to help. Watch $2,400 and watch Wednesday.
Frequently asked questions about the Ethereum price at 2,600 dollars
Partner links: some links on this page are partner links. If you become a customer through one of them, we may earn a commission at no extra cost to you. Selection, ratings and ranking are decided independently by our editorial team. Ethics and Independence · Ownership and Funding
For later? Save this article and find it again in your profile.
More on Ethereum: All Ethereum news at a glance
Related articles
- Ethereum price prediction: Foundation wallet sells for a fourth time, ETF outflows 87 times larger
- Ethereum Price Crashes Below $2,000: How Low Can ETH Go?
- Ethereum price at $1,958: exit queue grows to 269,951 ETH as ETF outflows reach $696 million
- Ethereum price below $2,000: record staking meets ETF outflows
- Ethereum price prediction: Huang's exit pushes ETH below $2,000 as ETF outflows hit day five
Which topics should we dive deeper into?
Select what genuinely interests you. Your picks feed directly into our editorial planning.
Crypto news that's actually worth your time.
Weekly. 60 seconds. Carefully curated by our editors: no hype, no promo flood, no spam.

November 11, 2026 7:24 PM

Ethereum price prediction: can buyers hold $2,000 as ETF outflows shrink 99 percent?
Analysis: outflows from US ether ETFs shrank to $1.32 million on November 10, after $184.5 million the day before. Why ether is still stuck around the $2,000 zone and what role Friday's producer prices play.

November 10, 2026 3:21 PM

Ethereum price prediction: Buterin bets on store of value as Bitmine adds 9,587 ETH
Analysis: Vitalik Buterin wants Ether valued as a store of value rather than a fee-burning token, and Bitmine now holds 4.97 percent of all ETH. Why the price still sits below the 200-day moving average at $2,154 and which levels matter until Friday's expiry.

November 10, 2026 5:21 AM

Bitcoin price at $74,600: what matters in the US consumer price data
Analysis: bitcoin starts Tuesday at around $74,600 after the 200-day average held on Monday. US consumer prices for October are due at 2:30 pm CET, without an official annual rate because of the 2025 shutdown, and the market is pricing in a December rate hike.
November 7, 2026 7:12 PM

Ethereum price holds €2,000 as ether ETFs log a sixth straight week of outflows
Analysis: Ether is hovering around €2,000 on Saturday evening after the US spot ETFs lost money for a sixth consecutive week. Which figures are confirmed, why the euro level matters more than the dollar price for investors in Germany, and which steps you can check now.

November 7, 2026 9:46 AM

Crypto Crash: Why Bitcoin, Ethereum, XRP and Solana Fell This Week and What Comes Next
Bitcoin lost its post-election gains, ETH hit a 10-week low and XRP led the losses. The four drivers behind this week's crypto crash and the levels to watch.
November 6, 2026 3:16 PM

Ethereum Price After the Jobs Report: 165,000 New US Jobs Sharpen Fears of a Fed Hike
Analysis: US payrolls grew by 165,000 in October, more than twice the forecast, and futures now put the odds of a Fed rate hike in December at around 80 percent. Ether sits at $2,236, its lowest level since August, as the 200-day line at $2,157 draws closer.
November 4, 2026 7:23 PM

Ether ETF buyers sit at an average of $3,200: the Ethereum price levels that count until then
Analysis: According to an estimate by Bloomberg Intelligence, buyers of the US Ether ETFs paid just under $3,200 on average, while Ether trades at $2,425 after the election jump. We recalculate the funds' paper loss, put the outflows in context and show which levels count on the way to the cost basis.
November 3, 2026 8:59 AM

Ethereum Price Below $2,300: Is $2,000 Next or Is This the Bottom?
Ethereum price slips toward $2,250 as $3 billion leaves DeFi. Whales are buying the dip. Does ETH hold $2,200 or test $2,000 next?
November 3, 2026 7:20 AM

Ethereum price prediction: BlackRock fund sheds 580,145 ETH, and BitMine absorbs only a fraction
Analysis: BlackRock's ETHA fund has shed 580,145 ETH in a month, and US ether ETFs have been losing money for six trading days. We work out how much of it is genuine outflow, why BitMine is not offsetting it and which levels the price now hinges on.
October 28, 2026 9:27 PM

Ethereum staking at 2.63 percent: what investors need to know
Analysis: the Fed left the policy rate at 3.75 to 4.00 percent on Wednesday evening, and two members even wanted a hike. For Ether this decision counts for more than it does for Bitcoin, because the staking yield of 2.63 percent competes directly against the money-market rate.
October 26, 2026 9:32 PM

Ethereum price prediction: the 200-day line is the level that decides
Analysis: Ethereum trades at $2,308 on Monday evening and falls for the fourth day in a row, below the 200-day average of $2,329 for the first time since August 20. Price, averages and the Fed date on Wednesday are documented; the editorial team's assessment stands separately in the text.
October 26, 2026 7:36 AM

Bitcoin Price Crash: Top 3 Reasons Why BTC Price Dropped Below $80,000
Bitcoin price crashed below $80,000 over the weekend. Oil, ETF outflows and a wave of liquidations explain the move, and the Fed decides this week.
October 24, 2026 10:24 PM

Ethereum price prediction: the premium for leveraged buys falls to zero, and $2,311 is the level that decides
Analysis: it is documented that the funding rate for leveraged Ethereum buys on OKX has fallen to zero for the period up to midnight, the first time since October 13, and that Ether is quoted at $2,300 on Saturday evening. Our assessment follows further down: cheap leverage turns no price, and the 100-day line at $2,311 decides the direction.
October 21, 2026 7:19 AM

ETF inflows of $526.7 million meet a Bitcoin price of $82,708: the levels that decide before the Fed meeting
Bitcoin costs $82,708 on Wednesday morning after $526.7 million flowed into the US spot ETFs on Monday. October still leaves those funds in the red, and two moving averages frame the market until the Fed meets on October 28.
October 8, 2026 4:38 AM

Crypto Market Slides: Bitcoin Loses 4.2 Percent and $651 Million of Long Bets Are Liquidated
Bitcoin has lost 4.2 percent since Tuesday afternoon, and ether and XRP more still. Three reasons can be documented: outflows from the US ETFs, $651 million of forcibly closed long bets and Fed minutes holding out the prospect of another rate rise. A crash it is not, and what to check before buying more is set out here.
October 3, 2026 1:22 PM

Ethereum Price Prediction: Ether ETFs Lose $118 Million in Three Days, Bitcoin Funds Gain
Roughly $118 million has left the US spot Ether ETFs over three consecutive trading days, while the Bitcoin funds are gathering cash again. ETH closes at its lowest level since September 20. These are the levels that now count.
September 26, 2026 1:02 PM

Ethereum Price Prediction: ETH Defends Key Support, Is $3,000 Next?
Ethereum is consolidating near $2,700 after a rejection at $2,800. Our Ethereum price prediction looks at what ETH needs for a run at $3,000.
September 22, 2026 7:20 PM

ETH Price Prediction: What to Check at the $2,800 Mark Now
Ether stands at $2,735.96 on September 22, 2026, right below the zone at which it has failed repeatedly. Instead of a target number, you get four checks that count before your next order: holding period, buying route, the staking line and the distance to liquidation.
September 18, 2026 11:39 AM

Ethereum Price Prediction: Why ETH Is Closing In on $3,000
Ethereum is coiling between $2,400 and $2,600 with a rising 200 EMA underneath. Here is what the ETH chart says about $3,000.
September 11, 2026 9:50 AM

XRP Price Crashes 6% in a Week: Buying Opportunity?
XRP price fell 6.45% this week to $1.35 and is now sitting on its 200 EMA. Here is what the chart says before the Senate vote on September 15.
September 9, 2026 10:21 AM

Bitcoin Price Frozen Near $79,000 as Oil and War Risk Rewrite the Macro Playbook
Bitcoin price is consolidating near $79,000 while crude oil surges, Hormuz tensions escalate and a Fed rate hike moves into play. Here is what matters.
September 6, 2026 11:19 AM

Bitcoin Price Today: BTC Holds Firm Before The Biggest Week Of The Month
Bitcoin sits near $80,000 after a jobs report killed a four-month high. CPI, the Fed and a Senate vote all land in the next ten days.
September 4, 2026 11:32 AM

Ethereum Price Holds Above $2,500: One Level Is Still Blocking The Way
Ethereum trades at $2,517 after another rejection at the same ceiling. The jobs report lands in hours and decides which way this range breaks.
September 3, 2026 4:04 PM

Bitcoin Price Smashes Back Through $80,000: Here Is What Just Set It Off
Bitcoin price surged to $80,477 in a matter of hours after a dovish Fed signal crushed rate hike bets. Here is the chart and the real driver.
August 30, 2026 10:56 AM

Ethereum Price Prediction: Can ETH Blast Toward $2,750 Next?
Ethereum price prediction after a 30% August rally: ETH sits at $2,453 with RSI cooling. Here are the bullish and bearish ETH price targets.

More from CryptoTicker