
Bitcoin Price Smashes Back Through $80,000: Here Is What Just Set It Off
Bitcoin price surged to $80,477 in a matter of hours after a dovish Fed signal crushed rate hike bets. Here is the chart and the real driver.





Which topics should we dive deeper into?
Select what genuinely interests you. Your picks feed directly into our editorial planning.
Crypto news that's actually worth your time.
Weekly. 60 seconds. Carefully curated by our editors: no hype, no promo flood, no spam.
Bitcoin just went vertical. After spending the entire session glued to the $77,200 to $78,000 zone, $BTC ripped through $80,000 and printed an intraday high of $80,477, trading at $80,301 at the time of writing. That is a gain of roughly $2,400, or 3.07%, against a previous close of $77,302.
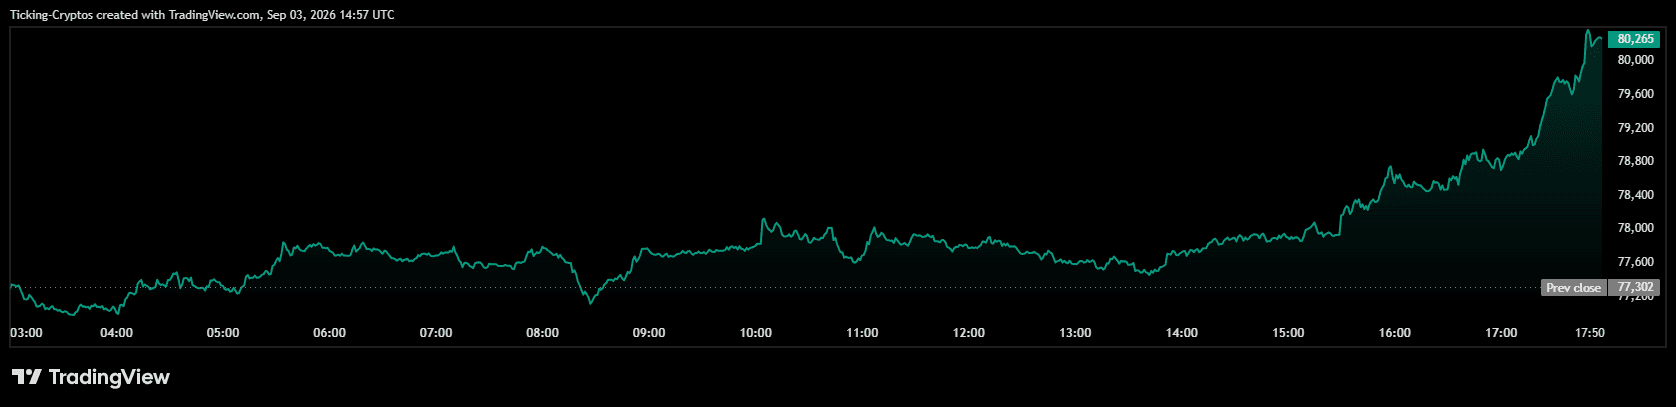
The move was not a slow grind. It was a near straight line from lunchtime onwards, and it came with a very specific catalyst attached.
Why Did the Bitcoin Price Jump Above $80,000 Today?
The trigger came from Washington, not from crypto.
Federal Reserve Governor Christopher Waller told a Reuters event on Thursday that he is inclined to support leaving interest rates unchanged at the September 15 to 16 meeting, provided August inflation data confirms that price pressures are still cooling. Waller pointed out that the three-month rate on the Fed's preferred inflation gauge has fallen from 4.76% in February to 3.05% now, calling the speed of that decline encouraging. His line to reporters, "Give disinflation a chance. We can wait one meeting", did most of the damage to the hawks.
Here is why that matters so much. Markets had been pricing a Fed rate hike in September, not a cut. After Waller spoke, the implied odds of a September hike collapsed to around 54.6%, down roughly 12 percentage points on the day, according to CME FedWatch.
The reaction across assets was immediate and consistent:
- The two year Treasury yield, which had pushed above 4.40% this week for the first time since January 2025, dropped as much as seven basis points to 4.30%.
- The dollar fell as much as 0.5% and lost ground against every one of its G10 peers.
- The dollar slid more than 2% against the yen to below 156, its weakest since late February, while gold added 2.3% and US equities opened strongly.
Lower yields, a weaker dollar and less pressure from the Fed is close to the ideal cocktail for Bitcoin. BTC simply did what a high beta liquidity asset does.
 Buying Bitcoin: Crypto Exchanges Compared
What Does the BTC Chart Say About This Breakout?
On the 3 hour Bitstamp chart, $Bitcoin had been trapped in a tight box since late August, roughly $76,000 on the low side and just under $82,000 on the high side. Today's candle blew straight through the middle of it.
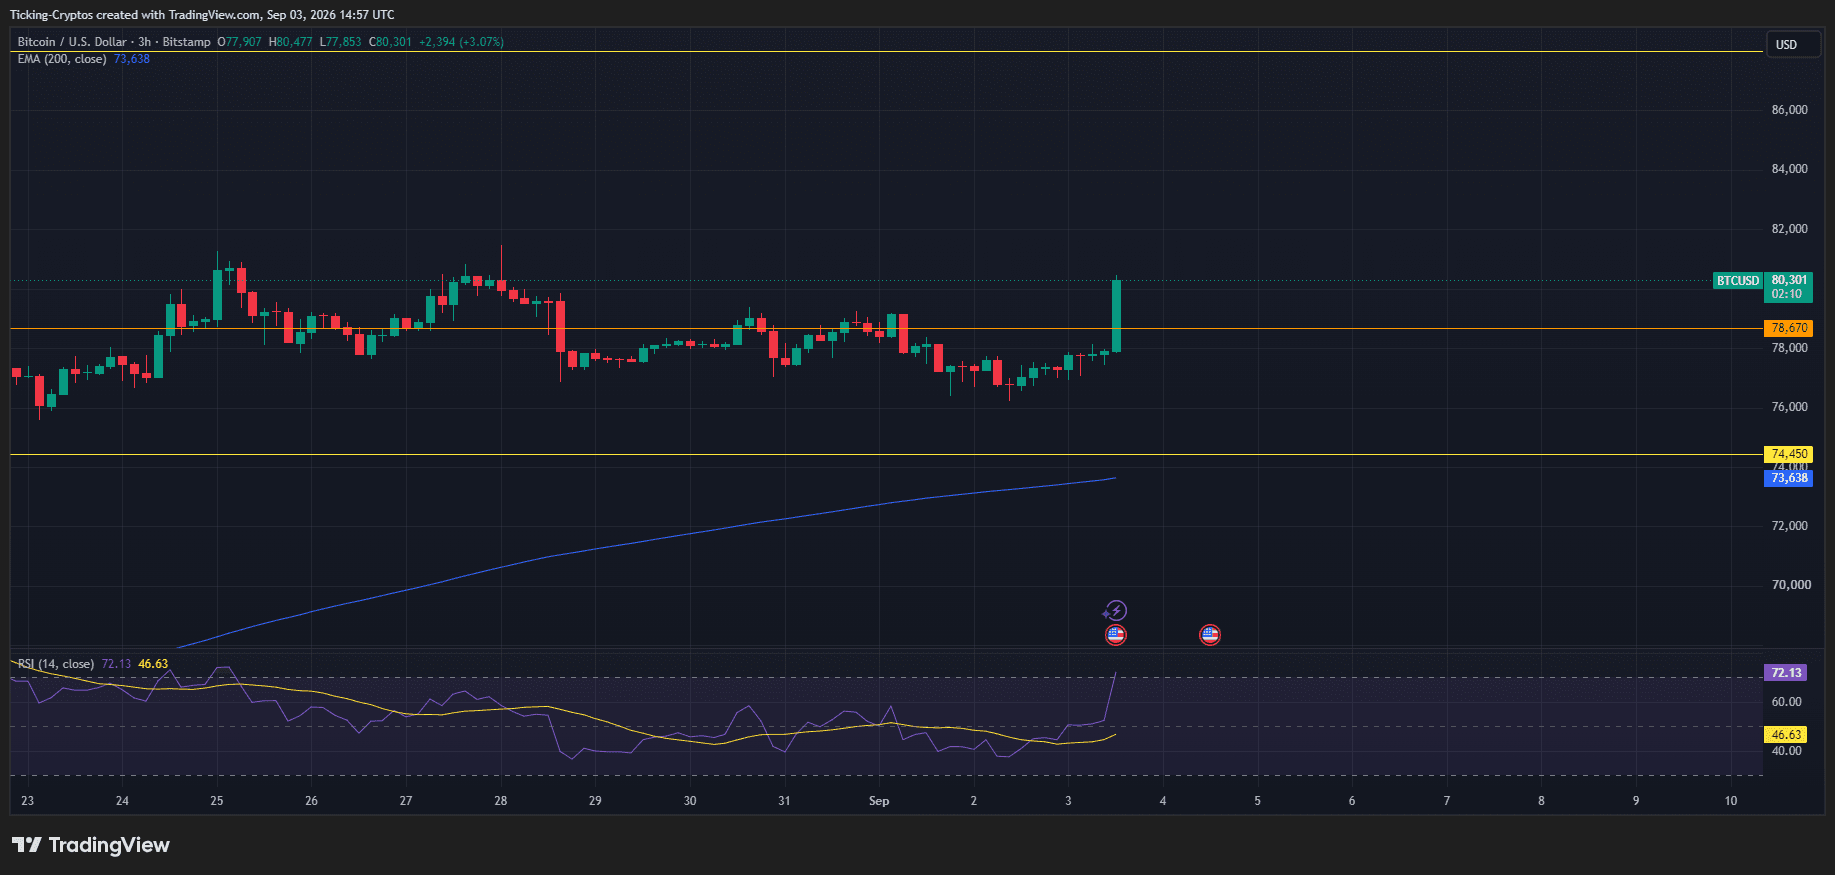
The level worth watching is $78,670. That has been the pivot the market kept rejecting off, and Bitcoin cleared it with a single expansion candle rather than the usual slow chop. Old resistance now becomes the first line of defence. If BTC holds above it on a close, the breakout has structural backing rather than just headline momentum.
Zooming out, the trend was never actually broken. The 200 EMA sits at $73,638 and is still sloping upward, which means price is trading around 9% above its longer term mean. That is healthy, but it is also the kind of stretch that invites a retest.
Is the Bitcoin RSI Flashing a Warning?
Yes, and it is worth taking seriously.
The RSI(14) has spiked to 72.13 from the mid 40s, while its own moving average is still sitting down at 46.63. That gap is enormous. It tells you this move happened faster than the underlying trend can justify, which is exactly what you expect from a headline driven repricing plus forced short covering.
Overbought does not mean "sell". It means the easy part is done. Historically, when Bitcoin's RSI detaches this violently from its signal line, one of two things follows: a sideways cool off that lets the indicator reset while price holds, or a sharp wick back into the breakout zone that punishes late longs.

 Chart Analysis Tools: The Best Platforms Compared
Which Levels Matter Next for the Bitcoin Price?
Upside targets:
- $80,477, today's high, is the immediate hurdle. A clean break opens the door higher.
- $81,300 to $81,800 is the late August supply shelf, where Bitcoin was rejected twice. That is the real test.
- Above $82,000, the chart has very little in the way until the mid $80,000s.
Downside supports:
- $78,670, the reclaimed pivot. Losing this quickly would label today a fakeout.
- $76,000 to $77,000, the base of the multi week range.
- $74,450, the last defined shelf before the trend line.
- $73,638, the 200 EMA and the level where the medium term bullish structure genuinely comes into question.
What Could Derail the Bitcoin Rally From Here?
Three things, and they all land soon.
- The August jobs report on Friday. Waller explicitly framed his position as data dependent. A hot labour print puts the hike back on the table and this entire move unwinds fast.
- August CPI next week. Waller warned that policy is only slightly restrictive right now and that it may not take much of an inflation acceleration to push him towards supporting tighter policy. The dovish read has a very short leash.
- Oil and the Middle East. Brent has been trading above $96 a barrel following renewed US strikes on Iranian targets. Energy driven inflation is the one thing that could force the Fed's hand regardless of what the labour market does.
Frequently asked questions about the Bitcoin price after Waller's rate signal
More on Bitcoin: All Bitcoin news at a glance
Related articles
- Bitcoin Surges Past $60K: The Start of a Major Rally or Just Another Bull Trap?
- How Important Is The $70k Level For BTC Price Bullish Momentum?
- Bitcoin Price Prediction: How Will BTC Price Move Following Gold's Surge?
- Crypto Market Up: Bitcoin Breaches $71K, Altcoins Follow Suit, Eyes on New Highs
- Bitcoin News Today: Why BTC Dropped Below $70,000 After a Massive Rally
Which topics should we dive deeper into?
Select what genuinely interests you. Your picks feed directly into our editorial planning.
Crypto news that's actually worth your time.
Weekly. 60 seconds. Carefully curated by our editors: no hype, no promo flood, no spam.

October 21, 2025 4:17 PM

Bitcoin Surges Past $112,000 as the Fed Opens Doors to Crypto: What’s Next?
Bitcoin jumps above $112,000 after the U.S. Federal Reserve hinted at granting crypto firms access to its payment network. Here’s what this means for BTC and the broader market.
August 22, 2024 9:00 PM

MAJOR Bitcoin News: Bitcoin Price SURGE Expected At This Level
Bitcoin and Ethereum are at critical junctures, with key resistance levels in sight. Are the markets poised for a breakout, or will bearish pressures prevail? Explore the latest analysis and insights.
April 22, 2026 9:11 AM
Bitcoin Price Hits $78,000 as Ceasefire Extension Ignites Bullish Momentum
Bitcoin breaches $78,000 following the US-Iran ceasefire extension and a $2.5 billion MSTR purchase. Here is the weekly BTC chart for key 2026 price targets.
November 21, 2024 11:50 AM

Bitcoin Price Is 2% Away From $100,000: Is Today THE DAY?
With almost 2% away from breaking the Bitcoin $100,000 price mark, a historic milestone for the crypto market. Could Today be The Day?
September 4, 2024 8:10 PM

Bitcoin Price Volatility Is Moving BTC Price Down, But For How Long?
As Bitcoin price faces market turbulence, the factors driving its recent volatility, from stock market impacts to key technical indicators signaling potential price shifts are highly important...
April 14, 2026 9:02 PM

Why Is Crypto Up Today? Cooling Inflation and Fed Rate Cut Bets Spark Market Rally
Crypto is rising as inflation cools and rate cut bets grow. Here’s why Bitcoin and altcoins are rallying today.
January 14, 2026 3:42 PM

Did Bitcoin Reach $100K in January 2026? What Happened After the Rally to $97,000
On 14 January 2026 Bitcoin climbed above $97,000 and $100,000 looked close. It never got there: BTC fell to about $58,600 by July and trades near $84,200 today.
September 18, 2026 10:31 AM

3 Reasons Crypto Is Still Holding Strong After the Fed Rate Hike
The Fed hiked, the CLARITY Act died, and crypto barely moved. Here are three reasons the market is consolidating rather than breaking down.
August 12, 2025 2:05 PM
Crypto Market Outlook After US Inflation Data: Bitcoin Eyes $125K as CPI Hits 2.7%
US CPI lands at 2.7%, boosting hopes for September rate cuts. Bitcoin eyes $125K while altcoins prepare for possible rallies.
May 17, 2026 5:14 PM
Bitcoin Price Prediction: Fed Liquidity Turns Bullish as BTC Holds Near $78K
Bitcoin holds near $78K as Fed liquidity signals improve. Could rising liquidity support the next BTC recovery?
June 13, 2024 4:13 PM

Crypto Market DOWN As Bitcoin Price Slides, Ethereum Price Consolidates, And XRP Price Nears New Lows
The recent Federal Reserve decisions and market dynamics impact Bitcoin, Ethereum, and XRP. How to manage and what to monitor amid market volatility and uncertainty?
September 9, 2026 10:21 AM
Bitcoin Price Frozen Near $79,000 as Oil and War Risk Rewrite the Macro Playbook
Bitcoin price is consolidating near $79,000 while crude oil surges, Hormuz tensions escalate and a Fed rate hike moves into play. Here is what matters.
July 8, 2024 7:51 AM

Crypto Market Crash News As BTC Price Crash Back To 56K
With the crypto market crash, and Bitcoin price drop to below 56k with recent dormant BTC whales activity, what comes next: a correction or further crash soon?
July 1, 2024 9:20 AM

Bitcoin News Today: Why Is Bitcoin Price Up Starting July?
Starting July, recent market movements, political debates, and court rulings are shaping the future of Bitcoin and the broader crypto market. Here are the latest insights and analysis...
April 15, 2026 8:34 PM

Crypto Pumping on Fed Drama — But This Rally Could Turn Fast
Crypto rises as Trump pressures the Fed and rate cuts loom. But this rally may be fragile amid political risks and market instability.
February 20, 2025 2:00 PM

Bitcoin Price Prediction: Is BTC Ready to Break $100K Again?
Bitcoin's price is showing signs of a strong rebound, hinting at a potential breakout past $100,000. With the entire crypto market inching higher, traders are eyeing key resistance levels for the next big move.
March 27, 2026 9:48 PM

$900 Billion Surge — But Markets May Be Pricing a Peace That Doesn’t Exist
$900B added to US stocks as Bitcoin surges and oil crashes after Trump’s Iran statement—but is the market pricing a false peace?
July 27, 2024 2:34 PM

Why Is The Crypto Market Up TODAY?
With the Bitcoin 2024 Conference taking place now in Nashville, the crypto market is showing bullish signals, intriguing traders around the future of Bitcoin and Altcoins.

May 12, 2026 3:51 PM
Bitcoin Holds $80,000 as XRP Outpaces Market Amid ETF Surge
Bitcoin maintains its $80,000 support while XRP breaks key resistance. Discover how institutional ETF inflows and market shifts are driving crypto prices today.
October 27, 2025 7:45 PM

$2.7 Trillion Wiped from Gold — Is Liquidity About to Flood into Bitcoin?
Over $2.7 trillion vanished from gold’s market cap in just a week. As investors rotate risk, Bitcoin could be the next major liquidity magnet.
July 25, 2026 11:27 AM
Crypto Price Today: Market Slides Again as Bitcoin Fails at $67,000
Bitcoin slipped back under $64,000 after tapping $66,990. Oil, ETF outflows and Fed nerves are dragging the whole crypto market lower.
April 15, 2026 12:00 PM

Bitcoin Price Corrects After $76,000 High: Is This a Consolidation or a Crash?
Bitcoin price faces a healthy correction after hitting $76,000. Learn how to trade consolidation phases and use support and resistance levels effectively.
April 8, 2026 8:53 AM
Bitcoin Price Hits $71,000 as Trump Announces Two-Week Ceasefire
Bitcoin price surged past $71,000 following President Trump’s announcement of a two-week ceasefire with Iran, sparking a major relief rally across global markets.
March 8, 2026 7:33 PM

Bitcoin Price Prediction: Can BTC Recover After the Drop to $66K?
Bitcoin trades near $66K after a sharp correction. Is BTC preparing for a recovery or could another drop happen first?
December 3, 2025 8:44 AM

Crypto Market Turns Green Overnight: What’s Happening?
Bitcoin rebounds sharply as markets turn green overnight. Liquidity sweeps, macro shifts, and a gold-to-BTC rotation fuel a powerful recovery.
More from CryptoTicker