
Chainlink price crashes below $9 to its lowest close since August
Chainlink fell by just over 10 percent overnight into November 15, 2026, to $8.85, its weakest close since August. This article sets out the levels below $9, the state of the futures market and how leverage works on LINK.


Which topics should we dive deeper into?
Select what genuinely interests you. Your picks feed directly into our editorial planning.
Crypto news that's actually worth your time.
Weekly. 60 seconds. Carefully curated by our editors: no hype, no promo flood, no spam.
Chainlink fell below $9 overnight into Sunday, November 15, 2026. According to CoinGecko, LINK traded at $8.85, or €8.03, down 10.3 percent from 24 hours earlier. Based on what was known at that point, there was no Chainlink-specific trigger: the coin fell with the whole crypto market, but considerably harder than bitcoin. Anyone following the Chainlink price prediction now sees LINK as low as it last was in August.
This article puts the day's numbers in context, shows the price levels below $9 and explains what liquidations and leverage in the futures market had to do with the slide. The live price is on the Chainlink price page.
Chainlink crash on November 14: the day's numbers
CoinGecko put the 24-hour high at $9.84 and the low at $8.60, a gap of just over 12 percent. On Kraken, LINK closed Saturday at $8.88, after $9.85 on Friday. The intraday low there was $8.58. Market capitalisation dropped to about $6.8 billion, putting Chainlink 17th in CoinGecko's ranking. Over seven days the loss is 18.2 percent, over 30 days 28.9 percent.
Volume rose sharply. On Kraken, around 850,000 LINK changed hands against the US dollar on November 14. The average over the previous seven days was about 302,000 LINK a day. Saturday therefore brought almost three times a normal day's turnover, and on a weekend, when trading is usually quieter. High volume on falling prices shows that real selling took place, rather than the price simply slipping in a thin market.
All-time high, start of the year, autumn peak: how far Chainlink is from each in percent
Chainlink's all-time high, according to CoinGecko, is $52.70, set on May 9, 2021; the price is now 83.2 percent below it. Three other reference points are closer to the present, all based on Kraken daily closes. On January 1, 2026, LINK closed at $12.59, so the coin has lost 29.5 percent since the start of the year. The autumn peak was the close of September 28, 2026, at $15.44. From there it has fallen 42.5 percent. Exactly one year ago, on November 15, 2025, LINK stood at $14.12.
Why is Chainlink falling? The market slides, altcoins slide further
The drop in LINK is part of a broad sell-off. Over the same 24 hours, bitcoin lost 6.9 percent according to CoinGecko and traded at around $63,600, while ether fell 9.4 percent to about $1,750. The crypto crash typically hits altcoins such as Chainlink harder, because their markets are smaller and investors under stress cut their riskier positions first. A detailed explanation of why bitcoin is falling is in our background piece.
Industry media agree on three pressures. The first is rate expectations: according to CME FedWatch, the futures market prices an 88.5 percent probability that the US Federal Reserve will raise its key rate by a quarter point in December, as Bitcoin.com reports. Higher rates make borrowing more expensive and speculative assets less attractive. The second is fund outflows: according to Farside Investors data, investors pulled around $1.07 billion out of US spot bitcoin ETFs between November 9 and 13, and $398.9 million out of the ether funds, Coinpaper reports. The third is liquidity: the same outlet cites Coinbase on an $11.5 billion fall in stablecoin supply within 30 days.
Sentiment is reflected in the Fear and Greed Index from alternative.me, a gauge running from 0 for extreme fear to 100 for extreme greed. It stood at 10 points on November 15, after 13 the day before and 20 on Friday. We summarise each day's reasons under why is crypto down.
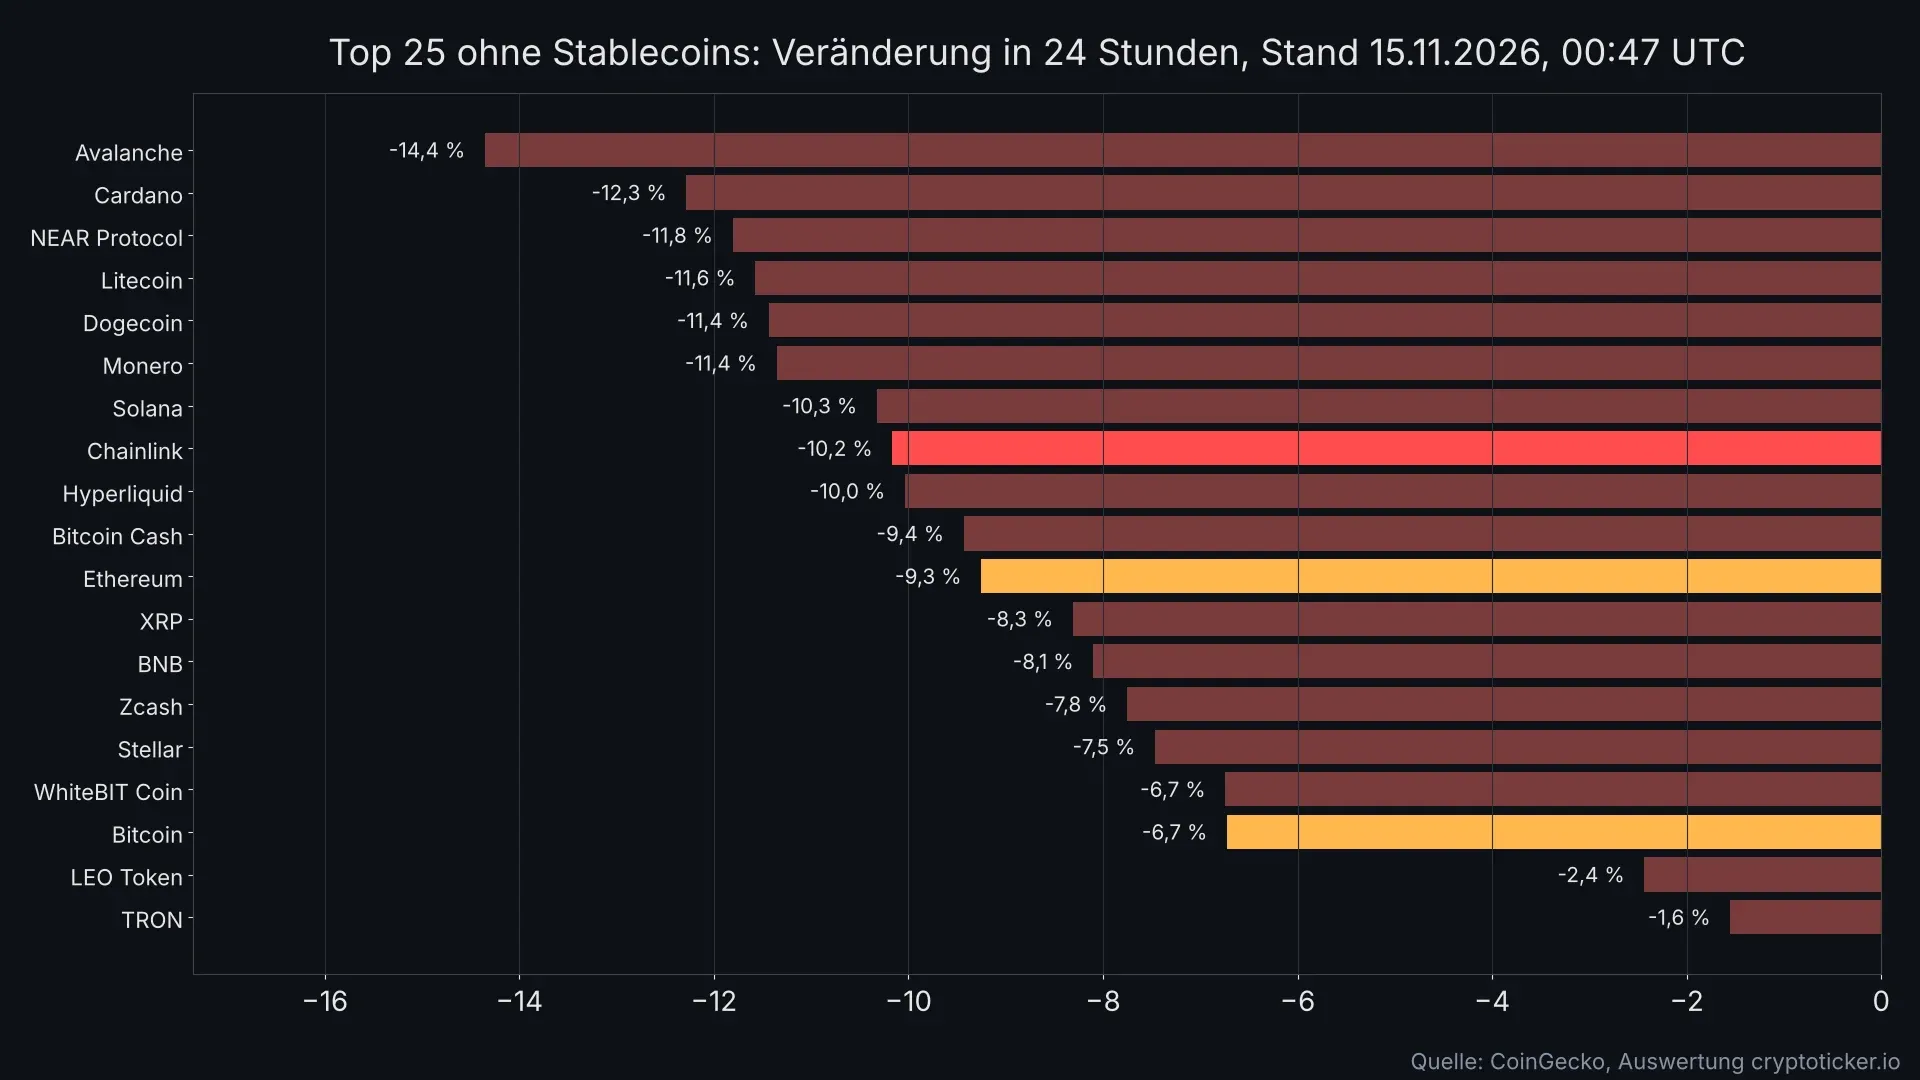
Chainlink among the top 25: where LINK ranks among the losers
The chart shows the 24-hour change in the 25 largest cryptocurrencies excluding stablecoins, as of the night into November 15. Almost every major coin lost double digits or close to it. Avalanche was hit hardest with 14.4 percent, followed by Cardano, NEAR Protocol and Litecoin with just under 12 percent each. At 10.2 percent, Chainlink is level with Solana and Hyperliquid. Only TRON and the exchange token LEO held their losses below 3 percent.
For LINK holders, the gap to bitcoin is the more important figure. Over 24 hours Chainlink fell about half as much again as the largest cryptocurrency, and the ratio over seven days is similar. The pattern is typical of downturns: crypto investors regard bitcoin as a relatively safe haven, and in times of stress capital flows out of the smaller assets first.
On the morning of November 14, cryptoticker.io reported on the proposal that Chainlink should throttle Aave loans. LINK was already at its lowest level since August then and has lost another dollar since.
 Find an exchange for your LINK
Liquidations in the crypto crash: more than $1 billion in a single day
A liquidation is the forced closure of a leveraged position by the exchange once the posted collateral no longer covers the losses. In a fast decline, these closures feed on each other: every long position that is sold off by force pushes the price lower and triggers the next one.
That is exactly what happened on November 14. According to Bitcoin.com, bitcoin's fall to an intraday low of $65,020 led to liquidations of around $1 billion across the crypto market within 24 hours, $382 million of them in bitcoin. Later in the evening bitcoin dropped below $64,000. According to TokenPost, positions worth more than $691 million were liquidated within an hour, $671 million of them longs and only $19.5 million shorts. Just over 97 percent of the forced closures therefore hit investors who had bet on rising prices.
Open interest and the long/short ratio for Chainlink on OKX
None of the sources cited breaks out how much of this fell on Chainlink. OKX's public market data does show how the LINK futures market has changed, however. Open interest, the value of all outstanding futures contracts, fell there between November 14 and 15, each measured at the start of the day, from $26.7 million to $23.4 million, a drop of 12.5 percent. Part of that is purely arithmetical, because the dollar value of the contracts falls with the price. The rest consists of closed positions, whether voluntary or liquidated.
The ratio of accounts holding long and short positions stands out. On OKX, there were 2.56 long accounts for every short account at the start of November 14. Twenty-four hours and a price loss of just over 10 percent later, the figure was still 2.49. Around 71 percent of accounts are therefore still betting on a higher LINK price. Most traders have not switched sides despite the slump. If the price keeps falling, a large number of long positions is at risk. cryptoticker.io compiled this analysis itself on November 15, 2026, based on OKX's hourly figures over 48 hours.
Leverage on LINK: how longs, shorts and the liquidation price work
Leverage multiplies the effect of every price move on the capital you put in, in both directions. With 10x leverage, a 10 percent price change moves the position by 100 percent. If LINK rises from $8.85 to $9.74, a 10x long position doubles its capital. If LINK falls from $8.85 to $7.97, that capital is gone entirely. In practice the exchange closes the position slightly earlier, because it keeps a safety margin for fees and slippage.
At 100x, a move of about 1 percent is enough. A long position opened at $8.85 would be wiped out at roughly $8.76. Chainlink's 24-hour high and low were just over 12 percent apart. On paper, a long position with leverage of around 8x or more would not have survived the trip from the high to the low.
A short position works the other way round: it gains when the price falls and is liquidated when it rises. Anyone going short after a drop of just over 10 percent is betting that the decline will continue. A sharp rebound, which often follows heavy sell-offs, can wipe out a highly leveraged short just as quickly.
Stop-loss and position size when trading Chainlink
A stop-loss is an order that closes a position automatically once a set price is reached. It caps the loss before liquidation kicks in. Leveraged traders also size their positions so that a loss down to the stop-loss costs only a small share of the account; 1 to 2 percent is a figure often cited. In fast markets, however, a stop-loss can be filled below the intended price, because there are no buyers between two prices.
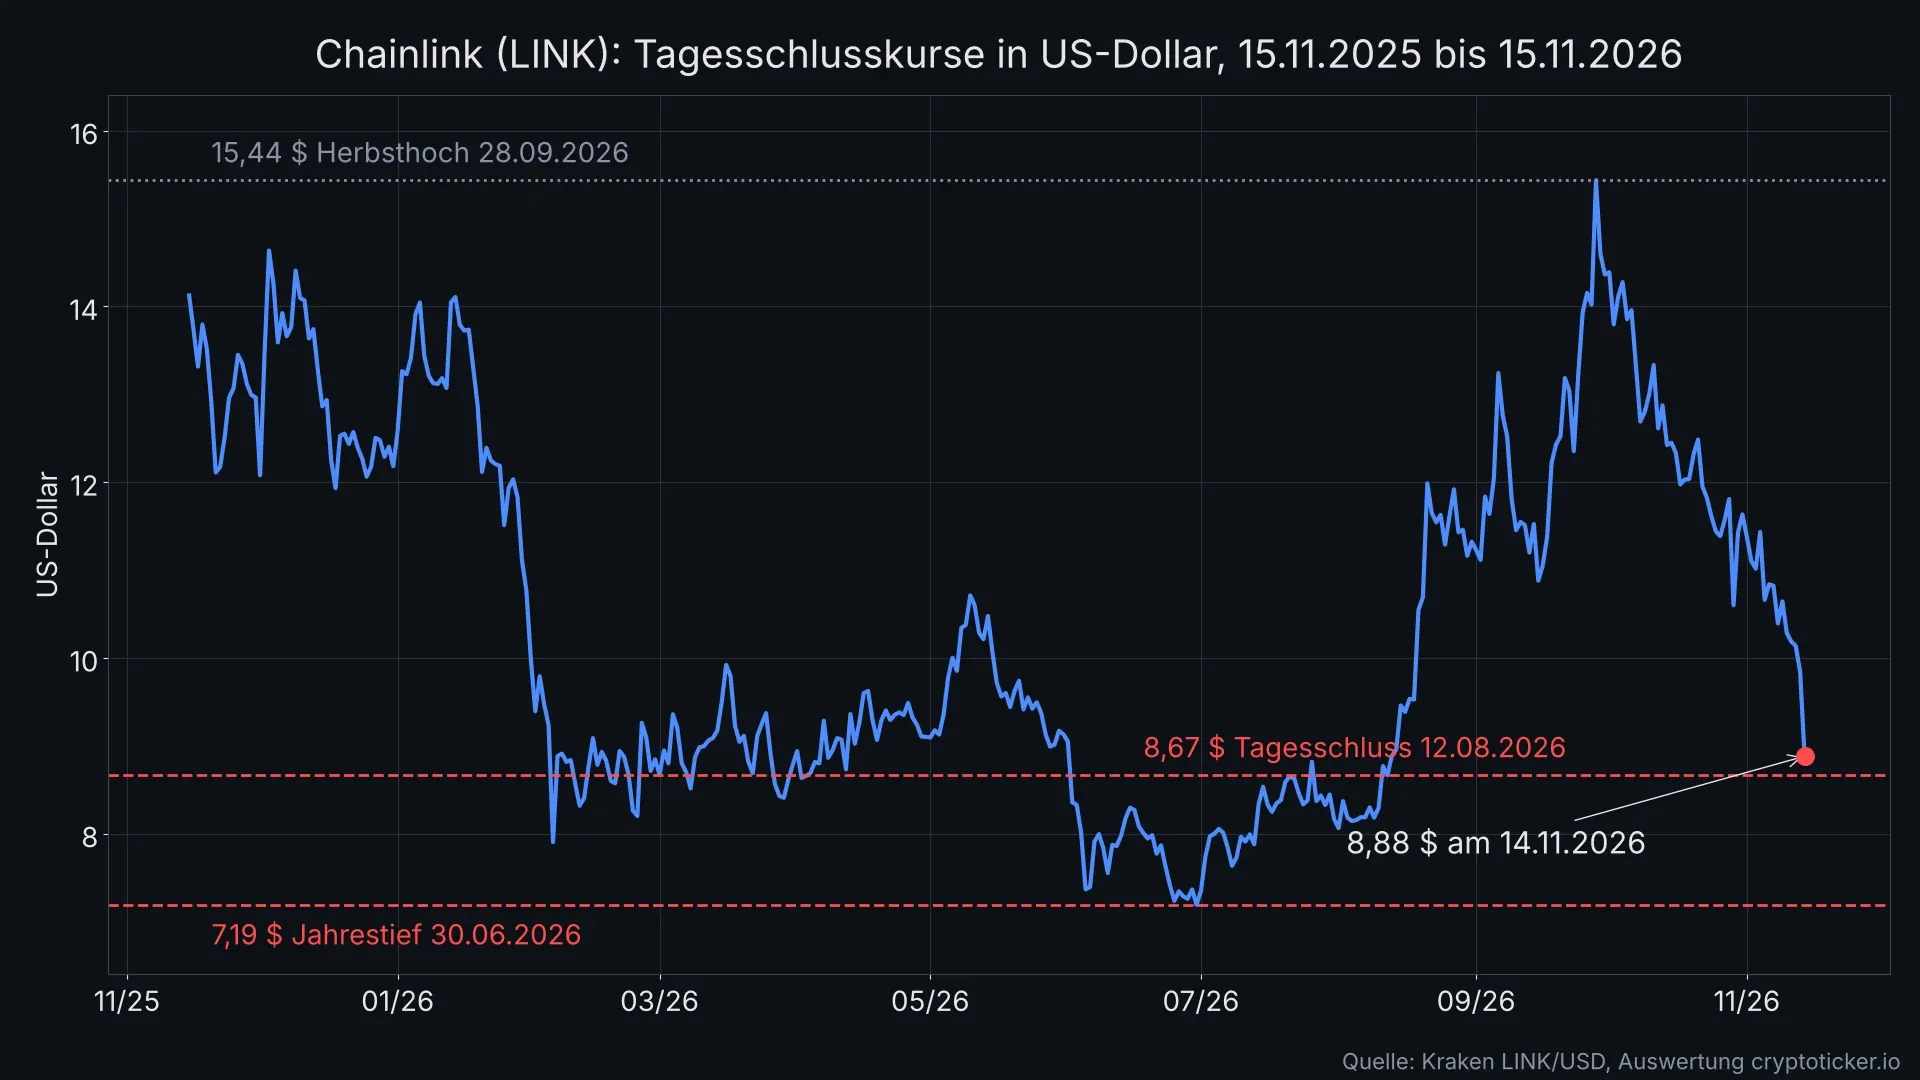
Will Chainlink fall below $8? The levels from the price history
The chart shows LINK's daily closes on Kraken over the past twelve months. Three levels emerge from it. The first is the close of August 12, 2026, at $8.67, the last daily close below today's level. The second is the area around $8, where LINK closed several times between mid-June and mid-August. The third is the low for the year: on June 30, 2026, Chainlink closed at $7.19, and the lowest intraday level of the year was $7.00 on June 6.
Over the summer, LINK swung for weeks between just above $7 and just below $9. Only in September did the price break out to the upside, reaching more than $15 by the end of the month. That rise has now been given back in full. Whether the summer range holds again cannot be predicted. It does, however, show where buyers were willing to step in over the summer.
For context, it helps to look at bitcoin, which sets the pace in the market. How far the largest coin fell in earlier cycles is shown in our analysis how low can bitcoin go. Why the bitcoin price is currently trading below a long-term average is explained in the piece on the 200-week moving average.
 Compare brokers for going long or short on LINK
Trading Chainlink in the EU: MiCA exchanges, futures and CFDs
If you want to buy or sell LINK, or bet on a price move, there are three routes. The simplest is to buy through a crypto exchange or broker licensed under the EU's crypto regulation, MiCA. MiCA stands for Markets in Crypto-Assets and has governed across the EU since the end of 2024 which providers may trade and hold crypto assets for clients. Kraken and OKX, for example, list LINK. Which platform charges which fees is shown in our comparison of regulated crypto exchanges.
The second route is futures and perpetuals, futures contracts without an expiry date that let you trade long and short with leverage. They are offered by centralised exchanges and by the decentralised venues listed in our comparison of perp DEXs. The third route is CFDs, contracts for difference on the price, such as those that CFD brokers like XTB offer on cryptocurrencies. A CFD only tracks the price; you do not own any coins.
CFDs are complex instruments and come with a high risk of losing money rapidly due to leverage. A high percentage of retail investor accounts lose money when trading CFDs. You should consider whether you understand how CFDs work and whether you can afford to take the high risk of losing your money.
Sell or hold? Two scenarios for LINK after the crash
This article cannot and will not make a recommendation. It does help, though, to frame the situation in conditions that can be checked.
In the first scenario, the overall market calms down. Bitcoin stabilises, the wave of liquidations runs its course, and LINK holds the $8.67 level on a daily closing basis. The summer range would then again be a zone where buyers step in, and a recovery towards $9.85, where the price still closed on Friday, would be possible.
In the second scenario, the sell-off continues, driven by further ETF outflows or sharper rate expectations ahead of the Fed meeting in December. If LINK closes below $8.67, the next level from the price history is the area around $8, with the low for the year of $7.19 below it. How investors in the bitcoin market deal with this question is described in our piece should you buy or sell bitcoin. What earlier downturns show is covered in the article on the bitcoin bear market. The conditions under which analysts expect a recovery are set out in the piece on when bitcoin will rise again.
Whatever the scenario, anyone holding LINK with leverage should check their own liquidation price against the levels above. Those holding without leverage lose money if prices keep falling, but are not forced out of the position.
Weekend crypto crash: what the day means for the rest of the market
Chainlink is not alone on this day. Solana lost about 10 percent according to CoinGecko, XRP just over 8 percent and Dogecoin just over 11 percent. An overview of the whole day is in our crypto news on the bitcoin slide. We keep updating the latest on the crypto crash today there, and our piece on the Avalanche crash puts the same night's Avalanche slump in context.
Chainlink price: only below $7.19 does the low for the year break
- Note the levels. The closing level of $8.67 decides the next move; below it lie the summer range around $8 and the low for the year of $7.19. Providers that list LINK are in our comparison of the best crypto exchanges.
- Recalculate your leverage. Leveraged traders should work out their own liquidation price and set a stop-loss. Platforms for futures and CFDs are listed in our comparison of crypto brokers.
- Choose a trading venue. For buying and selling without leverage, MiCA-licensed providers are a suitable choice. Which ones they are is shown in the overview of MiCA-regulated exchanges.
(As of November 15, 2026. This article is not investment advice. Prices and fee structures change; check the terms with the provider before you buy.)
Frequently asked questions about Chainlink
Partner links: some links on this page are partner links. If you become a customer through one of them, we may earn a commission at no extra cost to you. Selection, ratings and ranking are decided independently by our editorial team. Ethics and Independence · Ownership and Funding
Transparency note: This article was produced with the assistance of artificial intelligence and reviewed by our editorial team before publication. All figures and claims were checked against the primary sources linked in the text. The feature image was generated with AI.
For later? Save this article and find it again in your profile.
Related articles
- Avalanche crashes to $7.08: the level that decides is August's $6.78 close
- Weekend crypto crash: leverage and crypto loans with bitcoin below $66,000
- Crypto news: bitcoin falls to $63,500, ether down 9% as Fed hike bets soar
- Solana drops below $72 and is back at its late-June level
- BNB falls below $600, down 23 percent since the Binance hack
Which topics should we dive deeper into?
Select what genuinely interests you. Your picks feed directly into our editorial planning.
Crypto news that's actually worth your time.
Weekly. 60 seconds. Carefully curated by our editors: no hype, no promo flood, no spam.

November 13, 2026 5:48 PM

Bitcoin on Friday the 13th: weekend panic builds as traders eye $60,000
Bitcoin fell to its lowest level since August on Friday the 13th as $1.31 billion in leveraged bets were wiped out. Since 2014, it closed lower on only 3 of 22 such Fridays. What the weekend can bring, the levels down to $60,000 and what long and short positions returned today.
November 13, 2026 8:06 AM

Why Is Crypto Crashing? The 3 Reasons Behind This Brutal Sell-Off
Crypto is bleeding red and billions in leveraged bets just got wiped out. Here are the 3 forces behind the crash and where prices stand right now.

November 13, 2026 7:46 AM

Crypto news, November 13: bitcoin down 6%, over $1.3 billion liquidated
Bitcoin lost a little over 6% overnight and trades below $70,000, with more than $1.3 billion in leveraged positions wiped out. This morning's crypto news with the drivers: liquidations, ETF outflows, the dollar and thin order books.
November 13, 2026 5:15 AM

Bitcoin price falls below $70,000 as $1.3 billion in leveraged bets are wiped out
Bitcoin dropped below $70,000 overnight into Friday for the first time since August, and more than $1.3 billion in leveraged positions were liquidated within 24 hours. The price levels, the triggers and what investors should consider on leverage, custody and record-keeping.
November 12, 2026 5:42 PM

Bitcoin price falls below $72,000: the reasons behind the drop
Bitcoin fell below $72,000 and its 200-day moving average on Thursday, its lowest level since August 20. The Nvidia CEO's resignation, MSCI's removal of Strategy, ETF outflows and rate worries all hit on the same day.
November 10, 2026 11:36 PM

Crypto crash live: Solana and Aave lead the sell-off as markets price a December Fed hike
Hot US inflation data turned a slow slide into a flush: Bitcoin touched its lowest level since August, Solana has lost a quarter of its value in 30 days and Aave fell almost three times as hard as Bitcoin. The live timeline, the reasons and the levels that matter now.

November 10, 2026 9:14 AM

Chainlink lands at Charles Schwab: LINK carries a 0.75 percent fee, but investors in Germany are left out
Charles Schwab added Chainlink to its crypto offering on November 9 and charges 0.75 percent per order. For investors in Germany the route to LINK still runs through licensed exchanges, some of them cheaper, plus the key price levels and the holding period.
November 7, 2026 9:46 AM

Crypto Crash: Why Bitcoin, Ethereum, XRP and Solana Fell This Week and What Comes Next
Bitcoin lost its post-election gains, ETH hit a 10-week low and XRP led the losses. The four drivers behind this week's crypto crash and the levels to watch.
November 5, 2026 5:13 PM

Bitcoin falls below $77,000 as a Nasdaq chip sell-off sets off a liquidation wave
Bitcoin (BTC) dropped from $78,767 to $75,986 within an hour on November 5, and Ether lost more than 6 percent. A sell-off in chip stocks on the Nasdaq set it off, and forced liquidations of more than $560 million deepened the slide.
November 4, 2026 5:20 PM

Ethereum price jumps above $2,400: why Ether is outpacing Bitcoin after the US midterms
Ether (ETH) has recovered almost 8 percent in twelve hours from its US election-night low and is rising faster than Bitcoin (BTC). What is driving the move, which chart levels matter now and what investors in Germany should consider on buying, tax and custody.
November 3, 2026 8:28 AM

Why Is Crypto Down Today? The 5 Reasons Behind the November 3 Sell-Off
Why is crypto down today? Bitcoin sits near $76,000 after the Binance hack, a hawkish Fed and a Nasdaq slide. The five drivers, explained.

November 2, 2026 7:30 PM

Chainlink slips below its 100-day line as long bets shrink by a third
Analysis: Chainlink trades at $11.11 and falls below its 100-day line at $11.36. At OKX the long-short ratio has dropped from 3.18 to 2.10 since October 24, and the 200-day line sits at $10.03.
November 1, 2026 3:39 AM

Chainlink launches CustodySync with Anchorage: “Institutions should not have to choose between qualified custody and on-chain liquidity”
Chainlink presented CustodySync on October 26: custodied institutional holdings are to move into DeFi lending markets as collateral without leaving the custodian. What sits behind the construction, and what is left of it for retail investors.
October 30, 2026 9:14 AM

How Much Would It Take to Bankrupt Binance? The $6 Billion Hack Explained
Binance lost $6.3 billion in the biggest crypto hack ever. How much would it take to bankrupt the exchange, and what does it mean for the crypto market?
October 30, 2026 8:02 AM

Bitcoin Price After Binance Hack: Only 2% Down. What Comes Next?
Bitcoin fell only 2% after the biggest crypto hack ever drained $2.8 billion from Binance. Here are the higher and lower Bitcoin price targets now.
October 30, 2026 6:31 AM

Chainlink drops 11 percent: why LINK falls harder than Bitcoin
Chainlink loses 11.47 percent within 24 hours to 10.42 dollars, falling more than twice as far as Bitcoin. What is behind the drop, the role leverage plays and which levels count for LINK now.
October 29, 2026 9:40 PM

Crypto Crash After Binance Hack: $628 Million Liquidated in One Hour
At 20:24 UTC a Binance hot wallet was drained of about $2.8 billion. Within an hour Bitcoin fell below $79,000 and BNB lost 6.3%. Here is the minute-by-minute timeline, the prices of all major coins and what could come next as Asia wakes up.
October 27, 2026 5:23 PM

China AI Bubble Bursts: $480 Billion Gone, So Why Is Bitcoin Not Crashing?
China’s AI stock bubble has burst, erasing $480 billion as the STAR50 drops 40%. Here is why it happened and what it means for Bitcoin and crypto.
October 26, 2026 7:36 AM

Bitcoin Price Crash: Top 3 Reasons Why BTC Price Dropped Below $80,000
Bitcoin price crashed below $80,000 over the weekend. Oil, ETF outflows and a wave of liquidations explain the move, and the Fed decides this week.
October 25, 2026 10:51 AM

Crypto Crash: Why the Top Cryptos Lost Up to 4% in One Week
Crypto crash week: the largest cryptos lost up to 4% in seven days. We break down why crypto prices are falling and what to watch next.
October 24, 2026 4:23 PM

Chainlink in Korea's $68 Billion Market, LINK Falls to $11.47: Why the Price Is Not Moving
Analysis: LG CNS is wiring Chainlink into its platform for Korea's digital asset market, Archax is using the price data for tokenised US Treasuries, and LINK still stands at $11.47 on Friday afternoon. This article separates the documented contract position from what it means for the price and for investors in Germany.
October 20, 2026 4:32 PM

Chainlink after the withdrawal of 246,800 LINK from Binance: the consequences for price and custody
A single address has withdrawn 246,800 LINK from Binance over four days, roughly $3.06 million at the current price. What that says about tradable supply and what such a transfer triggers for you in tax terms.
October 20, 2026 10:38 AM
Crypto Crash Today: Why Is Bitcoin Stuck Below $82,000?
Bitcoin can't hold $82K, Ethereum is down 20% in 2026 and ETF money keeps leaving. Here is what is really behind the crypto crash today.
October 11, 2026 10:20 AM

Crypto Price Today: Bitcoin Slips Under $85,000 as Markets Brace for a Big Week
Bitcoin trades near $83,000 after a red week for crypto. Here is the crypto price today, who is bleeding, who is pumping, and what to watch next.
October 8, 2026 5:06 PM

Crypto Crash Reason: Why Bitcoin Fell Below $81,000 and Altcoins Bled Even Harder
Bitcoin slid under $81,000 and Ethereum lost 9% in a week. Here is every crypto crash reason behind the October 2026 selloff explained.
October 8, 2026 4:38 AM

Crypto Market Slides: Bitcoin Loses 4.2 Percent and $651 Million of Long Bets Are Liquidated
Bitcoin has lost 4.2 percent since Tuesday afternoon, and ether and XRP more still. Three reasons can be documented: outflows from the US ETFs, $651 million of forcibly closed long bets and Fed minutes holding out the prospect of another rate rise. A crash it is not, and what to check before buying more is set out here.

More from CryptoTicker