
Bull flag and bear flag: how to check the pattern against trading volume
Bull flags and bear flags are continuation patterns: after a steep pole, the price pauses briefly in a sloping channel before the trend resumes. What matters is volume, the closing price and sober arithmetic, because in the best-known statistics almost every second flag fails.


Which topics should we dive deeper into?
Select what genuinely interests you. Your picks feed directly into our editorial planning.
Crypto news that's actually worth your time.
Weekly. 60 seconds. Carefully curated by our editors: no hype, no promo flood, no spam.
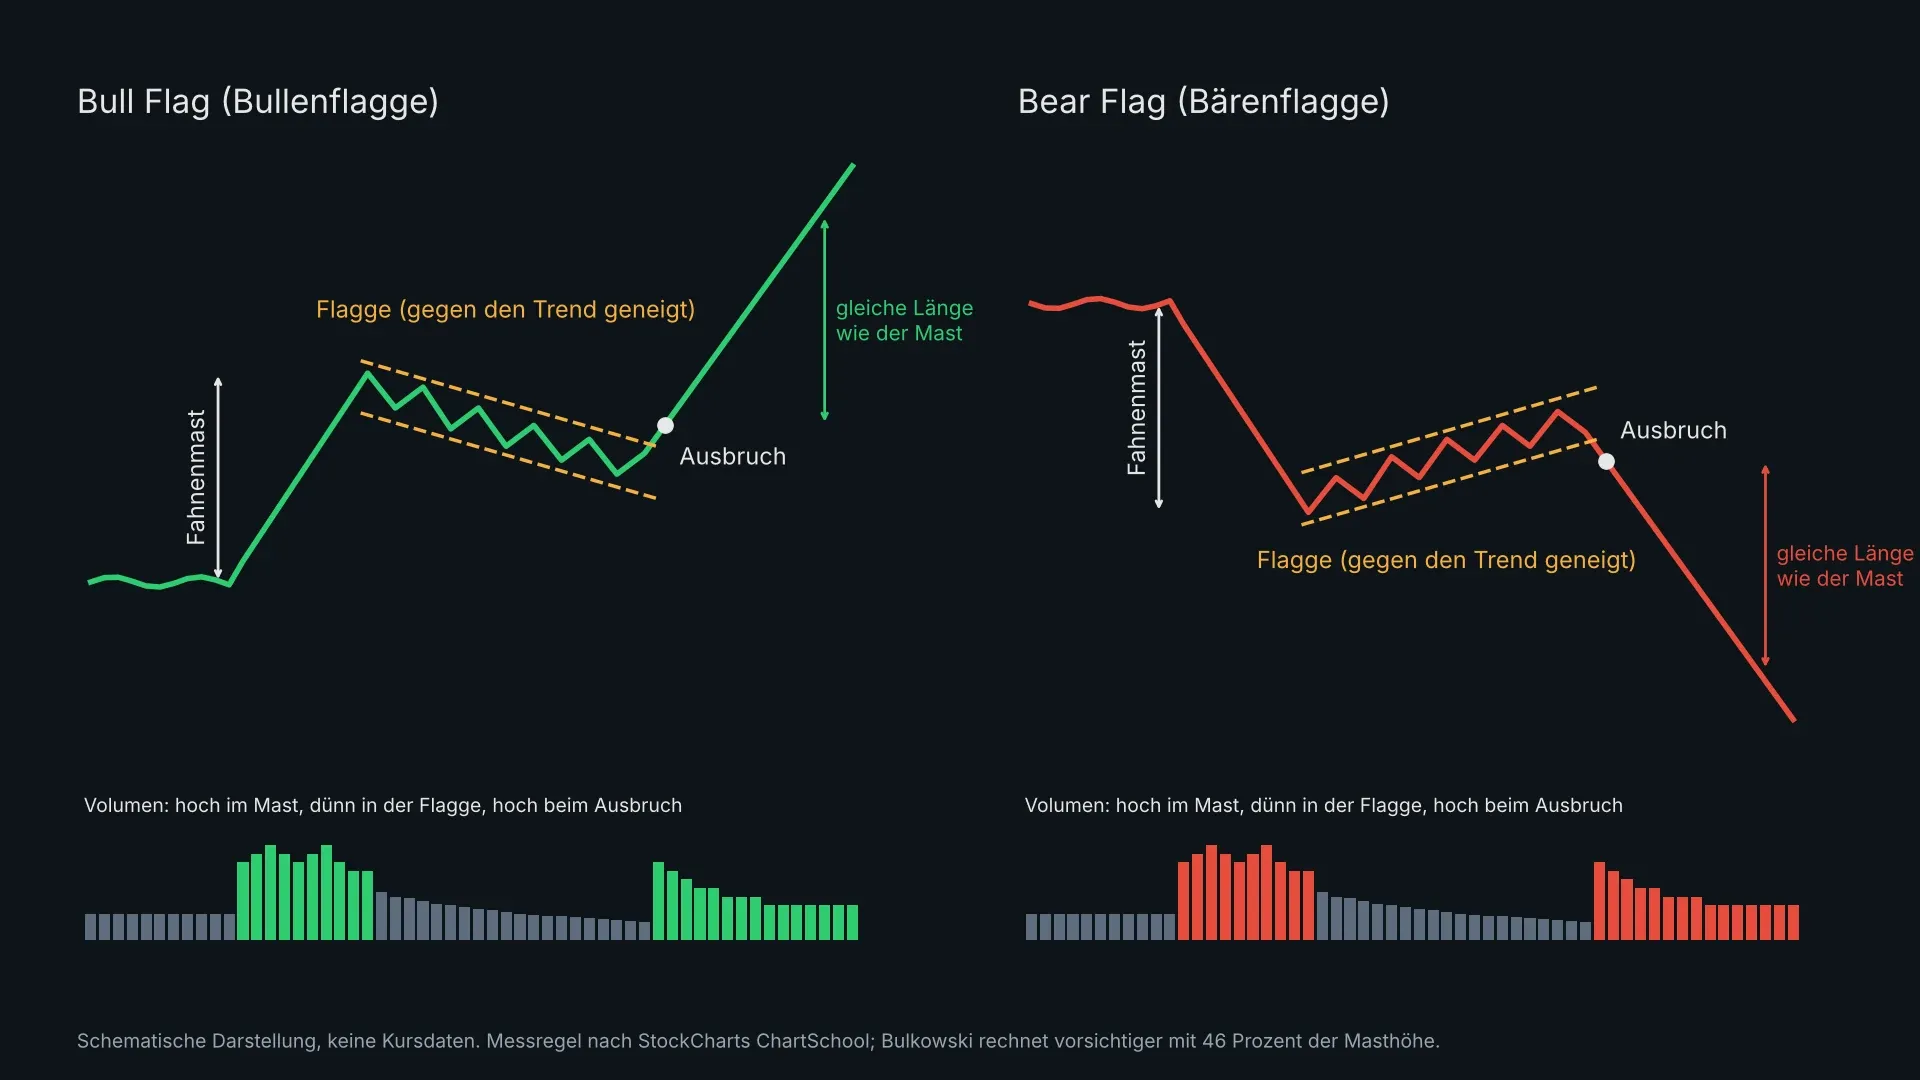
A bull flag is a chart pattern in which the price takes a short breather after a steep rise and consolidates in a narrow, slightly downward-sloping channel before the uptrend resumes. A bear flag is its mirror image in a downtrend: after a sharp decline, the price recovers tentatively in a slightly rising channel, and then the fall continues. In technical analysis, both formations count as continuation patterns. Neither signals a trend reversal; they describe a pause within a move that is already under way.
Flags appear constantly in crypto trading, on the chart of Bitcoin as well as on ether or smaller altcoins, because crypto prices cover long distances in a few days. To read the pattern you need a chart with a volume display and a tool for drawing trendlines. Which platforms do this well and what they cost is shown in our comparison of crypto analysis tools. What counts, though, is less spotting the pattern than testing it: without a clear pole, without fading volume inside the flag and without a close outside the channel, every flag remains a guess.
How often that guess is wrong was counted for the stock market by the US author Thomas Bulkowski. In his statistics on flags, 44 percent of upward breakouts fail to deliver even a 5 percent gain. This article explains how both flags are built, the role of volume, how to calculate the price target and the quirks that set crypto charts apart from stock charts.
Bull flag on the chart: flagpole, flag and breakout as three building blocks
Every flag consists of three parts, and if one is missing, it is not a flag. It starts with the flagpole, sometimes simply called the pole in textbooks. This is a steep, almost straight price move over several days that runs much faster than the price action before it. Bulkowski puts it bluntly: without such a quick, straight rise there is no flag, and the strongest flags hang from a long, almost vertical pole. The ChartSchool from StockCharts adds that the pole usually breaks through resistance or a trendline and forms on high trading volume.
The second part is the actual flag. A flag is a small rectangle that slopes against the prior trend: after a rise it points slightly downwards, after a decline slightly upwards. The price swings between two parallel or almost parallel trendlines. This consolidation phase is the market’s breather. In technical analysis, consolidation means that after a strong move the price fluctuates in a narrow range, sideways or slightly against the trend, while buyers and sellers reorganise their positions.
The third part is the breakout. In a bull flag, the price breaks through the upper trendline of the channel and the previous upward move continues. Only with this breakout is the pattern complete. As long as the price stays inside the channel, the flag can still turn into a longer rectangle, a downtrend or a trend reversal.
Tight flag versus loose correction
Not every correction after a rise is a flag. Bulkowski distinguishes between tight and loose flags: a loose flag meanders, repeatedly pokes through its boundary lines, leaves large gaps in the channel or looks ragged. In his analysis, tight flags perform better. According to his data, the best results come from flags that slope downwards after a rise, in other words exactly the textbook picture of a bull flag.
Bear flag: the mirror-image continuation pattern in a downtrend
The bear flag works in the opposite direction. The pole is a sharp price slide, the flag a brief recovery in a slightly rising channel, and the breakout comes below the lower trendline. For traders who bet on a rebound after the slide, this phase is treacherous: the countermove looks like stabilisation, but it carries little volume and ultimately ends with the next decline.
In the crypto market, steep downward poles can form in phases when leveraged long positions are forcibly closed. How such liquidations of leveraged positions unfold and why they accelerate price moves is explained in a separate article. A pole made up mainly of forced selling says little about the willingness to sell afterwards, however. Whether the subsequent recovery becomes a bear flag is only decided at the breakout.
Which direction is more common
In Bulkowski’s data set, flags break out upwards in 60 percent of cases. He analysed flags from a bull market in equities, a phase in which upward moves predominate. A bear flag is therefore not a rare special case; it simply forms less often while the overall market is rising.
How long a flag lasts: when consolidation turns into a rectangle
A flag is a short pattern. Opinions differ on how short. Bulkowski draws the line at three weeks: anything longer is, for him, a rectangle or a trend channel. StockCharts’ ChartSchool is more generous and cites a duration of one to twelve weeks, ideally one to four weeks. It considers patterns of eight to twelve weeks questionable, and from twelve weeks it, too, speaks of a rectangle.
In practice this means: the longer the pause lasts, the more the flag loses its character as a short breather. Both sources refer to daily charts from stock trading with five trading days a week. Crypto exchanges trade seven days a week, so a week there comprises seven daily candles instead of five. Anyone looking for flags on a four-hour or hourly chart cannot transfer the week figures directly in any case. There is no proven conversion key for this; the ratio to the pole remains the guide: the flag should be clearly shorter than the move it interrupts.
 Compare crypto charts with volume and trendlines
Trading volume as confirmation: heavy volume in the pole, thin volume in the flag
Volume is the most important test of any flag. According to the ChartSchool, volume should be high during the pole, because only high volume makes the rapid move credible. Within the flag itself, volume should decline, and at the breakout it should pick up noticeably again. A breakout on rising volume suggests that the previous move really is continuing.
Bulkowski’s figures support the picture of shrinking volume inside the flag: for flags with an upward breakout, volume fell within the flag in 74 percent of cases, and for downward breakouts in 77 percent. Falling volume is therefore the norm, not a guarantee. If it is absent, the risk rises that the channel hides distribution, with larger addresses offloading their holdings into the countermove.
Breakout without volume: the ChartSchool’s textbook example
How important confirmation is can be seen in the example the ChartSchool uses to explain the flag: HP’s stock. The price rose from $28 to $38 in four weeks, after which a downward-sloping flag formed over 23 days. The first breakout above the upper line came without higher volume and was unconvincing. A week later the stock gapped higher at the open and closed on above-average volume; only that was the real confirmation. For your own trading this means a single wick above the trendline is not yet a signal.
Price target with the measured move: the length of the flagpole as the yardstick
The classic price target of a flag follows from the measured-move rule. The length of the flagpole is added to the breakout point, or subtracted from it in a bear flag. In the ChartSchool example, the pole measured $10 and the breakout came at $36, so the calculated target was $46. The logic: the flag roughly marks the middle of a move, and the second leg should carry about as far as the first.
Bulkowski considers this calculation imprecise and proposes a more cautious variant. He measures the height of the entire price move from the start to the top of the pole, multiplies it by the share of flags that reached their target in his data and applies the result at the bottom of the flag. That share is 46 percent. His formula therefore produces much closer targets.
Worked example of a bull flag with round numbers
A coin rises from $10 to $13 in a few days, so the pole is $3 long. The price then swings in a downward-sloping flag between $13 and $12 and breaks out above the upper trendline at $12.60. Under the classic measured-move rule, the target is $12.60 plus $3, i.e. $15.60. Under Bulkowski’s variant, 46 percent of $3 is about $1.38; applied at the flag bottom of $12, that gives $13.38. The two targets are more than $2 apart, a range of almost 20 percent at a price of just over $12.
Worked example of a bear flag
Another coin falls from $50 to $40, so the pole measures $10. The recovery climbs in a rising channel to $43, and the downward breakout comes at $41.50. Calculated the classic way, the target is $31.50. Bulkowski’s variant subtracts 46 percent of $10, i.e. $4.60, from the flag high at $43 and lands at $38.40. Both figures are calculated values from a model, not a forecast for any particular coin.
How reliable is a bull flag? Bulkowski’s statistics with 44 percent failed breakouts
One of the best-known public analyses of the success rate comes from Thomas Bulkowski, author of the “Encyclopedia of Chart Patterns”. His figures for flags are based on several hundred patterns from the US stock market during a bull market; he last updated the statistics in August 2020. The key figures at a glance:
- Failed breakouts: 44 percent of flags with an upward breakout and 45 percent with a downward breakout fail to move at least 5 percent. Bulkowski calls this the break-even failure rate, because such trades earn next to nothing after costs.
- Average move: after the breakout, the price rises 9 percent on average; after downward breakouts it falls 8 percent. Here Bulkowski measured only the short-term price swing.
- Target reached: in 46 percent of cases the price reached the measured-move target, equally often in both directions.
- Direction: 60 percent of flags broke out upwards.
- Better results: tight flags, a long, almost vertical pole, a downward-sloping flag after a rise and breakouts in the lower third of the range between the yearly low and the yearly high.
These values are based on idealised trades and apply to the stock market. They can only be transferred to Bitcoin and altcoins as a rough guide, because cryptocurrencies trade around the clock and are more volatile. The core message still holds: almost every second flag delivers too little movement after the breakout to be worth it. Anyone trading flags therefore needs a plan for when the pattern fails.

Stop-loss and entry: where the flag loses its validity
Chart technicians usually only enter a bull flag once the price closes above the upper trendline. A long position, a bet on rising prices, is thus only opened after the breakout is confirmed, not on the mere hope of one. For a bear flag, the counterpart applies: a close below the lower line.
A stop-loss is an order that automatically closes a position as soon as a set price is reached. In a bull flag, it usually sits just below the lowest point of the flag, because if the price falls there, the pattern has failed. In a bear flag, it sits correspondingly just above the flag high.
Reward and risk in the worked example
Back to the coin with the breakout at $12.60: with the stop at $11.90, just below the flag bottom of $12, you risk 70 cents per coin. With the classic target of $15.60, that is set against a potential gain of $3, a ratio of just over 4 to 1. With Bulkowski’s cautious target of $13.38, the gain is only 78 cents and the ratio shrinks to about 1 to 1. Which calculation you use therefore decides whether the trade is worth it at all. Decide in advance the maximum amount you are prepared to lose at this stop, and derive the position size from it.
Bull trap and failed flag
A bull trap is an upward breakout that quickly falls back into the formation and leaves buyers with a loss. Bulkowski describes the extreme case as a busted pattern: after the breakout, the price moves no more than 10 percent, then turns and breaks through the opposite side of the formation. A supposed bull flag then becomes a signal in the other direction.
 Compare crypto exchanges with stop orders
Flags in crypto charts: round-the-clock trading, leverage and fragmented volume
The rules for flags come from stock trading. The crypto market adds three peculiarities that you should take into account when reading the chart.
No official close. Bitcoin and other coins trade around the clock, seven days a week. The closing price of a daily candle is therefore set by your chart’s time setting; there is no closing bell. Many platforms close the daily candle at midnight UTC, and some charting services let you choose the time zone freely. If you want to confirm a breakout on the close, you should know at what time your candle ends, otherwise the same chart looks different depending on the setting.
Leveraged poles. Steep moves in the crypto market can originate in the derivatives market, where traders use leverage. When positions there are liquidated in waves, the price shoots up or down within a short time. Such a pole looks impressive on the chart, but it is partly based on forced buying or selling rather than new demand. Swings like this can also be observed regularly in Ethereum.
Fragmented volume. A coin trades on dozens of exchanges at the same time. The volume on a single exchange’s chart shows only part of the market. For checking a flag’s volume, charting services that aggregate volume across several venues are therefore better suited, or at least the exchange with the largest volume in the trading pair concerned.
Many traders also combine the flag with indicators. One example is the Relative Strength Index, which shows whether a market is overbought or oversold; how to read the RSI for Bitcoin correctly is explained separately. Because flags usually run for days to a few weeks, they fit well with swing trading in crypto, where positions are held for a few days to weeks.
Pennant, wedge and rectangle: how the flag differs from similar chart formations
The flag has several relatives that are easy to confuse. The pennant also forms after a pole, but its boundary lines converge like a small symmetrical triangle, and it usually has hardly any slope. The flag, by contrast, has parallel lines and a clear slope against the trend. According to the ChartSchool, the same rules for volume and price targets apply to both.
The rectangle is essentially a flag that lasts too long. Depending on the source, it begins after three weeks or after twelve weeks of sideways movement. A pennant that runs longer than twelve weeks becomes a symmetrical triangle, according to the ChartSchool.
The wedge is a formation in its own right with its own rules. If both lines converge while rising or falling markedly, chart technicians speak of a rising or falling wedge. If you want to tell candles and patterns apart cleanly, the basics of candlestick charts are covered in our article on candlestick patterns using the Ethereum price as an example.
Common bull flag mistakes: a flag without a pole and a breakout without a close
Many false signals stem from being too generous in spotting the pattern rather than from the pattern itself. These mistakes come up particularly often:
- Flag without a pole: a sideways phase after a leisurely rise is not a flag. Without a steep pole, the pattern lacks its foundation.
- Flag that runs too long: if the consolidation lasts longer than the pole itself, the pause has become a new market phase.
- Rising volume inside the flag: if volume grows during the countermove, more market participants are fighting there than a breather would suggest.
- Entering on the first wick: a brief spike above the trendline without a close above it is not yet confirmation.
- Treating the target as a certainty: the measured-move rule produces a calculated value. In Bulkowski’s data, not even every second flag reached its target.
Bull flag: only a close outside the flag counts
Bull flags and bear flags are among the best-known chart patterns because they look simple. They only become reliable when the pole, volume and breakout fit together. If you want to use flags in your crypto charts, proceed in three steps:
- Choose a charting tool that draws trendlines and shows volume across several venues. Which providers deliver this is compared in our overview of crypto analysis platforms.
- Set alerts on the flag’s upper and lower trendlines instead of watching the chart around the clock. How automated rules and notifications work is shown in our comparison of crypto trading bots.
- Only trade on a venue that supports stop orders and is authorised under the European MiCA regulation. Fees and order types are in our comparison of the best crypto exchanges.
(As of November 9, 2026. This article is not investment advice. Prices and fee structures change; check the terms with the provider before you buy.)
Frequently asked questions about bull flags and bear flags
Transparency note: This article was produced with the assistance of artificial intelligence and reviewed by our editorial team before publication. All figures and claims were checked against the primary sources linked in the text. The feature image was generated with AI.
Related articles
- Swing trading crypto: in Germany every euro counts once annual gains reach €1,000
- Crypto News This Week: What Happened Since November 1 and the Key Dates for November 9 to 15
- Coin of the future: Which cryptocurrency should you buy for 2030?
- Crypto Fear and Greed Index at 28: What Happened Every Time the Market Hit Extreme Fear
- Crypto Crash: Why Bitcoin, Ethereum, XRP and Solana Fell This Week and What Comes Next
Which topics should we dive deeper into?
Select what genuinely interests you. Your picks feed directly into our editorial planning.
Crypto news that's actually worth your time.
Weekly. 60 seconds. Carefully curated by our editors: no hype, no promo flood, no spam.

November 7, 2026 9:16 AM

Russia Opens Crypto to Retail Investors on November 17: What Bitcoin, Ethereum and USDT Access Really Means
Russia's central bank lets ordinary investors trade Bitcoin, Ethereum and USDT from November 17. Caps, exclusions and why XRP didn't make the list.

November 6, 2026 9:30 AM

Crypto Bubbles explained: the bubble map shows 1,200 coins but not their quality
Crypto Bubbles shows the crypto market as a field of green and red bubbles. By default, the size measures only the price move, and that is exactly where the most common misreadings come from.
November 6, 2026 5:32 AM

Bear market: what it means, how long it lasts and where stocks and Bitcoin stand in 2026
Bitcoin has been in a bear market since November 2025, and the Nasdaq 100 is closing in on the threshold. What a bear market is, how long it lasts on average, how to spot its end and what you can do now, worked out from 27 S&P 500 bear markets since 1928.
November 4, 2026 7:20 AM

Crypto futures in the EU: six licensed exchanges compared, all capped at 10x
As a retail trader in Germany, you can trade crypto futures legally on six exchanges with an EU licence, all capped at 10x leverage for retail clients. The comparison covers contract design, fees, collateral and what ESMA's February statement changes for you.
November 3, 2026 6:27 PM

Crypto Monthly Recap October 2026: Binance Hack, Bitcoin Down 7% and 18 of 20 Coins in the Red
The crypto market lost about 9 percent in October 2026, Bitcoin 7.3 percent and Ether 16 percent. The month by the numbers: winners and losers among the top 20, 35 hacks worth $6.5 billion, the shift from greed to fear and what to watch in November.
November 3, 2026 1:58 AM

Crypto Hack News: Every Attack Since the Binance Hack and How to Stay Safe
Binance, Mercado Bitcoin, BTCPay Server, a WordPress plugin and hijacked WhatsApp accounts: since 29 October hardly a day has passed without a crypto hack. Every case with its status, the loss and the steps that keep you safe now.
October 27, 2026 5:23 PM

China AI Bubble Bursts: $480 Billion Gone, So Why Is Bitcoin Not Crashing?
China’s AI stock bubble has burst, erasing $480 billion as the STAR50 drops 40%. Here is why it happened and what it means for Bitcoin and crypto.
October 25, 2026 10:51 AM
Crypto Crash: Why the Top Cryptos Lost Up to 4% in One Week
Crypto crash week: the largest cryptos lost up to 4% in seven days. We break down why crypto prices are falling and what to watch next.
October 24, 2026 6:00 PM

a16z Drops "Crypto" From Its Name: What the $2.2 Billion Pivot Means for the Market
Andreessen Horowitz renamed a16z Crypto to a16z Frontier and opened its $2.2 billion fund to AI and robotics. Here is what the pivot signals for crypto.
October 22, 2026 10:33 AM

Bitcoin crash history: every fall of more than 50 percent since 2011
Analysis: seven times since 2011 Bitcoin has lost more than half its value, most recently 53 percent to June 2026. Every crash with its high, low, duration and recovery, the triggers from Mt.Gox to the tariff liquidations, and what investors can take from them.
October 19, 2026 4:15 AM

Crypto FIFO across several exchanges: each wallet counts on its own in Germany
Hold bitcoin on several exchanges and in wallets of your own, and the holding period is calculated per pot, not across the total holding. What paragraph 62 of the BMF guidance orders, and why 31 December 2026 hangs on it.
October 11, 2026 4:50 AM

90 Crypto Kidnappings and Robberies in 7 Months: Why France Is the Most Dangerous Country for Bitcoin Holders
France logged 90 crypto kidnappings, extortions and violent thefts this year, one every 2.5 days. Leaked tax data is to blame. Here is how to protect yourself.
October 8, 2026 4:17 AM

Crypto Holding Period: Without a Purchase Record the Tax Withheld Runs Ten Times Too High
The consultation on Germany's crypto tax bill closed on October 6 and the cabinet is to adopt it on October 14, with tax advisers, banks and the Bitcoin Bundesverband having filed their objections. The sharpest concerns everyone whose purchase data the selling platform does not hold: one adviser calculates a withholding ten times the tax owed.
October 5, 2026 1:40 AM

Crypto at comdirect: 29 certificates with no order fee in a savings plan, but not a single coin
comdirect puts crypto into your securities account as a certificate, not as a coin. Our count of October 4, 2026 shows 29 securities from five issuers on 12 cryptocurrencies. On a one-off purchase the minimum fee of 9.90 euros amounts to 9.90 percent on 100 euros invested; in a savings plan the 1.5 percent is waived until the end of 2027.
October 1, 2026 7:36 PM

Crypto tax and withholding at source from 2028: what to check now
The German Federal Ministry of Finance’s draft bill goes to cabinet on October 14, 2026. The underexposed part of it is the deduction of tax from 2028: which providers are to withhold the tax on investment income, why self-custody and foreign platforms stay exempt from it, and what you should document by December 31.
September 29, 2026 11:10 AM

CLARITY Act 2.0: What Happens to US Crypto Regulation After the Senate Defeat?
The CLARITY Act failed 49-50 in the Senate. A rewrite is taking shape while the SEC and CFTC move on their own. Where US crypto regulation stands now.
September 26, 2026 1:19 AM

Germany’s Crypto Holding Period Is Wobbling: What to Check Before December 31
A CDU member of the Bundestag makes it plain: the coalition agreement does not guarantee that the one-year holding period for crypto assets will survive. What that means for purchases made before the planned cutoff date of December 31, 2026.
September 24, 2026 10:28 PM

Can Bitcoin Be Seized? What Creditors and Insolvency Administrators May Do with Crypto Assets
Crypto assets can be seized in Germany, and the Berlin Higher Regional Court has confirmed it at appellate level. What matters is the route of access: if the coins sit with a provider, an attachment order suffices; with self-custody the law reaches for the debtor in person.
September 21, 2026 11:44 AM
XRP Price Breaks Its Downtrend: Is $2 Finally In Sight?
XRP just snapped the trendline that capped it all September. Here is what the chart says about $1.50, $1.80 and the road to $2.
September 18, 2026 10:31 AM
3 Reasons Crypto Is Still Holding Strong After the Fed Rate Hike
The Fed hiked, the CLARITY Act died, and crypto barely moved. Here are three reasons the market is consolidating rather than breaking down.
September 9, 2026 10:11 PM
Crypto Trading for Beginners: Order Types, Charts and Risk Explained
Trading is a different exercise from buying and holding. This introduction explains the three order types, what a chart really shows, how position size is calculated and what trading triggers for your taxes.
September 9, 2026 7:11 PM

German Crypto Tax Return: Where to Enter Gains, Losses and Staking in Anlage SO
In Germany, crypto gains belong in Anlage SO, and staking and lending go in a separate section of the same form. Which lines of the 2025 form apply, when you do not have to enter anything, how to keep your losses and which deadlines are running now.
September 9, 2026 1:15 AM

Germany's Crypto Tax: 160 Million Euros for a 555-Billion Budget
The German finance ministry's draft bill puts a figure on the crypto tax for the first time: 160 million euros from 2028. What that number means in the 2027 federal budget, how 11.4 billion became 160 million, and what investors can read from it.

June 29, 2026 10:01 AM

AI Bubble Crash Warning: Could It Send Bitcoin to $20K?
The AI rotation already dragged crypto down — but analysts warn the real AI bubble crash is still ahead. Here's the bear case for Bitcoin at $20K, ETH at $800.
May 14, 2026 3:55 PM
US Stock Market Adds $11 Trillion in 45 Days: Is a Crypto Rotation Imminent?
The US stock market just added $11 trillion in value. Discover why this massive liquidity surge signals a bullish rotation for Bitcoin and altcoins.

More from CryptoTicker