

TradingView Reviews
The de facto standard for charting: 400+ indicators, its own scripting language and alerts, at higher prices since April 2026.

TradingView Rating
Our Opinion
TradingView is something few other tools in the crypto market have achieved: a standard everything else is measured against. More than 400 built-in indicators, over 100,000 community indicators, drawing tools, multi-chart layouts and a replay mode for stepping through historical moves cover practically any analytical need. Pine Script allows custom indicators and strategies.
The free tier is enough for a first impression but runs into limits quickly: two indicators per chart, one chart per tab, one saved layout and advertising. The paid tiers are called Essential, Plus, Premium and Ultimate and cost $14.95, $34.95, $69.95 and $239.95 a month. In April 2026 TradingView raised prices across every paid tier; paying annually lowers the monthly rate by roughly 13 to 17 percent depending on tier.
Two practical caveats: TradingView shows prices in local currency in many regions, in the eurozone in euros at the same figures, and VAT or sales tax may be added depending on location; real-time data for individual exchanges is partly a paid add-on. For pure crypto work that barely matters; anyone also analysing equities should check data costs first.

Pros & Cons
- More than 400 built-in indicators, over 100,000 community indicators and more than 110 drawing tools
- Custom indicators and strategies via Pine Script
- Replay mode for stepping through historical price action
- Alerts with webhook delivery
- Full iOS and Android apps with cross-device sync
- Paid tiers cost $14.95 to $239.95 a month, after a price rise in April 2026
- VAT or sales tax may be added to the displayed price depending on location
- Real-time data for individual exchanges partly a paid add-on
- Free tier carries advertising and tight limits: 2 indicators per chart, 1 chart per tab, 3 price alerts
- Chart data export as CSV only from the Plus tier, Deep Backtesting only from Premium
User Experiences
AI AnalysisOur AI collects and analyzes user reviews of TradingView from the web and summarizes the key findings.
The interface is professional yet approachable and highly customisable. Alongside the web version there are desktop applications and iOS and Android apps that sync work across devices. As of August 2026.
Provider details (fees, licences, pros and cons) editorially reviewed: November 2026. Editorial assessment based on publicly documented provider information. Plan pricing and feature sets can change at short notice. This comparison is not investment advice. All information without guarantee.
Features
Highlights
- Industry standard for charting
- Pine Script for custom indicators
- Alerts automatable by webhook
- More than 100 connected exchanges
Tradeable Assets
- Cryptocurrencies across all major exchanges
- Equities, forex and commodities
- Indices
Trading Options
- Multi-timeframe chart analysis
- Alerts and notifications
- Backtesting in replay mode
- Broker integration for trading from the chart
Compare TradingView







Recent articles about TradingView

January 22, 2026 2:51 PM

Bitcoin Price Prediction: Will Geopolitical Tensions Push BTC Below $85,000?
Bitcoin price faces heavy pressure as geopolitical tensions over Greenland and US-EU trade wars trigger a flight to safety. Can BTC hold key support?

Similar articles on this topic
November 21, 2026 11:06 PM

Bitcoin Crash Warnings Fact-Checked: Tether's Buffer, Kraken's Glitch and the 'Worst Monday of 2026'
Viral posts on X warn that Monday will be the worst day of 2026, that Tether (USDT) could lose its backing and that bitcoin (BTC) sold for $27,000 on Kraken. We checked nine claims against primary sources: at today's prices, Tether's buffer has shrunk to an estimated $2.8 billion to $3.6 billion.
November 21, 2026 1:02 PM
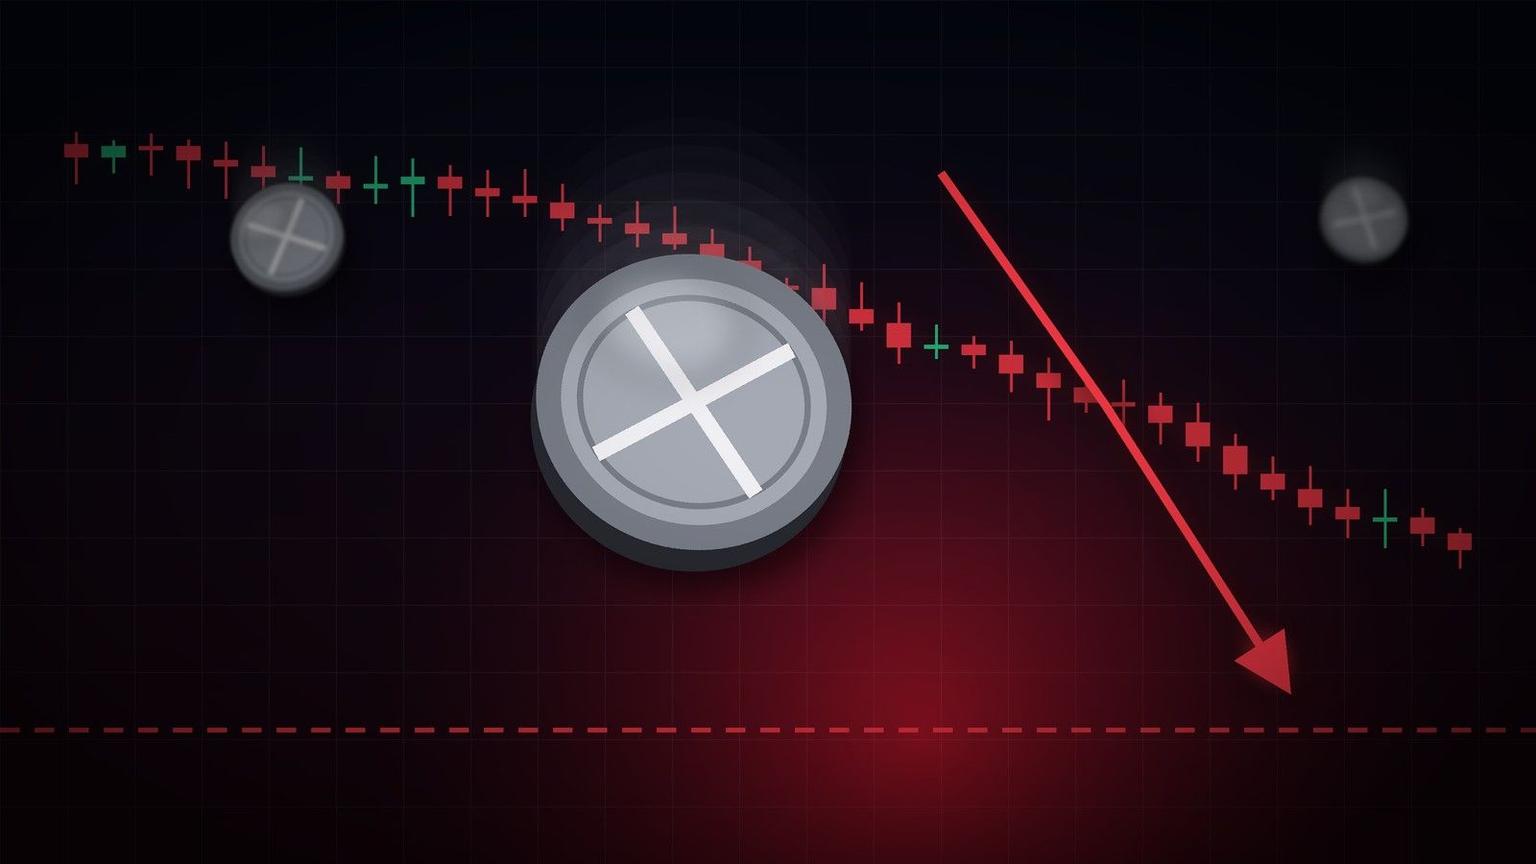
XRP price prediction: will XRP crash to $0.50?
XRP fell to its lowest level since November 2024. What it would take for a crash to $0.50, and which levels could stop the slide.
November 21, 2026 12:01 PM
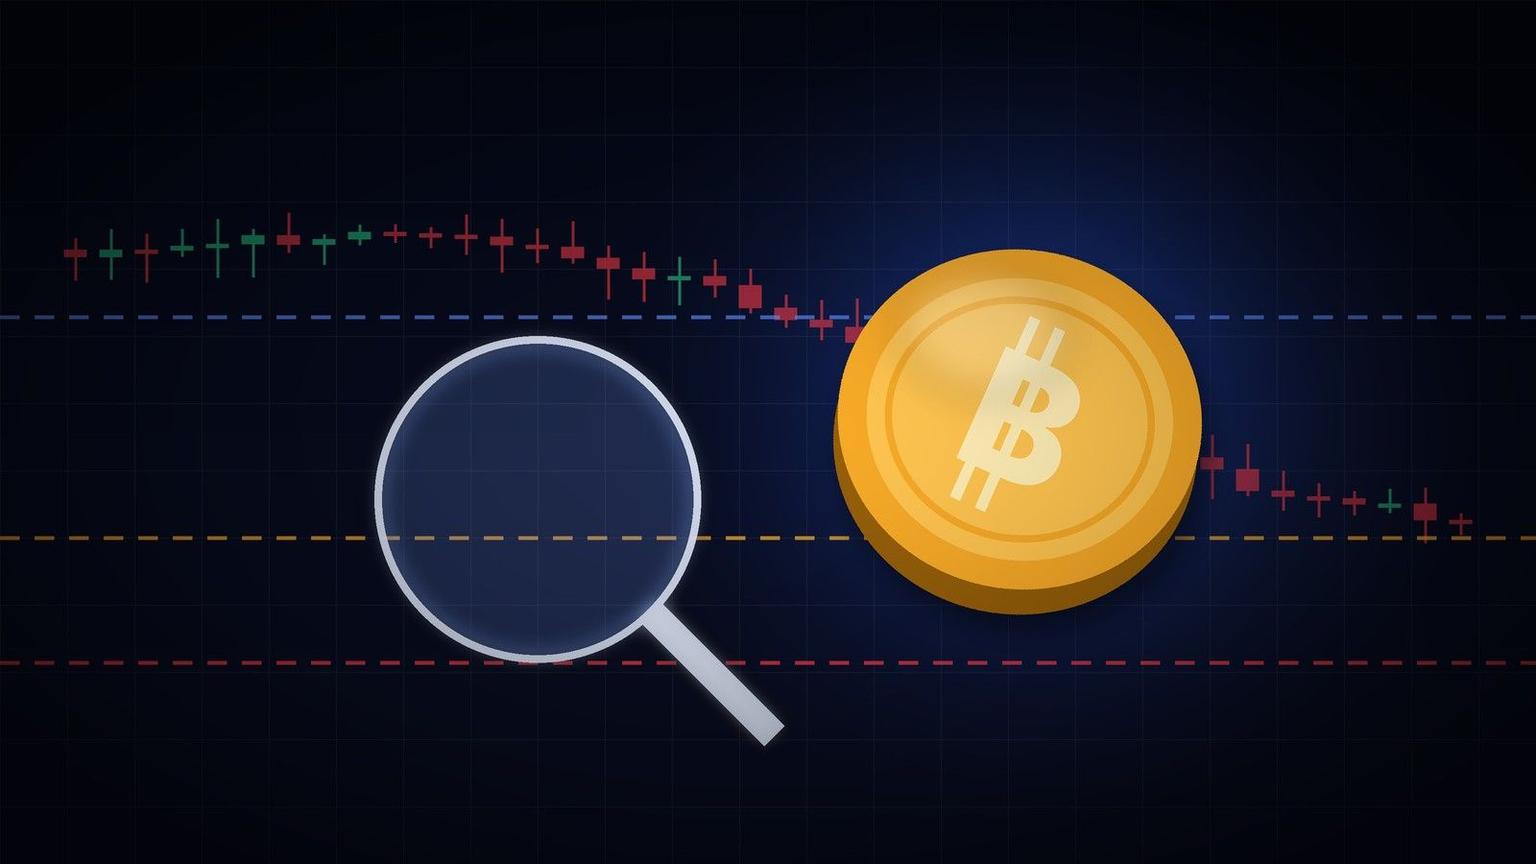
Bitcoin price analysis: BTC breaks the July low, is $50,000 next?
Bitcoin trades below its 200-week average and the daily RSI sits at 17. These are the levels that decide whether the crash runs to $50,000.
November 21, 2026 11:22 AM

Bitcoin breaks its $57,700 summer low as a record $950 billion of capital sits at a loss
Bitcoin fell below its summer low of around $57,700 overnight into Saturday, and more invested capital than ever is now below its cost basis. Which levels matter now, and what ETF outflows, liquidations and moving averages mean for the coming weeks.
November 21, 2026 10:56 AM
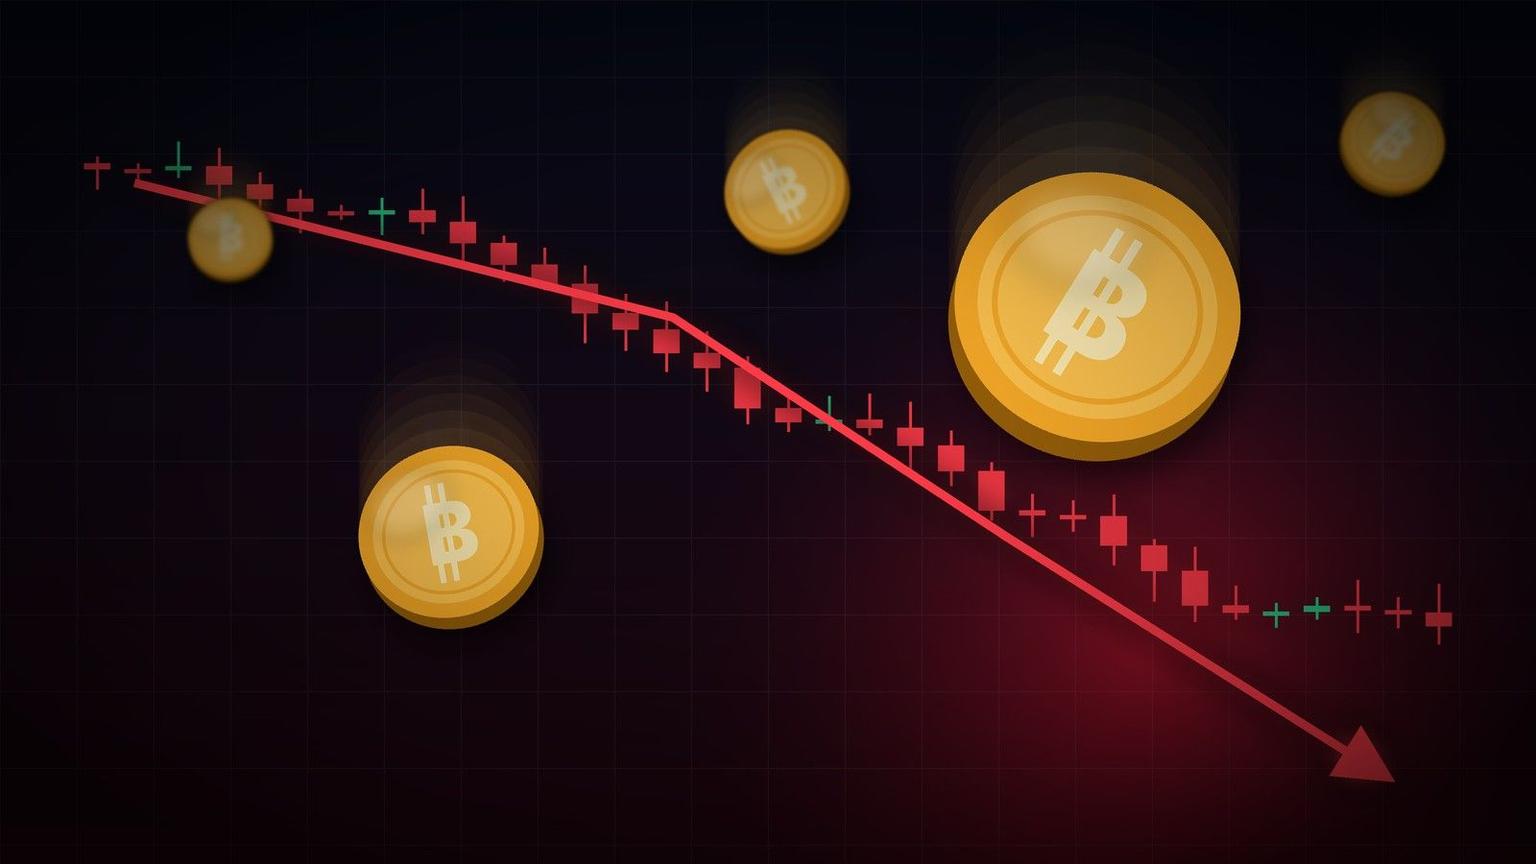
Why is crypto crashing? Here are 7 reasons bitcoin keeps falling
Bitcoin hit its lowest level since September 2024 as $2.6 billion in leveraged bets were wiped out. Here are the 7 forces behind the crypto crash.

November 21, 2026 9:21 AM

BNB price drops 10.3 percent below $520, a level last seen in March 2025
BNB loses 10.3 percent in the market slide and falls to around $512, its lowest level since March 2025. The coin is mainly tracking the overall market, with liquidations of more than $2.4 billion, while the aftermath of the Binance hack hangs over the price.

November 21, 2026 7:19 AM

Zcash price drops 21 percent: ZEC slides below $700 to its lowest level since August
Zcash loses 20.8 percent in the market sell-off and slides to around $687, its lowest level since August 21. Besides the bitcoin low, the ongoing vote on the ZCG treasury and outflows from the Grayscale fund are weighing on the price.